
During the Covid-19 pandemic, American motorists have decreased their amount of driving precipitously as they worked remotely instead of commuting and stayed at home instead of going out to restaurants, shows, and sporting events. Counterintuitively, however, that has not resulted in safer roads. Here’s more on the impact of COVID-19 on traffic in America’s largest cities.
“Unfortunately, the pandemic and the resulting economic dislocations and stay-at-home orders have been accompanied by a sharp increase in risky driving and fatal crashes,” wrote the National Highway Traffic Safety Administration (NHTSA) in January, in ”An Open Letter to the Driving Public.”
Before 2020, driving was already risky enough. In 2019, road accidents killed more than 36,000 people in the U.S. and injured more than 2.7 million, according to NHTSA.
Preliminary data for 2020, the agency said, suggests a sharp increase in risky behavior behind the wheel and more fatal crashes. People were driving faster in select metropolitan areas, were driving while impaired by drugs or alcohol, and were not wearing seat belts. (In April of last year, double the usual number of people were thrown from their vehicles during crashes.)
Some U.S. cities are more perilous than others. In addition to differences in driver behavior, this may be due to the fact that speed limits and other traffic safety laws vary from state to state, and the fact that road maintenance is better in some places than others. These are America’s 50 worst cities to drive in.
This ranking of America’s most dangerous cities for drivers as of 2019 is based on information collated from both governmental and private sources by the RV rental company Outdoorsy.
Click here to see the most dangerous cities for driving.
Researchers from Outdoorsy, an RV rental company, analyzed data from the National Highway Traffic Safety Administration’s Fatality Analysis Reporting System, the U.S. Census Bureau’s 2019 American Community Survey, and Allstate America’s Best Drivers Report 2019. Outdoorsy created a composite index, combining relative likelihood of a collision, total motor vehicle fatalities, and share of fatal collisions involving a drunk driver. Only major American cities with data available from all three data sources were included, and in the event of a tie, the city with the longest period between collisions ranked better.
Two states did rank particularly poorly: Texas, with eight places on the list, and California, with five. There’s no reason to think that final statistics from 2020 will look any better.

25. Riverside, California
> Avg time between collisions: 8.3 years
> Likelihood of collision compared to US avg: +28.2% — #63 out of 194 cities
> Motor vehicle fatalities per 100k: 9.2 — #69 out of 194 cities
> Population: 331,369
[in-text-ad]

24. Lancaster, California
> Avg time between collisions: 9.1 years
> Likelihood of collision compared to US avg: +16.3% — #98 out of 194 cities
> Motor vehicle fatalities per 100k: 13.8 — #24 out of 194 cities
> Population: 157,604

23. Savannah, Georgia
> Avg time between collisions: 7.7 years
> Likelihood of collision compared to US avg: +37.8% — #42 out of 194 cities
> Motor vehicle fatalities per 100k: 12.1 — #35 out of 194 cities
> Population: 144,457
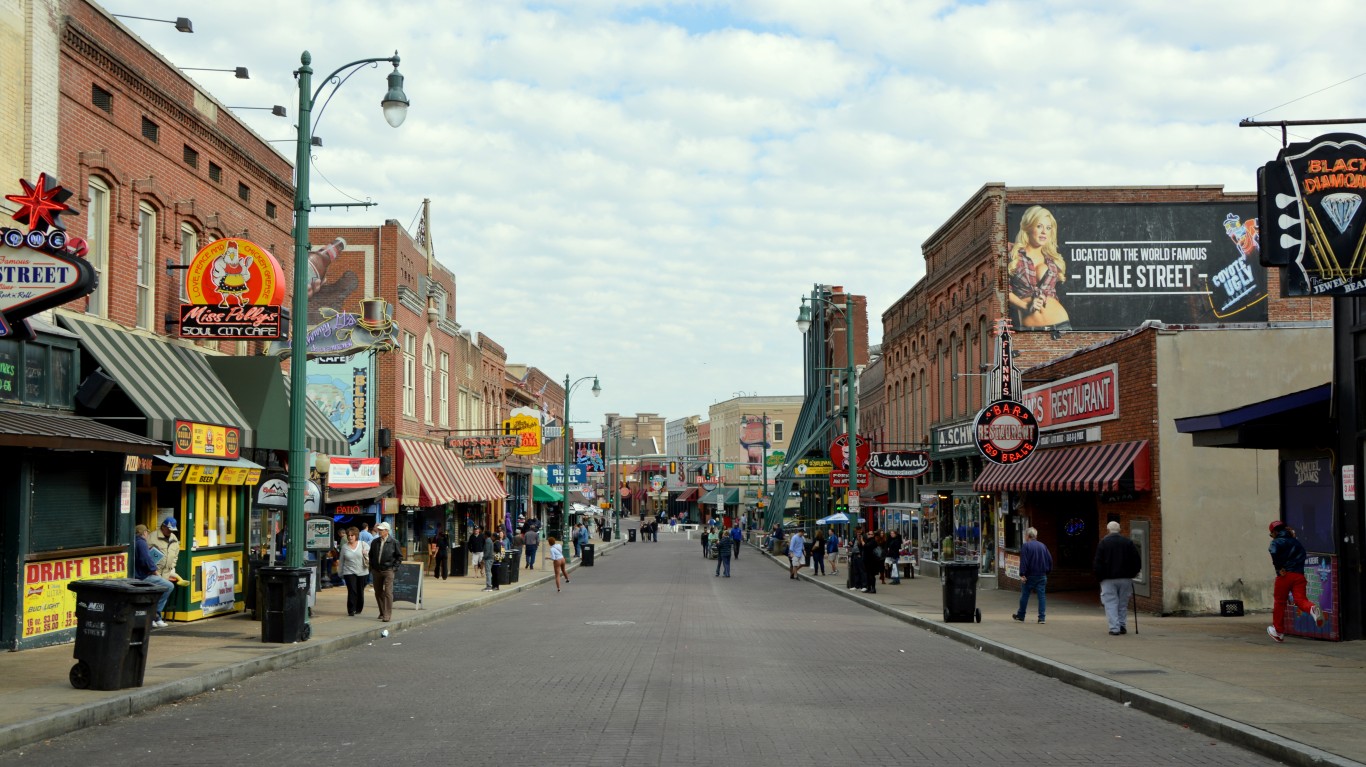
22. Memphis, Tennessee
> Avg time between collisions: 9.1 years
> Likelihood of collision compared to US avg: +16.9% — #96 out of 194 cities
> Motor vehicle fatalities per 100k: 17.6 — #10 out of 194 cities
> Population: 651,088
[in-text-ad-2]

21. Jackson, Mississippi
> Avg time between collisions: 9.7 years
> Likelihood of collision compared to US avg: +8.8% — #125 out of 194 cities
> Motor vehicle fatalities per 100k: 18.9 — #7 out of 194 cities
> Population: 160,532
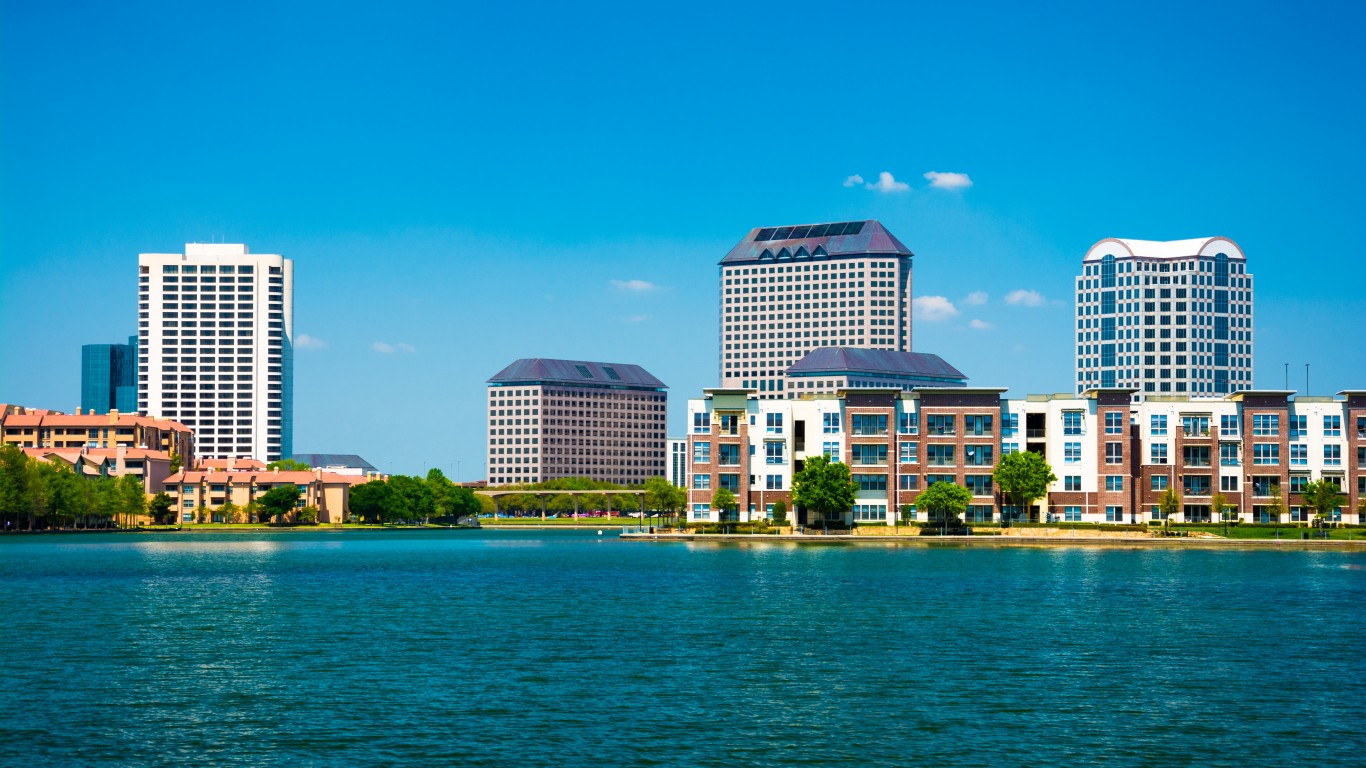
20. Irving, Texas
> Avg time between collisions: 7.0 years
> Likelihood of collision compared to US avg: +50.8% — #20 out of 194 cities
> Motor vehicle fatalities per 100k: 6.4 — #124 out of 194 cities
> Population: 239,779
[in-text-ad]
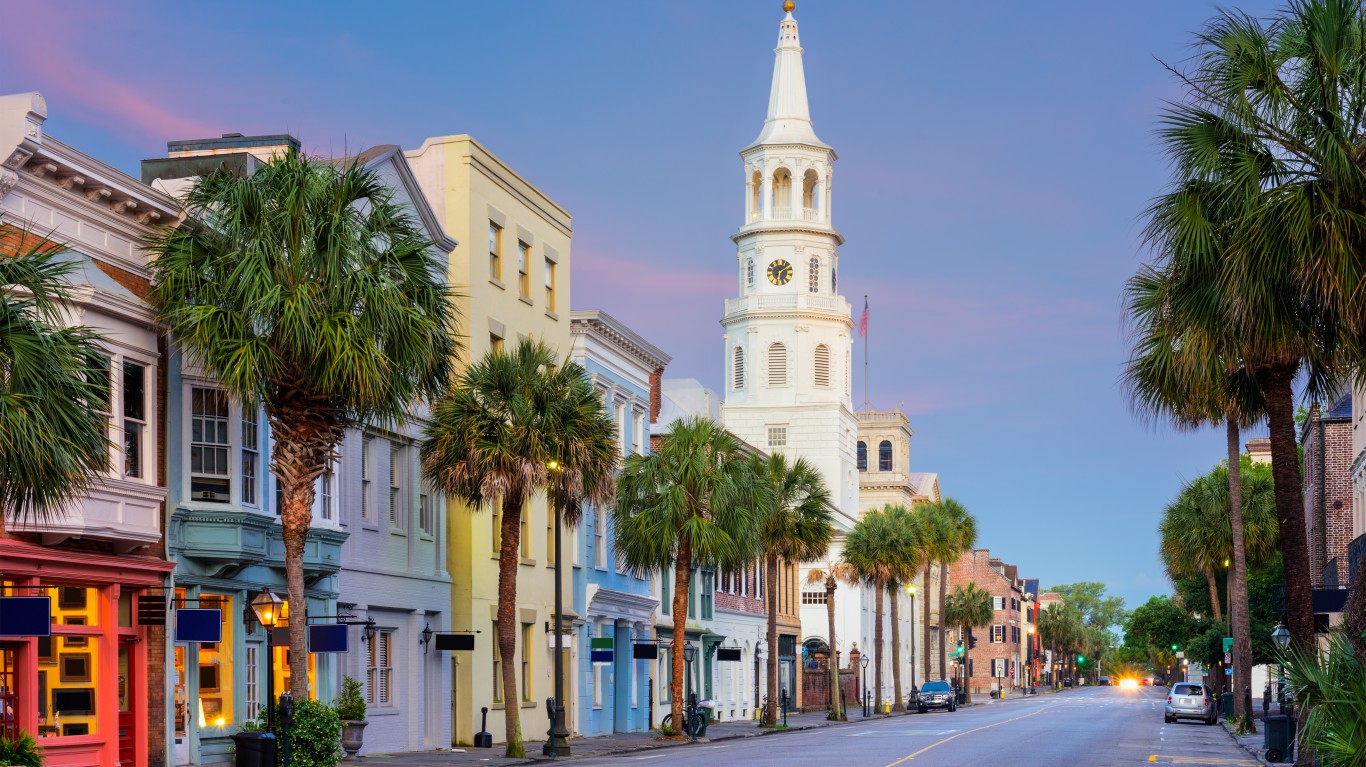
19. Charleston, South Carolina
> Avg time between collisions: 9.4 years
> Likelihood of collision compared to US avg: +12.7% — #115 out of 194 cities
> Motor vehicle fatalities per 100k: 21.7 — #2 out of 194 cities
> Population: 143,151

18. Modesto, California
> Avg time between collisions: 7.9 years
> Likelihood of collision compared to US avg: +34.3% — #46 out of 194 cities
> Motor vehicle fatalities per 100k: 9.2 — #69 out of 194 cities
> Population: 215,196
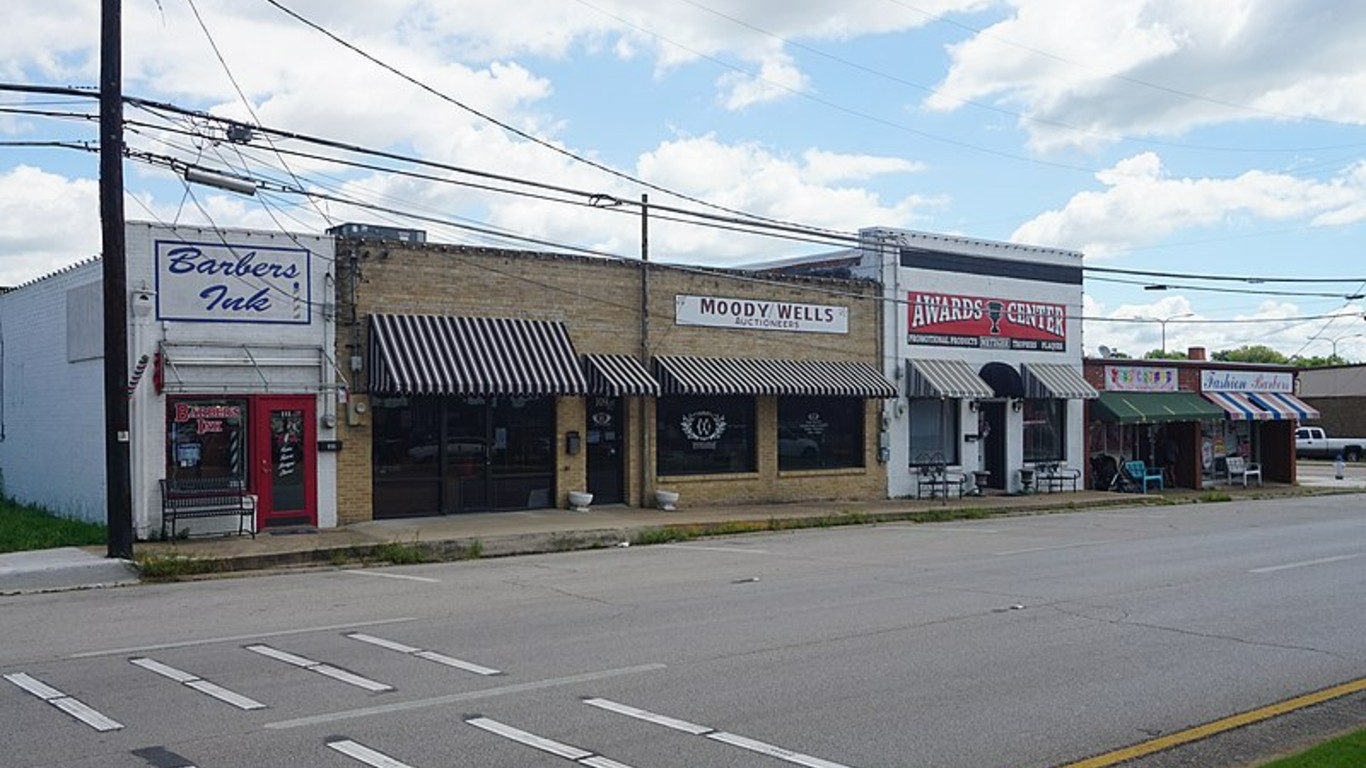
17. Mesquite, Texas
> Avg time between collisions: 7.6 years
> Likelihood of collision compared to US avg: +38.4% — #40 out of 194 cities
> Motor vehicle fatalities per 100k: 8.7 — #76 out of 194 cities
> Population: 140,795
[in-text-ad-2]

16. Arlington, Texas
> Avg time between collisions: 7.6 years
> Likelihood of collision compared to US avg: +40.0% — #36 out of 194 cities
> Motor vehicle fatalities per 100k: 6.9 — #110 out of 194 cities
> Population: 398,860

15. Sacramento, California
> Avg time between collisions: 7.6 years
> Likelihood of collision compared to US avg: +40.0% — #36 out of 194 cities
> Motor vehicle fatalities per 100k: 11.2 — #48 out of 194 cities
> Population: 513,620
[in-text-ad]

14. St. Louis, Missouri
> Avg time between collisions: 8.6 years
> Likelihood of collision compared to US avg: +22.4% — #81 out of 194 cities
> Motor vehicle fatalities per 100k: 18.3 — #8 out of 194 cities
> Population: 300,576
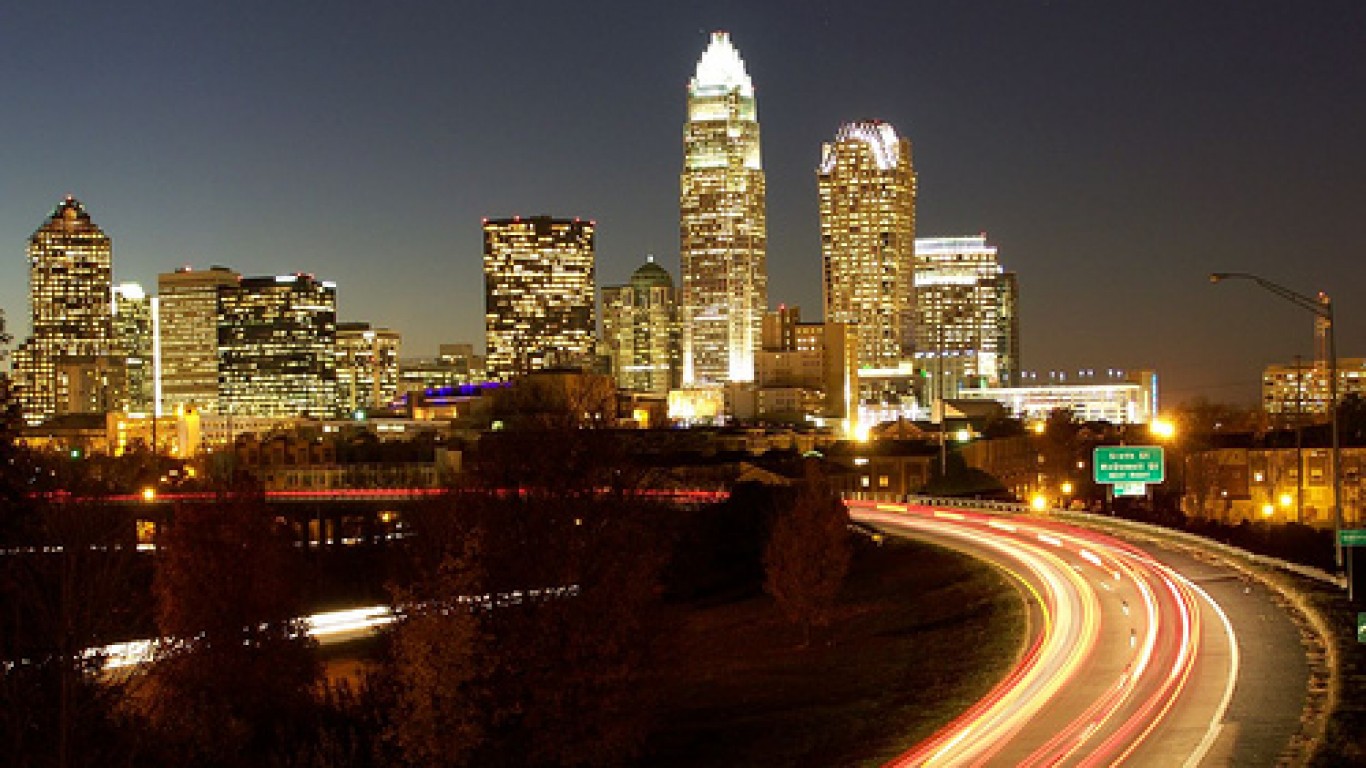
13. Charlotte, North Carolina
> Avg time between collisions: 7.8 years
> Likelihood of collision compared to US avg: +36.0% — #45 out of 194 cities
> Motor vehicle fatalities per 100k: 10.4 — #58 out of 194 cities
> Population: 885,707
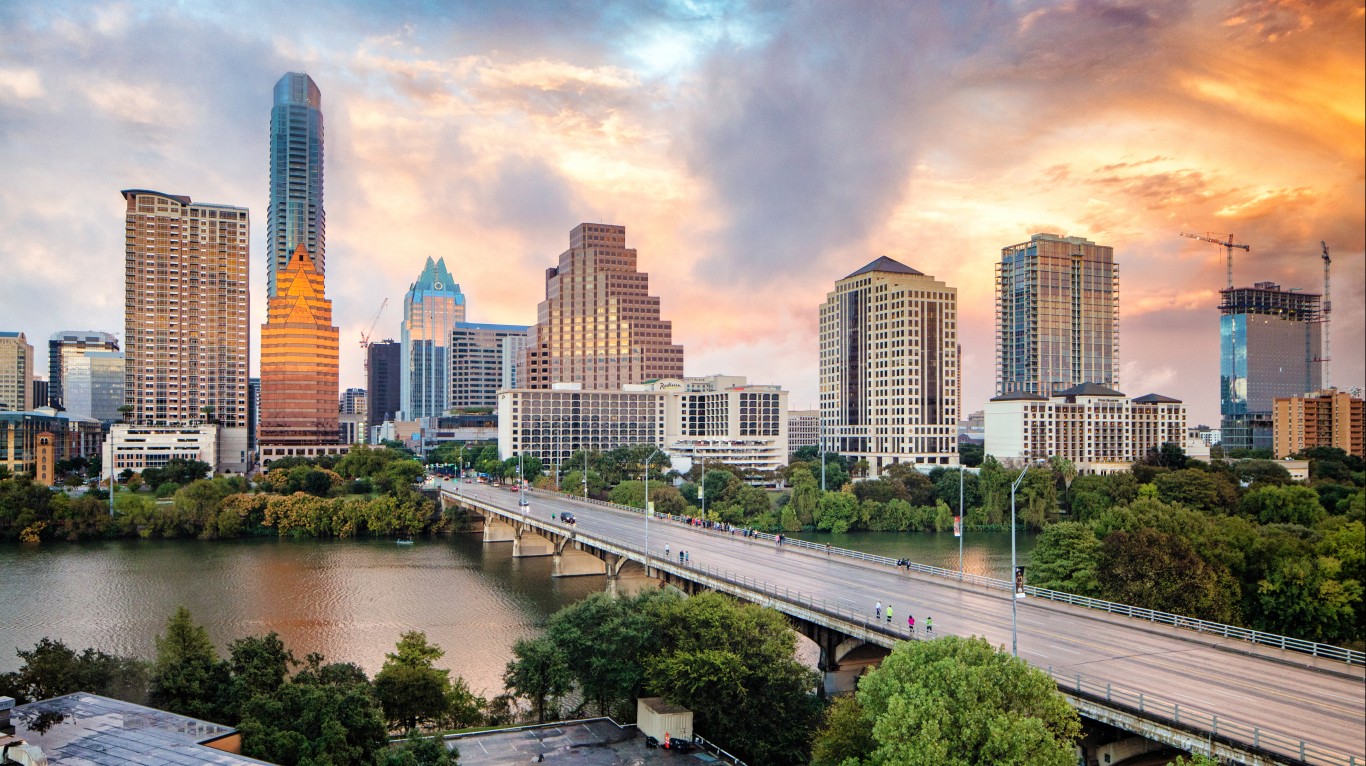
12. Austin, Texas
> Avg time between collisions: 7.6 years
> Likelihood of collision compared to US avg: +39.2% — #38 out of 194 cities
> Motor vehicle fatalities per 100k: 8.4 — #79 out of 194 cities
> Population: 979,263
[in-text-ad-2]
11. San Antonio, Texas
> Avg time between collisions: 8.2 years
> Likelihood of collision compared to US avg: +29.0% — #59 out of 194 cities
> Motor vehicle fatalities per 100k: 9.7 — #67 out of 194 cities
> Population: 1,547,250

10. Cleveland, Ohio
> Avg time between collisions: 8.9 years
> Likelihood of collision compared to US avg: +19.0% — #89 out of 194 cities
> Motor vehicle fatalities per 100k: 12.3 — #33 out of 194 cities
> Population: 380,989
[in-text-ad]

9. Cincinnati, Ohio
> Avg time between collisions: 7.2 years
> Likelihood of collision compared to US avg: +47.6% — #27 out of 194 cities
> Motor vehicle fatalities per 100k: 8.7 — #76 out of 194 cities
> Population: 303,954

8. Houston, Texas
> Avg time between collisions: 7.7 years
> Likelihood of collision compared to US avg: +38.1% — #41 out of 194 cities
> Motor vehicle fatalities per 100k: 10.1 — #63 out of 194 cities
> Population: 2,316,797

7. Detroit, Michigan
> Avg time between collisions: 8.6 years
> Likelihood of collision compared to US avg: +22.9% — #79 out of 194 cities
> Motor vehicle fatalities per 100k: 16.1 — #16 out of 194 cities
> Population: 670,052
[in-text-ad-2]
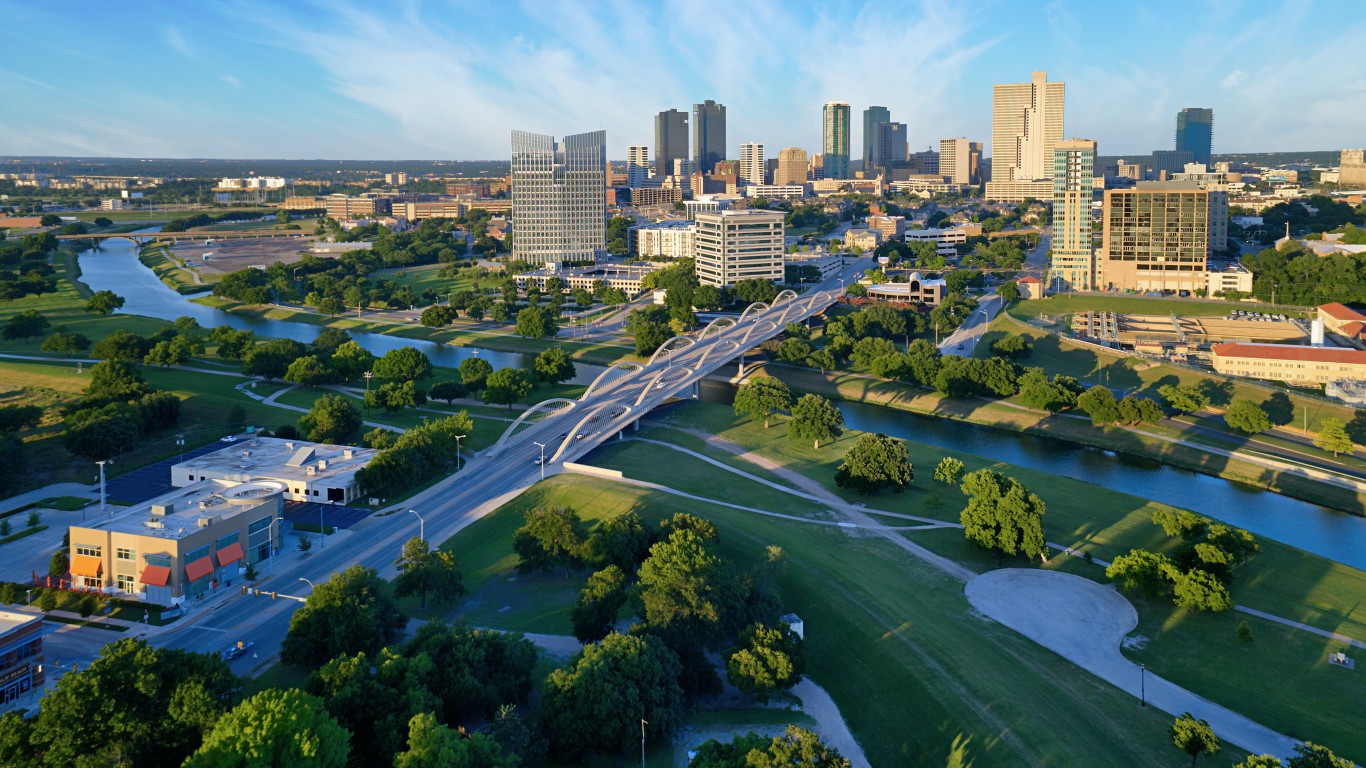
6. Fort Worth, Texas
> Avg time between collisions: 8.2 years
> Likelihood of collision compared to US avg: +29.7% — #58 out of 194 cities
> Motor vehicle fatalities per 100k: 11.5 — #45 out of 194 cities
> Population: 913,656
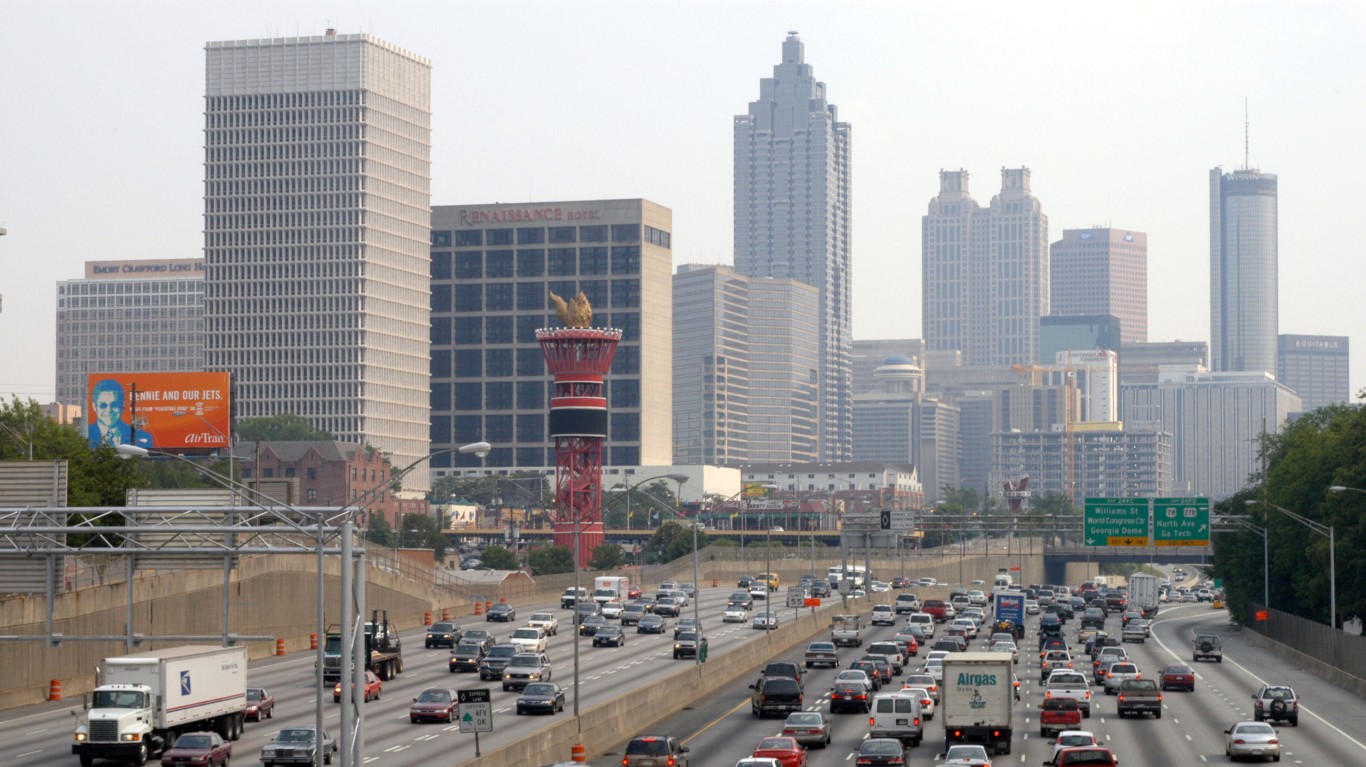
5. Atlanta, Georgia
> Avg time between collisions: 7.1 years
> Likelihood of collision compared to US avg: +49.5% — #21 out of 194 cities
> Motor vehicle fatalities per 100k: 13.5 — #26 out of 194 cities
> Population: 506,804
[in-text-ad]

4. New Orleans, Louisiana
> Avg time between collisions: 7.1 years
> Likelihood of collision compared to US avg: +49.1% — #23 out of 194 cities
> Motor vehicle fatalities per 100k: 11.1 — #49 out of 194 cities
> Population: 390,144
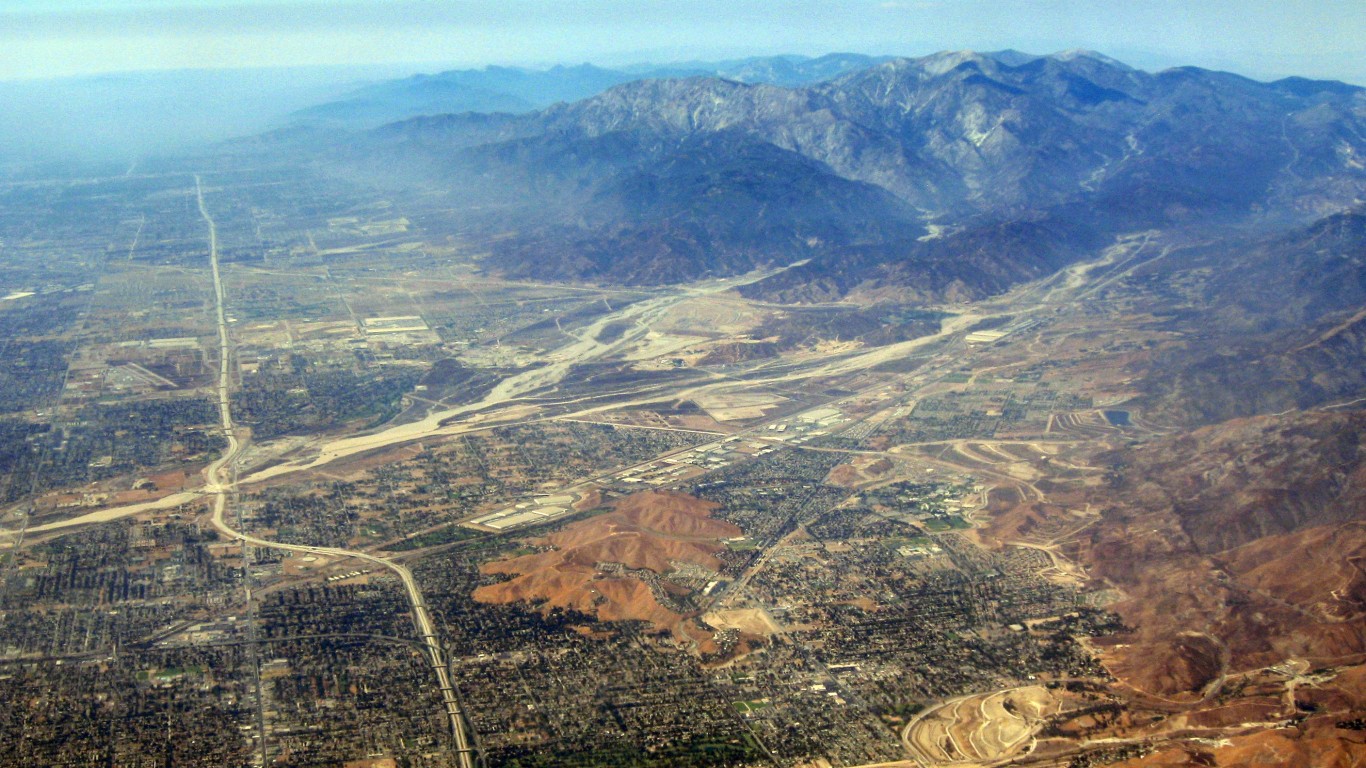
3. San Bernardino, California
> Avg time between collisions: 7.5 years
> Likelihood of collision compared to US avg: +41.8% — #33 out of 194 cities
> Motor vehicle fatalities per 100k: 17.9 — #9 out of 194 cities
> Population: 215,780
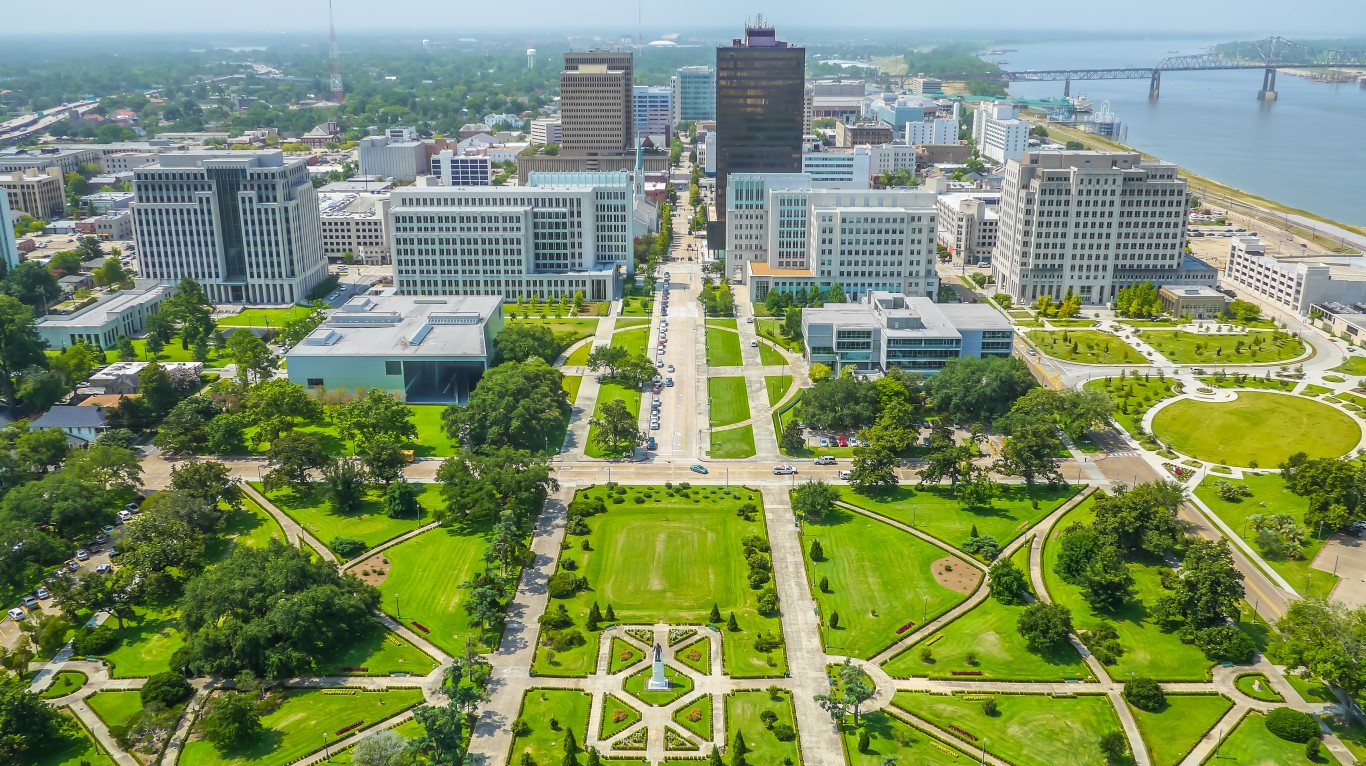
2. Baton Rouge, Louisiana
> Avg time between collisions: 6.8 years
> Likelihood of collision compared to US avg: +55.1% — #13 out of 194 cities
> Motor vehicle fatalities per 100k: 21.9 — #1 out of 194 cities
> Population: 220,248
[in-text-ad-2]

1. Dallas, Texas
> Avg time between collisions: 7.2 years
> Likelihood of collision compared to US avg: +46.5% — #28 out of 194 cities
> Motor vehicle fatalities per 100k: 14.3 — #21 out of 194 cities
> Population: 1,343,565
Is Your Money Earning the Best Possible Rate? (Sponsor)
Let’s face it: If your money is just sitting in a checking account, you’re losing value every single day. With most checking accounts offering little to no interest, the cash you worked so hard to save is gradually being eroded by inflation.
However, by moving that money into a high-yield savings account, you can put your cash to work, growing steadily with little to no effort on your part. In just a few clicks, you can set up a high-yield savings account and start earning interest immediately.
There are plenty of reputable banks and online platforms that offer competitive rates, and many of them come with zero fees and no minimum balance requirements. Click here to see if you’re earning the best possible rate on your money!
Thank you for reading! Have some feedback for us?
Contact the 24/7 Wall St. editorial team.
 24/7 Wall St.
 24/7 Wall St.
 24/7 Wall St.