
The U.S. reported over 17,000 new cases of coronavirus on May 18, bringing the total count to more than 32.6 million confirmed cases of COVID-19. There have been more than 580,000 COVID-19-related deaths — the highest death toll of any country.
New cases continue to rise at a steady rate. In the past week, there were an average of 13.2 daily new coronavirus cases per 100,000 Americans — essentially unchanged from the week prior, when there were an average of 14.9 daily new coronavirus cases per 100,000 people.
While new data shows that the risk of contracting COVID-19 is high in almost every part of the country, cities continue to be the sites of major outbreaks and superspreader events. Experts agree that the virus is more likely to spread in group settings where large numbers of people routinely have close contact with one another, such as colleges, nursing homes, bars, and restaurants. Metropolitan areas with a high degree of connectivity between different neighborhoods and a large population may be particularly at-risk.
The metro areas with the lowest incidence of COVID-19 cases are distributed relatively unevenly across the United States. Of the 50 metro areas with the lowest case counts per capita, 28 are in the West, 11 are in the Northeast, 10 are in the South, and one are in the Midwest.
The five metro areas with the smallest number of coronavirus cases per capita are: Urban Honolulu, HI; Kahului-Wailuku-Lahaina, HI; Bremerton-Silverdale-Port Orchard, WA; Corvallis, OR; and Olympia-Lacey-Tumwater, WA. The incidence of COVID-19 in these metro areas range from 2,693.8 cases per 100,000 to 3,444.3 cases per 100,000. For comparison, there are currently 10,103.1 cases per 100,000 Americans nationwide.
The 50 cities with the lowest incidence of COVID-19 have more than 4,000 fewer coronavirus cases per capita than the U.S. as a whole, but cases are still growing at a steady pace. There were an average of 12.6 daily new coronavirus cases per 100,000 people in the week ending May 18, roughly unchanged from the week prior, when there were an average of 14.8 daily new coronavirus cases per 100,000 people. In 46 of the 50 cities with the lowest COVID-19 incidence, new cases are rising at a slowing rate.
To determine the cities with the fewest COVID-19 cases, 24/7 Wall St. compiled and reviewed data from state and local health departments. We ranked metro areas based on the number of confirmed COVID-19 cases per 100,000 residents as of May 18.To estimate the incidence of COVID-19 at the metropolitan level, we aggregated data from the county level using boundary definitions from the U.S. Census Bureau. Population data used to adjust case and death totals came from the U.S. Census Bureau’s 2019 American Community Survey and are five-year estimates. Unemployment data is from the Bureau of Labor Statistics and is seasonally adjusted.
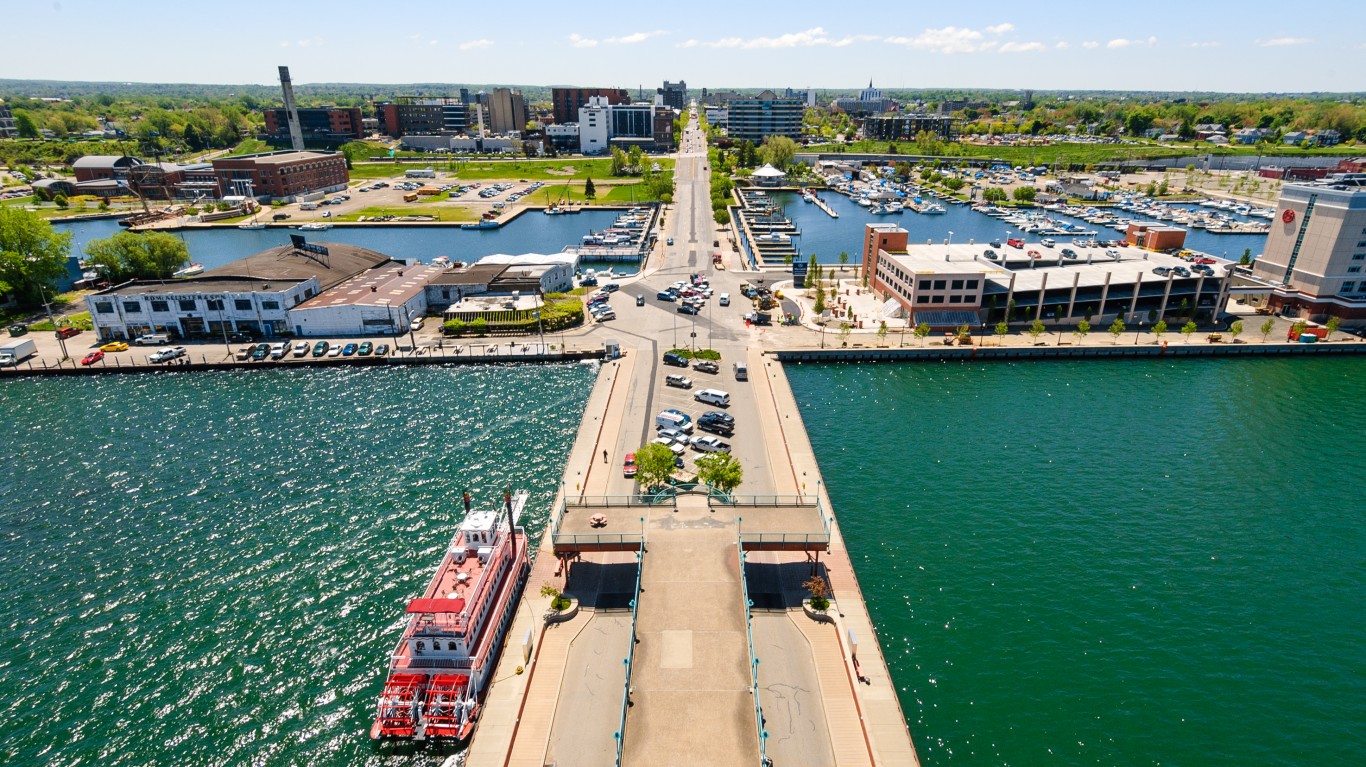
50. Erie, PA
> Confirmed COVID-19 cases as of May 18: 20,711
> Confirmed COVID-19 cases as of May 18 per 100,000 residents: 7,563.3
> Cumulative COVID-19 deaths as of May 18: 408
> Cumulative COVID-19 deaths as of May 18 per 100,000 residents: 149.0
> Population: 273,835

49. San Luis Obispo-Paso Robles, CA
> Confirmed COVID-19 cases as of May 18: 21,331
> Confirmed COVID-19 cases as of May 18 per 100,000 residents: 7,559.8
> Cumulative COVID-19 deaths as of May 18: 260
> Cumulative COVID-19 deaths as of May 18 per 100,000 residents: 92.1
> Population: 282,165
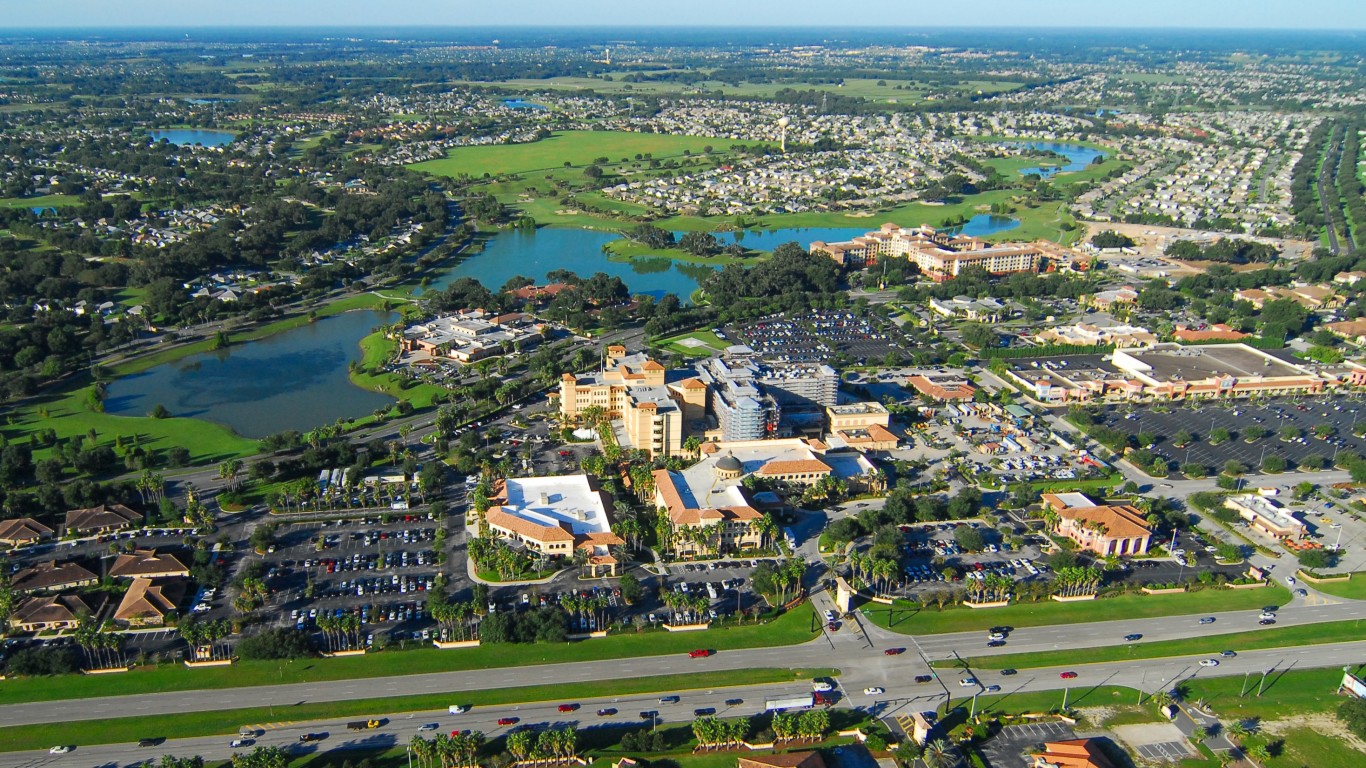
48. The Villages, FL
> Confirmed COVID-19 cases as of May 18: 9,386
> Confirmed COVID-19 cases as of May 18 per 100,000 residents: 7,506.2
> Cumulative COVID-19 deaths as of May 18: 278
> Cumulative COVID-19 deaths as of May 18 per 100,000 residents: 222.3
> Population: 125,044

47. Washington-Arlington-Alexandria, DC-VA-MD-WV
> Confirmed COVID-19 cases as of May 18: 463,544
> Confirmed COVID-19 cases as of May 18 per 100,000 residents: 7,480.6
> Cumulative COVID-19 deaths as of May 18: 7,565
> Cumulative COVID-19 deaths as of May 18 per 100,000 residents: 122.1
> Population: 6,196,585
Click here to see all current COVID-19 data for Washington D.C.

46. Vallejo, CA
> Confirmed COVID-19 cases as of May 18: 32,974
> Confirmed COVID-19 cases as of May 18 per 100,000 residents: 7,463.1
> Cumulative COVID-19 deaths as of May 18: 253
> Cumulative COVID-19 deaths as of May 18 per 100,000 residents: 57.3
> Population: 441,829
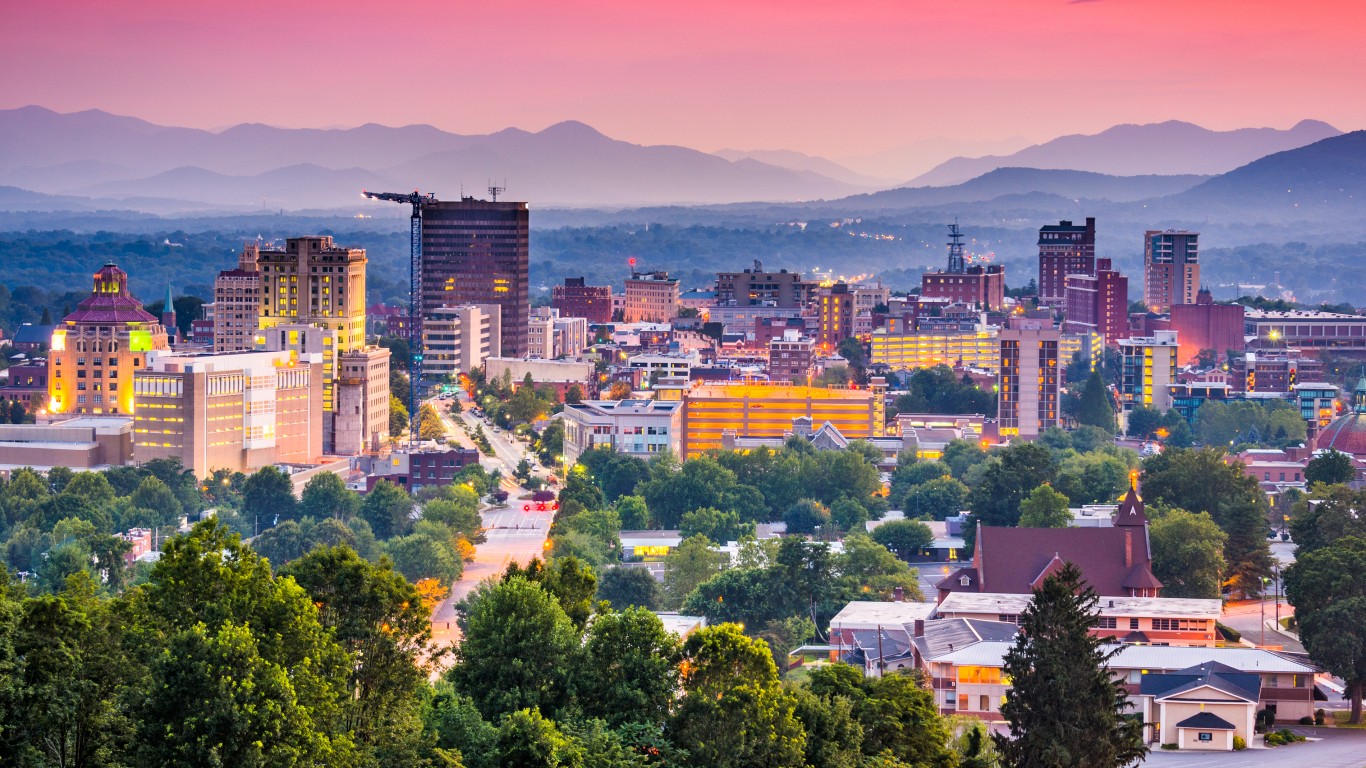
45. Asheville, NC
> Confirmed COVID-19 cases as of May 18: 33,900
> Confirmed COVID-19 cases as of May 18 per 100,000 residents: 7,461.2
> Cumulative COVID-19 deaths as of May 18: 612
> Cumulative COVID-19 deaths as of May 18 per 100,000 residents: 134.7
> Population: 454,351

44. Baltimore-Columbia-Towson, MD
> Confirmed COVID-19 cases as of May 18: 208,579
> Confirmed COVID-19 cases as of May 18 per 100,000 residents: 7,458.0
> Cumulative COVID-19 deaths as of May 18: 3,996
> Cumulative COVID-19 deaths as of May 18 per 100,000 residents: 142.9
> Population: 2,796,733
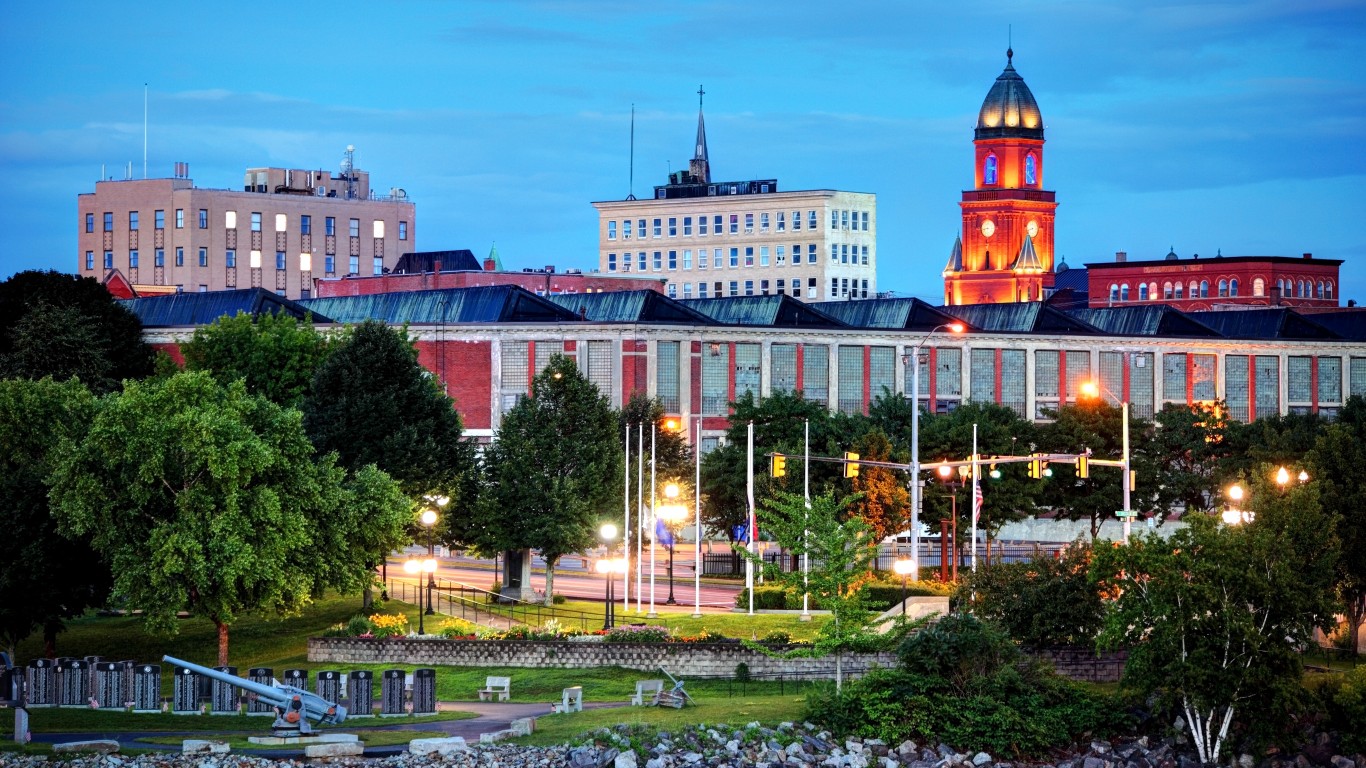
43. Lewiston-Auburn, ME
> Confirmed COVID-19 cases as of May 18: 8,000
> Confirmed COVID-19 cases as of May 18 per 100,000 residents: 7,434.8
> Cumulative COVID-19 deaths as of May 18: 72
> Cumulative COVID-19 deaths as of May 18 per 100,000 residents: 66.9
> Population: 107,602
These are all the counties in Maine where COVID-19 is slowing (and where it’s still getting worse).

42. Albany-Schenectady-Troy, NY
> Confirmed COVID-19 cases as of May 18: 65,344
> Confirmed COVID-19 cases as of May 18 per 100,000 residents: 7,419.2
> Cumulative COVID-19 deaths as of May 18: 873
> Cumulative COVID-19 deaths as of May 18 per 100,000 residents: 99.1
> Population: 880,736

41. Boulder, CO
> Confirmed COVID-19 cases as of May 18: 23,396
> Confirmed COVID-19 cases as of May 18 per 100,000 residents: 7,254.3
> Cumulative COVID-19 deaths as of May 18: 235
> Cumulative COVID-19 deaths as of May 18 per 100,000 residents: 72.9
> Population: 322,510
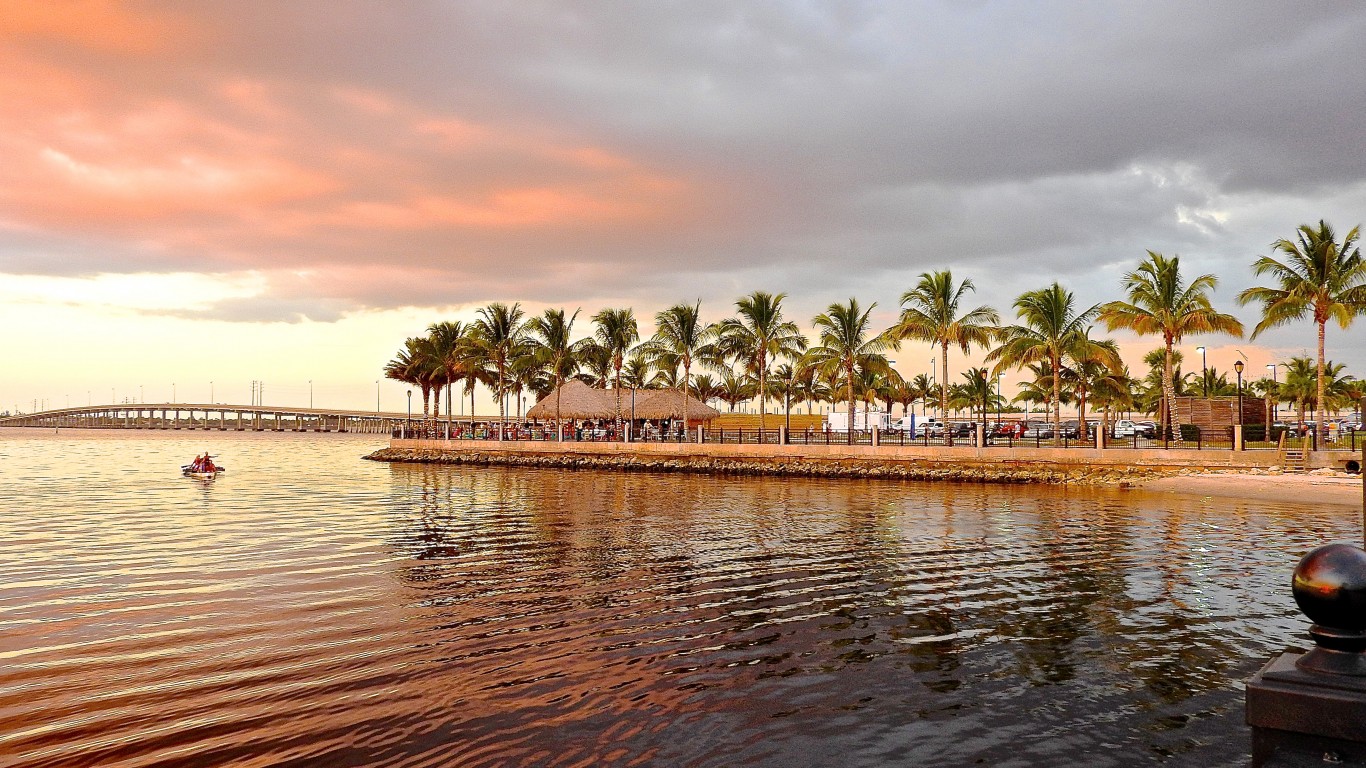
40. Punta Gorda, FL
> Confirmed COVID-19 cases as of May 18: 13,131
> Confirmed COVID-19 cases as of May 18 per 100,000 residents: 7,252.0
> Cumulative COVID-19 deaths as of May 18: N/A
> Cumulative COVID-19 deaths as of May 18 per 100,000 residents: N/A
> Population: 181,067

39. Palm Bay-Melbourne-Titusville, FL
> Confirmed COVID-19 cases as of May 18: 42,237
> Confirmed COVID-19 cases as of May 18 per 100,000 residents: 7,213.7
> Cumulative COVID-19 deaths as of May 18: 881
> Cumulative COVID-19 deaths as of May 18 per 100,000 residents: 150.5
> Population: 585,507

38. Killeen-Temple, TX
> Confirmed COVID-19 cases as of May 18: 32,029
> Confirmed COVID-19 cases as of May 18 per 100,000 residents: 7,202.1
> Cumulative COVID-19 deaths as of May 18: 541
> Cumulative COVID-19 deaths as of May 18 per 100,000 residents: 121.7
> Population: 444,716
These are all the counties in Texas where COVID-19 is slowing (and where it’s still getting worse).
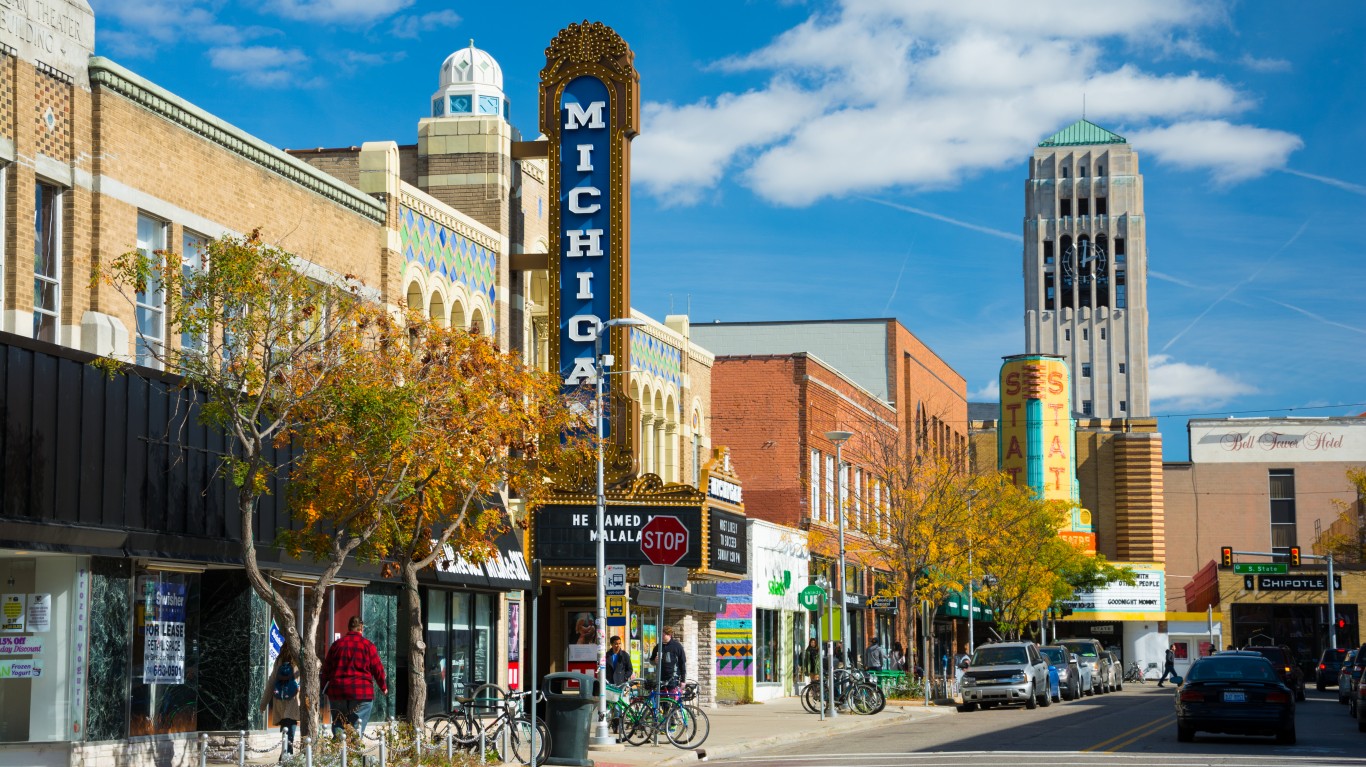
37. Ann Arbor, MI
> Confirmed COVID-19 cases as of May 18: 26,101
> Confirmed COVID-19 cases as of May 18 per 100,000 residents: 7,112.0
> Cumulative COVID-19 deaths as of May 18: 284
> Cumulative COVID-19 deaths as of May 18 per 100,000 residents: 77.4
> Population: 367,000

36. Napa, CA
> Confirmed COVID-19 cases as of May 18: 9,887
> Confirmed COVID-19 cases as of May 18 per 100,000 residents: 7,081.2
> Cumulative COVID-19 deaths as of May 18: 82
> Cumulative COVID-19 deaths as of May 18 per 100,000 residents: 58.7
> Population: 139,623

35. Santa Fe, NM
> Confirmed COVID-19 cases as of May 18: 10,285
> Confirmed COVID-19 cases as of May 18 per 100,000 residents: 6,889.1
> Cumulative COVID-19 deaths as of May 18: 145
> Cumulative COVID-19 deaths as of May 18 per 100,000 residents: 97.1
> Population: 149,293

34. Redding, CA
> Confirmed COVID-19 cases as of May 18: 12,175
> Confirmed COVID-19 cases as of May 18 per 100,000 residents: 6,793.6
> Cumulative COVID-19 deaths as of May 18: 226
> Cumulative COVID-19 deaths as of May 18 per 100,000 residents: 126.1
> Population: 179,212

33. Sacramento-Roseville-Folsom, CA
> Confirmed COVID-19 cases as of May 18: 151,771
> Confirmed COVID-19 cases as of May 18 per 100,000 residents: 6,553.2
> Cumulative COVID-19 deaths as of May 18: 2,307
> Cumulative COVID-19 deaths as of May 18 per 100,000 residents: 99.6
> Population: 2,315,980
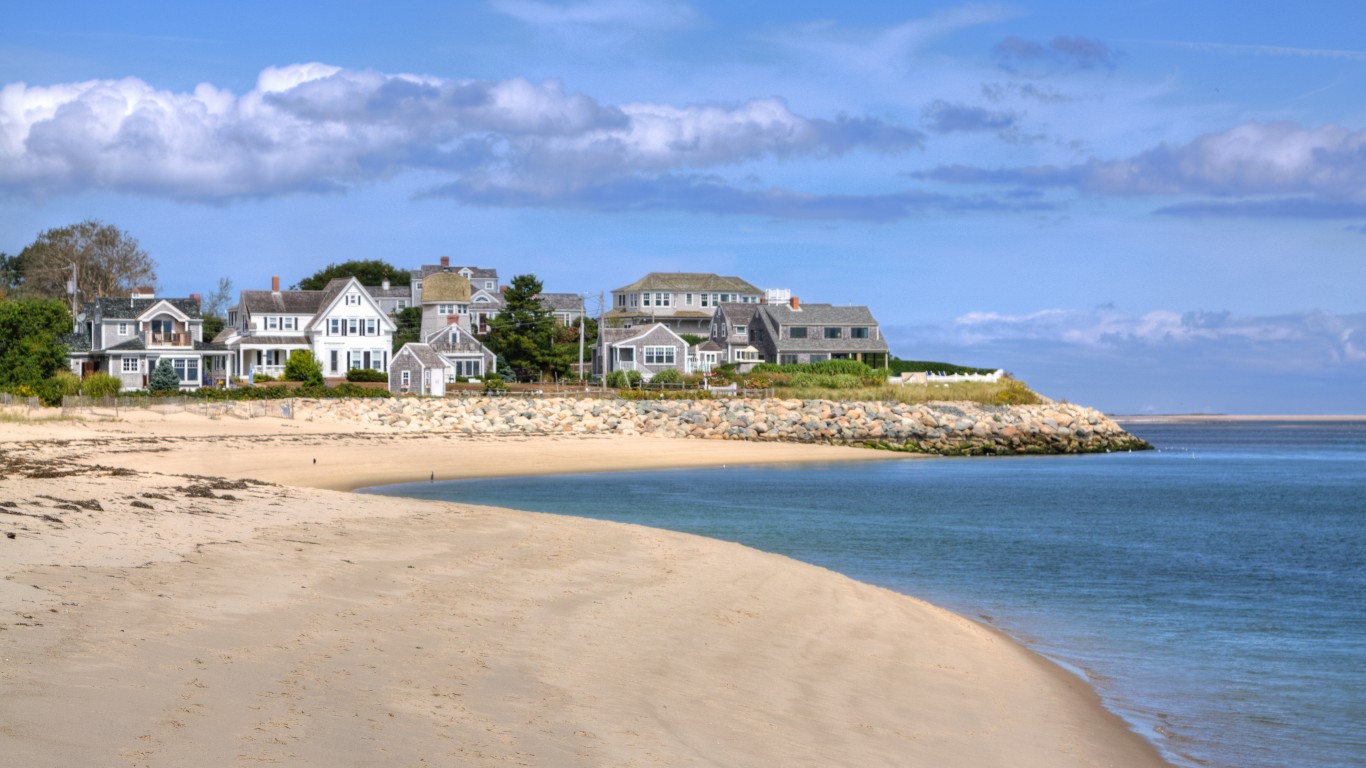
32. Barnstable Town, MA
> Confirmed COVID-19 cases as of May 18: 13,784
> Confirmed COVID-19 cases as of May 18 per 100,000 residents: 6,456.3
> Cumulative COVID-19 deaths as of May 18: 465
> Cumulative COVID-19 deaths as of May 18 per 100,000 residents: 217.8
> Population: 213,496
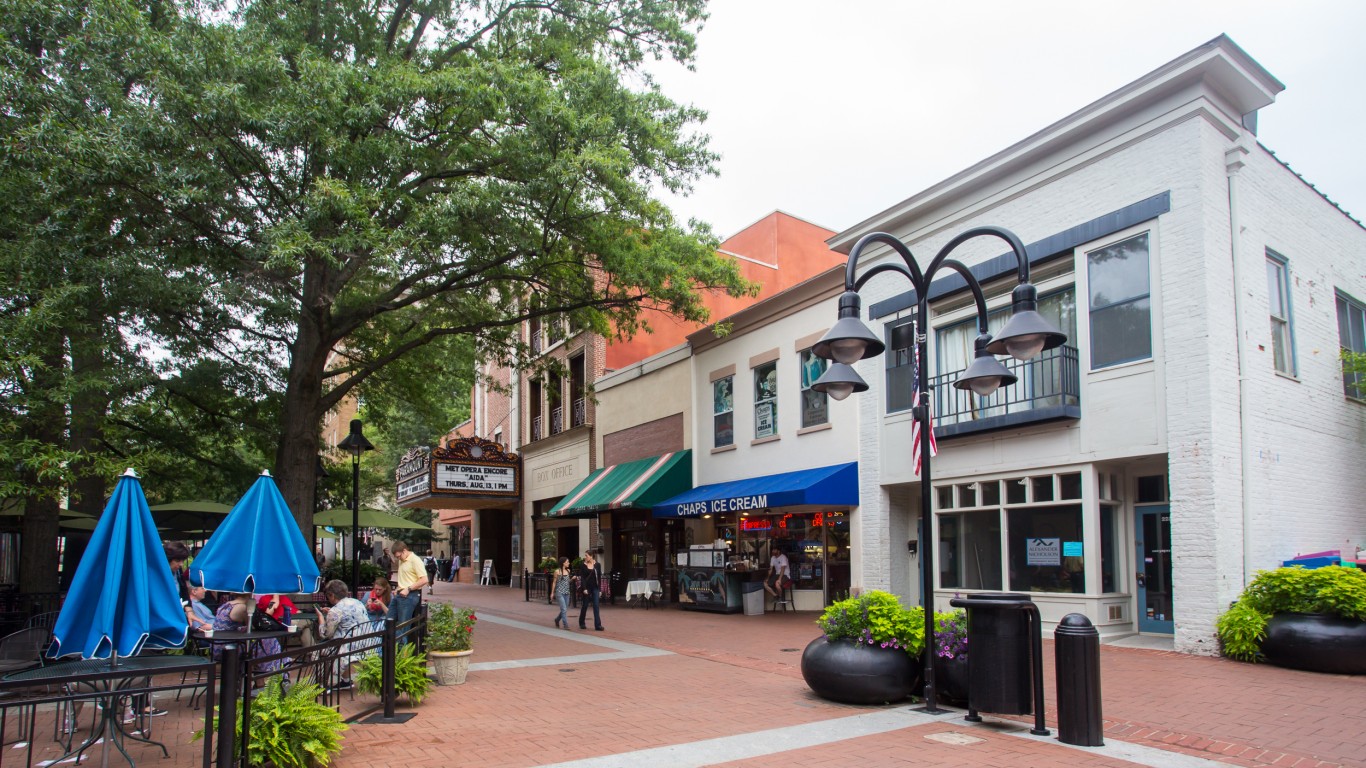
31. Charlottesville, VA
> Confirmed COVID-19 cases as of May 18: 13,881
> Confirmed COVID-19 cases as of May 18 per 100,000 residents: 6,442.9
> Cumulative COVID-19 deaths as of May 18: 188
> Cumulative COVID-19 deaths as of May 18 per 100,000 residents: 87.3
> Population: 215,445

30. San Jose-Sunnyvale-Santa Clara, CA
> Confirmed COVID-19 cases as of May 18: 125,132
> Confirmed COVID-19 cases as of May 18 per 100,000 residents: 6,294.9
> Cumulative COVID-19 deaths as of May 18: 2,159
> Cumulative COVID-19 deaths as of May 18 per 100,000 residents: 108.6
> Population: 1,987,846

29. Salem, OR
> Confirmed COVID-19 cases as of May 18: 26,017
> Confirmed COVID-19 cases as of May 18 per 100,000 residents: 6,155.3
> Cumulative COVID-19 deaths as of May 18: 361
> Cumulative COVID-19 deaths as of May 18 per 100,000 residents: 85.4
> Population: 422,678
These are all the counties in Oregon where COVID-19 is slowing (and where it’s still getting worse).

28. Hinesville, GA
> Confirmed COVID-19 cases as of May 18: 4,896
> Confirmed COVID-19 cases as of May 18 per 100,000 residents: 6,116.9
> Cumulative COVID-19 deaths as of May 18: 76
> Cumulative COVID-19 deaths as of May 18 per 100,000 residents: 95.0
> Population: 80,041

27. Santa Rosa-Petaluma, CA
> Confirmed COVID-19 cases as of May 18: 30,067
> Confirmed COVID-19 cases as of May 18 per 100,000 residents: 6,016.1
> Cumulative COVID-19 deaths as of May 18: 321
> Cumulative COVID-19 deaths as of May 18 per 100,000 residents: 64.2
> Population: 499,772

26. Santa Cruz-Watsonville, CA
> Confirmed COVID-19 cases as of May 18: 16,264
> Confirmed COVID-19 cases as of May 18 per 100,000 residents: 5,936.6
> Cumulative COVID-19 deaths as of May 18: 208
> Cumulative COVID-19 deaths as of May 18 per 100,000 residents: 75.9
> Population: 273,962
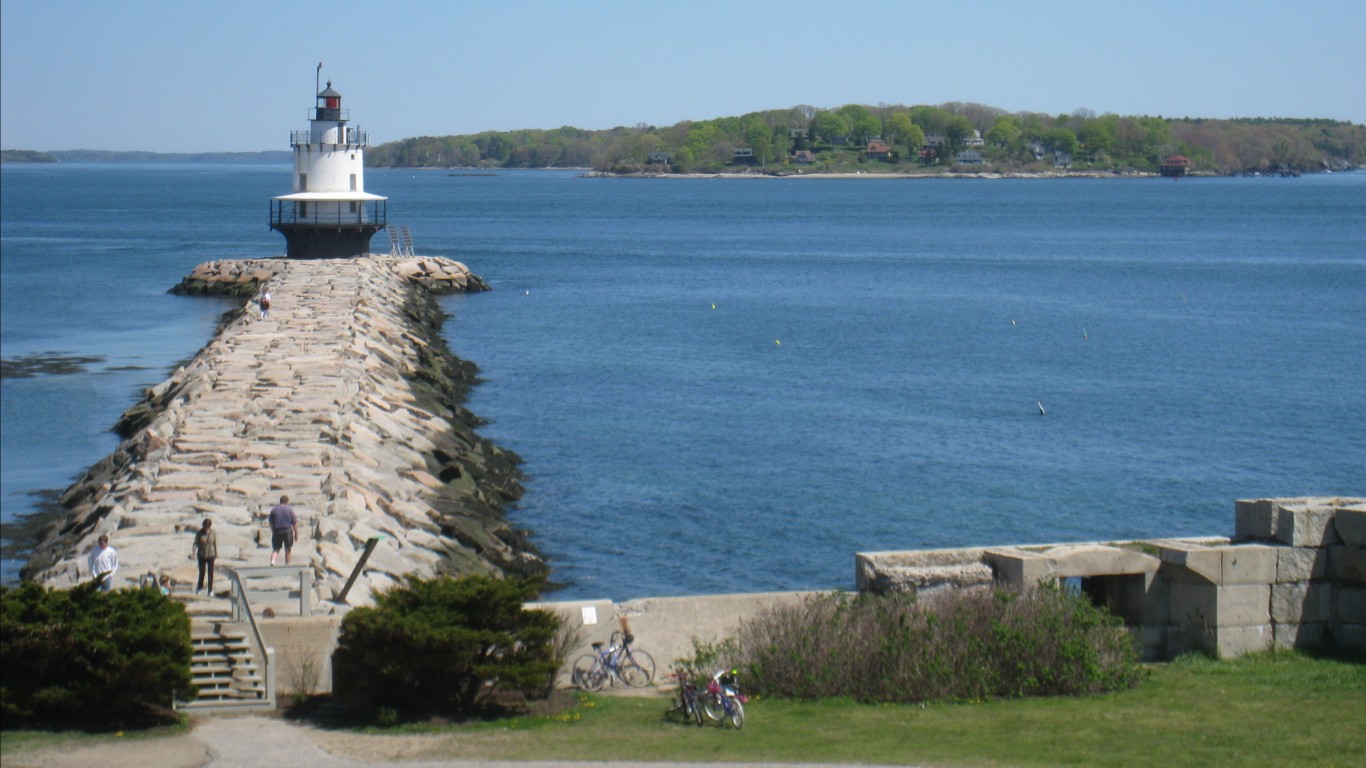
25. Portland-South Portland, ME
> Confirmed COVID-19 cases as of May 18: 31,404
> Confirmed COVID-19 cases as of May 18 per 100,000 residents: 5,902.2
> Cumulative COVID-19 deaths as of May 18: 333
> Cumulative COVID-19 deaths as of May 18 per 100,000 residents: 62.6
> Population: 532,075
These are all the counties in Maine where COVID-19 is slowing (and where it’s still getting worse).

24. Longview, WA
> Confirmed COVID-19 cases as of May 18: 5,945
> Confirmed COVID-19 cases as of May 18 per 100,000 residents: 5,567.6
> Cumulative COVID-19 deaths as of May 18: 90
> Cumulative COVID-19 deaths as of May 18 per 100,000 residents: 84.3
> Population: 106,778
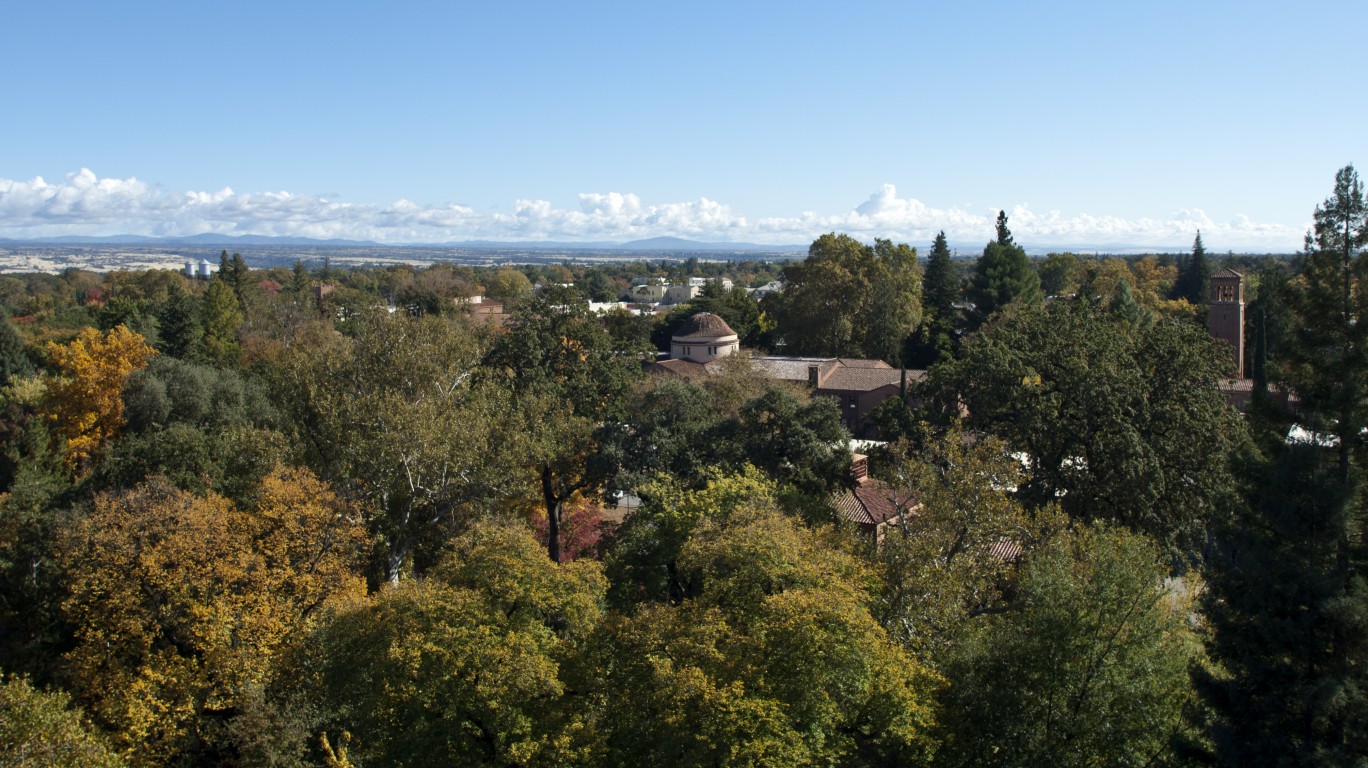
23. Chico, CA
> Confirmed COVID-19 cases as of May 18: 12,095
> Confirmed COVID-19 cases as of May 18 per 100,000 residents: 5,356.1
> Cumulative COVID-19 deaths as of May 18: 192
> Cumulative COVID-19 deaths as of May 18 per 100,000 residents: 85.0
> Population: 225,817

22. San Francisco-Oakland-Berkeley, CA
> Confirmed COVID-19 cases as of May 18: 250,057
> Confirmed COVID-19 cases as of May 18 per 100,000 residents: 5,318.9
> Cumulative COVID-19 deaths as of May 18: 3,817
> Cumulative COVID-19 deaths as of May 18 per 100,000 residents: 81.2
> Population: 4,701,332
_along_the_border_of_Solomons,_Calvert_County,_Maryland_and_California,_St._Mary%27s_County,_Maryland_just_before_sunset.jpg "View northwest up the Patuxent River... by Famartin")
21. California-Lexington Park, MD
> Confirmed COVID-19 cases as of May 18: 5,966
> Confirmed COVID-19 cases as of May 18 per 100,000 residents: 5,313.0
> Cumulative COVID-19 deaths as of May 18: 124
> Cumulative COVID-19 deaths as of May 18 per 100,000 residents: 110.4
> Population: 112,290

20. Glens Falls, NY
> Confirmed COVID-19 cases as of May 18: 6,681
> Confirmed COVID-19 cases as of May 18 per 100,000 residents: 5,306.9
> Cumulative COVID-19 deaths as of May 18: 112
> Cumulative COVID-19 deaths as of May 18 per 100,000 residents: 89.0
> Population: 125,892

19. Watertown-Fort Drum, NY
> Confirmed COVID-19 cases as of May 18: 5,942
> Confirmed COVID-19 cases as of May 18 per 100,000 residents: 5,265.8
> Cumulative COVID-19 deaths as of May 18: 67
> Cumulative COVID-19 deaths as of May 18 per 100,000 residents: 59.4
> Population: 112,842
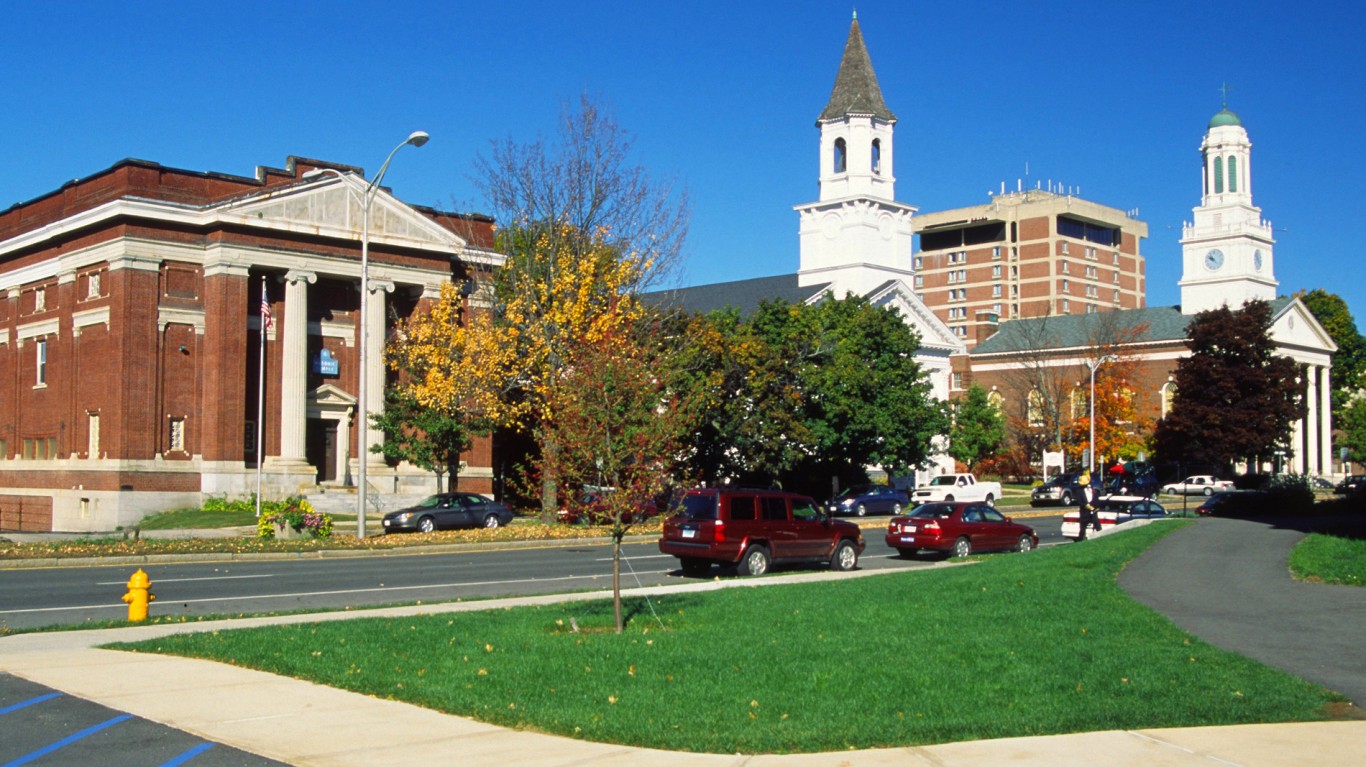
18. Pittsfield, MA
> Confirmed COVID-19 cases as of May 18: 6,485
> Confirmed COVID-19 cases as of May 18 per 100,000 residents: 5,129.5
> Cumulative COVID-19 deaths as of May 18: 285
> Cumulative COVID-19 deaths as of May 18 per 100,000 residents: 225.4
> Population: 126,425

17. Seattle-Tacoma-Bellevue, WA
> Confirmed COVID-19 cases as of May 18: 197,718
> Confirmed COVID-19 cases as of May 18 per 100,000 residents: 5,107.2
> Cumulative COVID-19 deaths as of May 18: 2,783
> Cumulative COVID-19 deaths as of May 18 per 100,000 residents: 71.9
> Population: 3,871,323

16. Medford, OR
> Confirmed COVID-19 cases as of May 18: 10,953
> Confirmed COVID-19 cases as of May 18 per 100,000 residents: 5,057.4
> Cumulative COVID-19 deaths as of May 18: 140
> Cumulative COVID-19 deaths as of May 18 per 100,000 residents: 64.6
> Population: 216,574
These are all the counties in Oregon where COVID-19 is slowing (and where it’s still getting worse).

15. Bend, OR
> Confirmed COVID-19 cases as of May 18: 9,180
> Confirmed COVID-19 cases as of May 18 per 100,000 residents: 4,928.8
> Cumulative COVID-19 deaths as of May 18: 74
> Cumulative COVID-19 deaths as of May 18 per 100,000 residents: 39.7
> Population: 186,251
These are all the counties in Oregon where COVID-19 is slowing (and where it’s still getting worse).

14. Portland-Vancouver-Hillsboro, OR-WA
> Confirmed COVID-19 cases as of May 18: 112,665
> Confirmed COVID-19 cases as of May 18 per 100,000 residents: 4,606.5
> Cumulative COVID-19 deaths as of May 18: 1,406
> Cumulative COVID-19 deaths as of May 18 per 100,000 residents: 57.5
> Population: 2,445,761
These are all the counties in Oregon where COVID-19 is slowing (and where it’s still getting worse).

13. Mount Vernon-Anacortes, WA
> Confirmed COVID-19 cases as of May 18: 5,687
> Confirmed COVID-19 cases as of May 18 per 100,000 residents: 4,527.4
> Cumulative COVID-19 deaths as of May 18: 72
> Cumulative COVID-19 deaths as of May 18 per 100,000 residents: 57.3
> Population: 125,612

12. Burlington-South Burlington, VT
> Confirmed COVID-19 cases as of May 18: 9,678
> Confirmed COVID-19 cases as of May 18 per 100,000 residents: 4,423.5
> Cumulative COVID-19 deaths as of May 18: 143
> Cumulative COVID-19 deaths as of May 18 per 100,000 residents: 65.4
> Population: 218,784
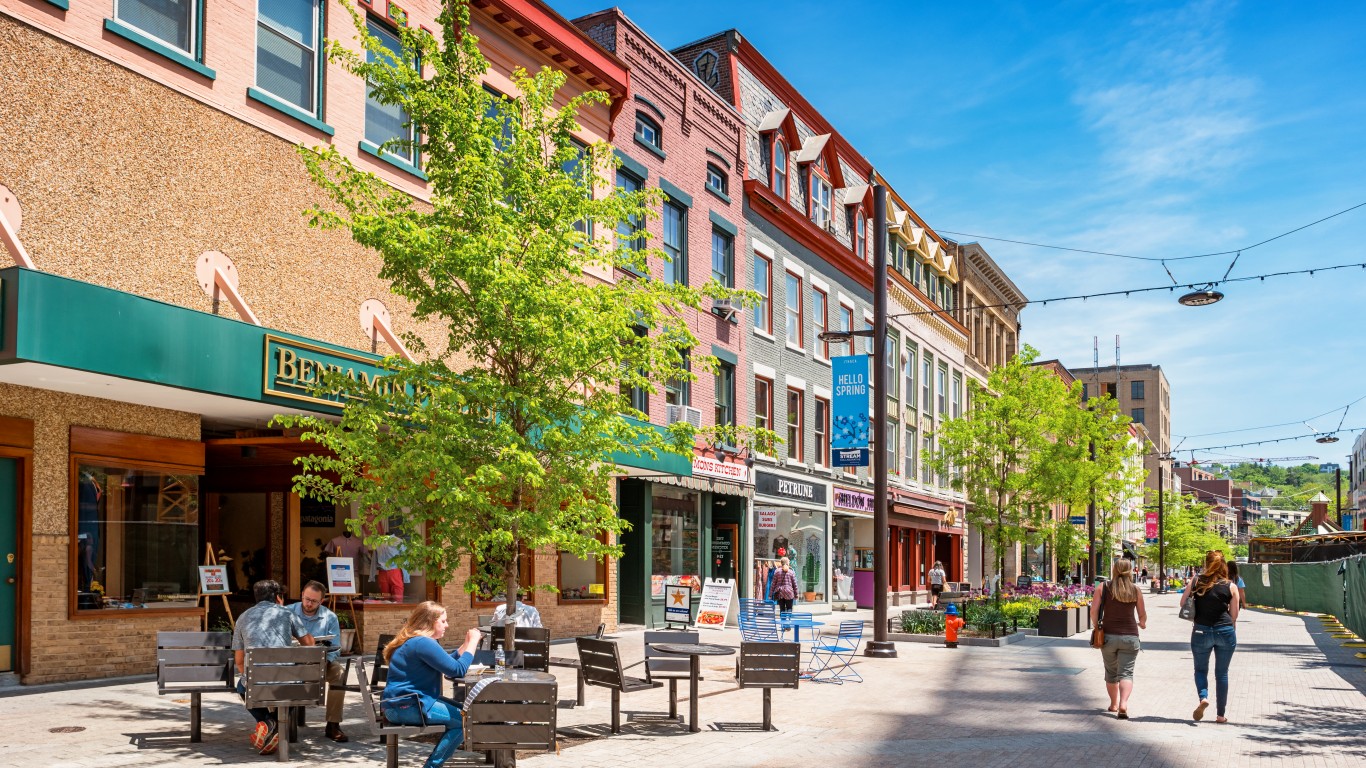
11. Ithaca, NY
> Confirmed COVID-19 cases as of May 18: 4,250
> Confirmed COVID-19 cases as of May 18 per 100,000 residents: 4,140.6
> Cumulative COVID-19 deaths as of May 18: 51
> Cumulative COVID-19 deaths as of May 18 per 100,000 residents: 49.7
> Population: 102,642

10. Bellingham, WA
> Confirmed COVID-19 cases as of May 18: 9,004
> Confirmed COVID-19 cases as of May 18 per 100,000 residents: 4,077.5
> Cumulative COVID-19 deaths as of May 18: 95
> Cumulative COVID-19 deaths as of May 18 per 100,000 residents: 43.0
> Population: 220,821
9. Albany-Lebanon, OR
> Confirmed COVID-19 cases as of May 18: 5,017
> Confirmed COVID-19 cases as of May 18 per 100,000 residents: 4,012.1
> Cumulative COVID-19 deaths as of May 18: 68
> Cumulative COVID-19 deaths as of May 18 per 100,000 residents: 54.4
> Population: 125,048
These are all the counties in Oregon where COVID-19 is slowing (and where it’s still getting worse).

8. Grants Pass, OR
> Confirmed COVID-19 cases as of May 18: 3,370
> Confirmed COVID-19 cases as of May 18 per 100,000 residents: 3,907.2
> Cumulative COVID-19 deaths as of May 18: 71
> Cumulative COVID-19 deaths as of May 18 per 100,000 residents: 82.3
> Population: 86,251
These are all the counties in Oregon where COVID-19 is slowing (and where it’s still getting worse).

7. Bangor, ME
> Confirmed COVID-19 cases as of May 18: 5,841
> Confirmed COVID-19 cases as of May 18 per 100,000 residents: 3,848.5
> Cumulative COVID-19 deaths as of May 18: 91
> Cumulative COVID-19 deaths as of May 18 per 100,000 residents: 60.0
> Population: 151,774
These are all the counties in Maine where COVID-19 is slowing (and where it’s still getting worse).

6. Eugene-Springfield, OR
> Confirmed COVID-19 cases as of May 18: 13,128
> Confirmed COVID-19 cases as of May 18 per 100,000 residents: 3,516.4
> Cumulative COVID-19 deaths as of May 18: 149
> Cumulative COVID-19 deaths as of May 18 per 100,000 residents: 39.9
> Population: 373,340
These are all the counties in Oregon where COVID-19 is slowing (and where it’s still getting worse).

5. Olympia-Lacey-Tumwater, WA
> Confirmed COVID-19 cases as of May 18: 9,634
> Confirmed COVID-19 cases as of May 18 per 100,000 residents: 3,444.3
> Cumulative COVID-19 deaths as of May 18: 103
> Cumulative COVID-19 deaths as of May 18 per 100,000 residents: 36.8
> Population: 279,711

4. Corvallis, OR
> Confirmed COVID-19 cases as of May 18: 3,127
> Confirmed COVID-19 cases as of May 18 per 100,000 residents: 3,432.2
> Cumulative COVID-19 deaths as of May 18: 20
> Cumulative COVID-19 deaths as of May 18 per 100,000 residents: 22.0
> Population: 91,107
These are all the counties in Oregon where COVID-19 is slowing (and where it’s still getting worse).

3. Bremerton-Silverdale-Port Orchard, WA
> Confirmed COVID-19 cases as of May 18: 8,124
> Confirmed COVID-19 cases as of May 18 per 100,000 residents: 3,055.5
> Cumulative COVID-19 deaths as of May 18: 111
> Cumulative COVID-19 deaths as of May 18 per 100,000 residents: 41.7
> Population: 265,882

2. Kahului-Wailuku-Lahaina, HI
> Confirmed COVID-19 cases as of May 18: 4,525
> Confirmed COVID-19 cases as of May 18 per 100,000 residents: 2,726.2
> Cumulative COVID-19 deaths as of May 18: 54
> Cumulative COVID-19 deaths as of May 18 per 100,000 residents: 32.5
> Population: 165,979
These are all the counties in Hawaii where COVID-19 is slowing (and where it’s still getting worse).

1. Urban Honolulu, HI
> Confirmed COVID-19 cases as of May 18: 26,529
> Confirmed COVID-19 cases as of May 18 per 100,000 residents: 2,693.8
> Cumulative COVID-19 deaths as of May 18: 380
> Cumulative COVID-19 deaths as of May 18 per 100,000 residents: 38.6
> Population: 984,821
These are all the counties in Hawaii where COVID-19 is slowing (and where it’s still getting worse).
Click here to see all coronavirus data for every state.
It’s Your Money, Your Future—Own It (sponsor)
Are you ahead, or behind on retirement? For families with more than $500,000 saved for retirement, finding a financial advisor who puts your interest first can be the difference, and today it’s easier than ever. SmartAsset’s free tool matches you with up to three fiduciary financial advisors who serve your area in minutes. Each advisor has been carefully vetted and must act in your best interests. Start your search now.
If you’ve saved and built a substantial nest egg for you and your family, don’t delay; get started right here and help your retirement dreams become a retirement reality.
Thank you for reading! Have some feedback for us?
Contact the 24/7 Wall St. editorial team.

Our expert who first called NVIDIA in 2009 is predicting 2025 will see a historic AI breakthrough.
You can follow him investing $500,000 of his own money on our top AI stocks for free.