
The U.S. census has been conducted once every decade since 1790. The first results of the 2020 survey were released in April, and they show that the country’s population grew over the previous 10 years at the second-lowest pace in history, increasing by 7.4%, to 331,449,281 — about half the rate it grew by in the previous ten years, during which the last millennials (the largest generation in American history) were born.
While U.S. population growth regularly topped 30% in the 1800s, the last time the U.S. exhibited growth above 20% was prior to World War I. The only time the U.S. population grew at a slower rate than in the 2010s was in the wake of the Great Depression in the 1930s.
Click here to see how every state’s population has changed since 2010.
That era also saw a redistribution of population around the country, as impoverished families packed up and moved to greener pastures — sometimes literally, considering that the Dust Bowl turned swaths of America into arid wasteland. Some rural areas in Oklahoma and Texas, for example, experienced population declines of 25% while California’s population jumped nearly 22% in the 1930s. (People still migrate from one place to another. These are cities people are abandoning.)
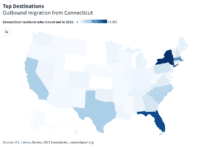
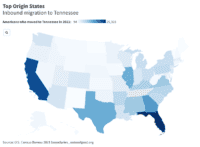
In the 2010s, Americans continued to migrate to the country’s South and West. Traditional migration magnets California and New York have been losing out to the Sunbelt states of Florida and Texas. California just gave up a population-linked congressional seat for the first time in 170 years, while Ohio and New York also lost seats. Colorado, Florida, Montana, North Carolina, and Oregon each gained a seat while Texas gained two. These are the states that gained and lost the most congressional seats.
Includes the resident population for the 50 states, as ascertained by the Twenty-Fourth Decennial Census under Title 13, United States Code, and counts of U.S. military and federal civilian employees living overseas (and their dependents living with them overseas) allocated to their home state, as reported by the employing federal agencies. Overseas is defined as any location outside the 50 United States and the District of Columbia. The apportionment population excludes the populations of the District of Columbia and Puerto Rico.
Correction: A previous version of this story incorrectly stated that Colorado, Montana, and Oregon had lost a congressional seat as a result of the Census, in fact, each state has gained a seat.
1. Alabama
> Pct. change in population, 2010-2020: +2.7%
> Resident population, July 1, 2010: 713,910
> Resident population, April 1, 2020: 733,391
[in-text-ad]

3. Arizona
> Pct. change in population, 2010-2020: +11.6%
> Resident population, July 1, 2010: 6,407,172
> Resident population, April 1, 2020: 7,151,502

4. Arkansas
> Pct. change in population, 2010-2020: +3.1%
> Resident population, July 1, 2010: 2,921,964
> Resident population, April 1, 2020: 3,011,524

5. California
> Pct. change in population, 2010-2020: +5.9%
> Resident population, July 1, 2010: 37,319,502
> Resident population, April 1, 2020: 39,538,223
[in-text-ad-2]

6. Colorado
> Pct. change in population, 2010-2020: +14.4%
> Resident population, July 1, 2010: 5,047,349
> Resident population, April 1, 2020: 5,773,714

7. Connecticut
> Pct. change in population, 2010-2020: +0.7%
> Resident population, July 1, 2010: 3,579,114
> Resident population, April 1, 2020: 3,605,944
[in-text-ad]

8. Delaware
> Pct. change in population, 2010-2020: +10.0%
> Resident population, July 1, 2010: 899,593
> Resident population, April 1, 2020: 989,948

9. Florida
> Pct. change in population, 2010-2020: +14.3%
> Resident population, July 1, 2010: 18,845,537
> Resident population, April 1, 2020: 21,538,187

10. Georgia
> Pct. change in population, 2010-2020: +10.3%
> Resident population, July 1, 2010: 9,711,881
> Resident population, April 1, 2020: 10,711,908
[in-text-ad-2]

11. Hawaii
> Pct. change in population, 2010-2020: +6.7%
> Resident population, July 1, 2010: 1,363,963
> Resident population, April 1, 2020: 1,455,271

12. Idaho
> Pct. change in population, 2010-2020: +17.1%
> Resident population, July 1, 2010: 1,570,746
> Resident population, April 1, 2020: 1,839,106
[in-text-ad]

13. Illinois
> Pct. change in population, 2010-2020: -0.2%
> Resident population, July 1, 2010: 12,840,503
> Resident population, April 1, 2020: 12,812,508
 24/7 Wall St.
14. Indiana
> Pct. change in population, 2010-2020: +4.5%
> Resident population, July 1, 2010: 6,490,432
> Resident population, April 1, 2020: 6,785,528

15. Iowa
> Pct. change in population, 2010-2020: +4.6%
> Resident population, July 1, 2010: 3,050,745
> Resident population, April 1, 2020: 3,190,369
[in-text-ad-2]

16. Kansas
> Pct. change in population, 2010-2020: +2.8%
> Resident population, July 1, 2010: 2,858,190
> Resident population, April 1, 2020: 2,937,880

17. Kentucky
> Pct. change in population, 2010-2020: +3.6%
> Resident population, July 1, 2010: 4,348,181
> Resident population, April 1, 2020: 4,505,836
[in-text-ad]

18. Louisiana
> Pct. change in population, 2010-2020: +2.5%
> Resident population, July 1, 2010: 4,544,532
> Resident population, April 1, 2020: 4,657,757
 24/7 Wall St.
19. Maine
> Pct. change in population, 2010-2020: +2.6%
> Resident population, July 1, 2010: 1,327,629
> Resident population, April 1, 2020: 1,362,359

20. Maryland
> Pct. change in population, 2010-2020: +6.7%
> Resident population, July 1, 2010: 5,788,645
> Resident population, April 1, 2020: 6,177,224
[in-text-ad-2]

21. Massachusetts
> Pct. change in population, 2010-2020: +7.1%
> Resident population, July 1, 2010: 6,566,307
> Resident population, April 1, 2020: 7,029,917

22. Michigan
> Pct. change in population, 2010-2020: +2.0%
> Resident population, July 1, 2010: 9,877,510
> Resident population, April 1, 2020: 10,077,331
[in-text-ad]

23. Minnesota
> Pct. change in population, 2010-2020: +7.5%
> Resident population, July 1, 2010: 5,310,828
> Resident population, April 1, 2020: 5,706,494
 24/7 Wall St.
24. Mississippi
> Pct. change in population, 2010-2020: -0.3%
> Resident population, July 1, 2010: 2,970,548
> Resident population, April 1, 2020: 2,961,279

25. Missouri
> Pct. change in population, 2010-2020: +2.7%
> Resident population, July 1, 2010: 5,995,974
> Resident population, April 1, 2020: 6,154,913
[in-text-ad-2]
26. Montana
> Pct. change in population, 2010-2020: +9.4%
> Resident population, July 1, 2010: 990,697
> Resident population, April 1, 2020: 1,084,225

27. Nebraska
> Pct. change in population, 2010-2020: +7.2%
> Resident population, July 1, 2010: 1,829,542
> Resident population, April 1, 2020: 1,961,504
[in-text-ad]

28. Nevada
> Pct. change in population, 2010-2020: +14.9%
> Resident population, July 1, 2010: 2,702,405
> Resident population, April 1, 2020: 3,104,614
 24/7 Wall St.
29. New Hampshire
> Pct. change in population, 2010-2020: +4.6%
> Resident population, July 1, 2010: 1,316,762
> Resident population, April 1, 2020: 1,377,529

30. New Jersey
> Pct. change in population, 2010-2020: +5.6%
> Resident population, July 1, 2010: 8,799,446
> Resident population, April 1, 2020: 9,288,994
[in-text-ad-2]

31. New Mexico
> Pct. change in population, 2010-2020: +2.6%
> Resident population, July 1, 2010: 2,064,552
> Resident population, April 1, 2020: 2,117,522

32. New York
> Pct. change in population, 2010-2020: +4.1%
> Resident population, July 1, 2010: 19,399,878
> Resident population, April 1, 2020: 20,201,249
[in-text-ad]

33. North Carolina
> Pct. change in population, 2010-2020: +9.0%
> Resident population, July 1, 2010: 9,574,323
> Resident population, April 1, 2020: 10,439,388

34. North Dakota
> Pct. change in population, 2010-2020: +15.5%
> Resident population, July 1, 2010: 674,715
> Resident population, April 1, 2020: 779,094

35. Ohio
> Pct. change in population, 2010-2020: +2.3%
> Resident population, July 1, 2010: 11,539,336
> Resident population, April 1, 2020: 11,799,448
[in-text-ad-2]

36. Oklahoma
> Pct. change in population, 2010-2020: +5.3%
> Resident population, July 1, 2010: 3,759,944
> Resident population, April 1, 2020: 3,959,353

37. Oregon
> Pct. change in population, 2010-2020: +10.4%
> Resident population, July 1, 2010: 3,837,491
> Resident population, April 1, 2020: 4,237,256
[in-text-ad]

38. Pennsylvania
> Pct. change in population, 2010-2020: +2.3%
> Resident population, July 1, 2010: 12,711,160
> Resident population, April 1, 2020: 13,002,700

39. Rhode Island
> Pct. change in population, 2010-2020: +4.1%
> Resident population, July 1, 2010: 1,053,959
> Resident population, April 1, 2020: 1,097,379

40. South Carolina
> Pct. change in population, 2010-2020: +10.4%
> Resident population, July 1, 2010: 4,635,649
> Resident population, April 1, 2020: 5,118,425
[in-text-ad-2]

41. South Dakota
> Pct. change in population, 2010-2020: +8.6%
> Resident population, July 1, 2010: 816,166
> Resident population, April 1, 2020: 886,667

42. Tennessee
> Pct. change in population, 2010-2020: +8.7%
> Resident population, July 1, 2010: 6,355,311
> Resident population, April 1, 2020: 6,910,840
[in-text-ad]

43. Texas
> Pct. change in population, 2010-2020: +15.5%
> Resident population, July 1, 2010: 25,241,971
> Resident population, April 1, 2020: 29,145,505

44. Utah
> Pct. change in population, 2010-2020: +17.9%
> Resident population, July 1, 2010: 2,775,332
> Resident population, April 1, 2020: 3,271,616

45. Vermont
> Pct. change in population, 2010-2020: +2.7%
> Resident population, July 1, 2010: 625,879
> Resident population, April 1, 2020: 643,077
[in-text-ad-2]

46. Virginia
> Pct. change in population, 2010-2020: +7.6%
> Resident population, July 1, 2010: 8,023,699
> Resident population, April 1, 2020: 8,631,393

47. Washington
> Pct. change in population, 2010-2020: +14.3%
> Resident population, July 1, 2010: 6,742,830
> Resident population, April 1, 2020: 7,705,281
[in-text-ad]

48. West Virginia
> Pct. change in population, 2010-2020: -3.3%
> Resident population, July 1, 2010: 1,854,239
> Resident population, April 1, 2020: 1,793,716

49. Wisconsin
> Pct. change in population, 2010-2020: +3.6%
> Resident population, July 1, 2010: 5,690,475
> Resident population, April 1, 2020: 5,893,718

50. Wyoming
> Pct. change in population, 2010-2020: +2.2%
> Resident population, July 1, 2010: 564,487
> Resident population, April 1, 2020: 576,851
In 20 Years, I Haven’t Seen A Cash Back Card This Good
After two decades of reviewing financial products I haven’t seen anything like this. Credit card companies are at war, handing out free rewards and benefits to win the best customers.
A good cash back card can be worth thousands of dollars a year in free money, not to mention other perks like travel, insurance, and access to fancy lounges.
Our top pick today pays up to 5% cash back, a $200 bonus on top, and $0 annual fee. Click here to apply before they stop offering rewards this generous.
Flywheel Publishing has partnered with CardRatings for our coverage of credit card products. Flywheel Publishing and CardRatings may receive a commission from card issuers.
Thank you for reading! Have some feedback for us?
Contact the 24/7 Wall St. editorial team.
Latest from 24/7


Our expert who first called NVIDIA in 2009 is predicting 2025 will see a historic AI breakthrough.
You can follow him investing $500,000 of his own money on our top AI stocks for free.