The COVID-19 pandemic was a public health crisis that sent shockwaves through the U.S. economy — and the country’s social fabric. In addition to claiming over half a million American lives, the pandemic sent unemployment soaring and exacerbated existing problems, as drug overdoses and crime rates spiked in some parts of the country.
Even before the pandemic, however, there were cities and towns already grappling with severe social and economic distress. These communities have long struggled with challenges such as high unemployment, poverty, crime, drug misuse, and limited access to essential services.
Using data from a range of sources, including the FBI, Centers for Disease Control and Prevention, and the U.S. Census Bureau, 24/7 Wall St. created a weighted index of 24 social, economic, and health measures to identify the worst place to live in in every state. We considered cities, towns, villages, and census designated places.
It is important to note that the cities on this list rank poorly compared to other places within their respective state and do not necessarily rank poorly on a national level. In some states with smaller populations or better overall socioeconomic conditions, variations in measures of quality of life between cities and towns are often less pronounced. In these states, the community that ranks as the worst place to live often does not face many of the serious social and economic problems common in other cities on this list. Here is a look at the states with the best and worst economies.
Relatively poor conditions in many of the places on this list are likely contributing to population decline. The vast majority of the communities on this list are home to fewer people now than five years ago. Here is a look at America’s fastest shrinking city.
Click here to see the worst city to live in every state.
Click here to read our detailed methodology.

Alabama: Atmore
> Population: 9,495
> Median home value: $94,300 (state: $142,700)
> Poverty rate: 34.6% (state: 16.7%)
> 5-yr. avg. unemployment: 15.7% (state: 5.9%)
Atmore, a city of just under 10,000 residents in southern Alabama, ranks as the worst place to live in the state. The area’s high poverty rate affects overall quality of life. At 34.6%, the city’s poverty rate is more than double the 16.7% poverty rate across all of Alabama. Widespread poverty is partially attributable to a lack of economic opportunity, as an average of 15.7% of the labor force have been unemployed over the past five years, nearly triple the comparable 5.9% rate statewide.
Financial hardship and a lack of jobs are likely driving people out of Atmore. In the last five years, the local population has contracted by 6.0%.
[in-text-ad]
Alaska: Fairbanks
> Population: 31,551
> Median home value: $211,500 (state: $270,400)
> Poverty rate: 11.0% (state: 10.7%)
> 5-yr. avg. unemployment: 7.7% (state: 6.8%)
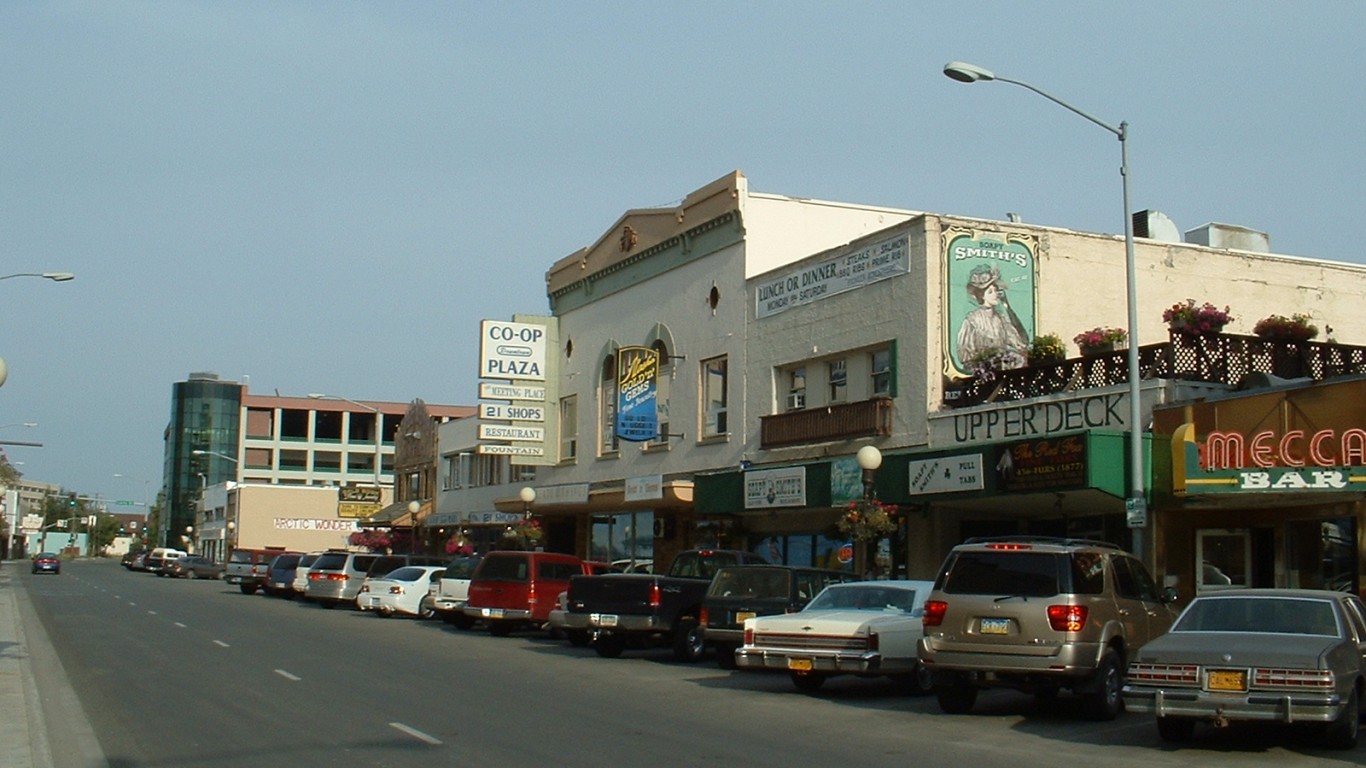
There are just over a dozen cities and towns in Alaska with sufficient data for analysis, and of them, Fairbanks ranks as the worst place to live. One of the more dangerous parts of the country, there were 784 violent crimes for every 100,000 people in Fairbanks in 2019, more than double the U.S. violent crime rate of 367 incidents per 100,000 people.
In some ways, Fairbanks residents are more likely to be financially disadvantaged than those in the rest of Alaska. Though the median household income in Fairbanks of $62,602 is closely in line with the national median, it is nearly the lowest of any city or town considered in the state. Across all of Alaska, the typical household earns $77,640 annually. Additionally, the homeownership rate in Fairbanks of 35.8% is well below the 64.3% rate statewide — and historically, homeownership has been one of the most practical ways to build wealth in the United States.
Arizona: Douglas
> Population: 16,307
> Median home value: $100,300 (state: $225,500)
> Poverty rate: 30.1% (state: 15.1%)
> 5-yr. avg. unemployment: 11.4% (state: 5.9%)
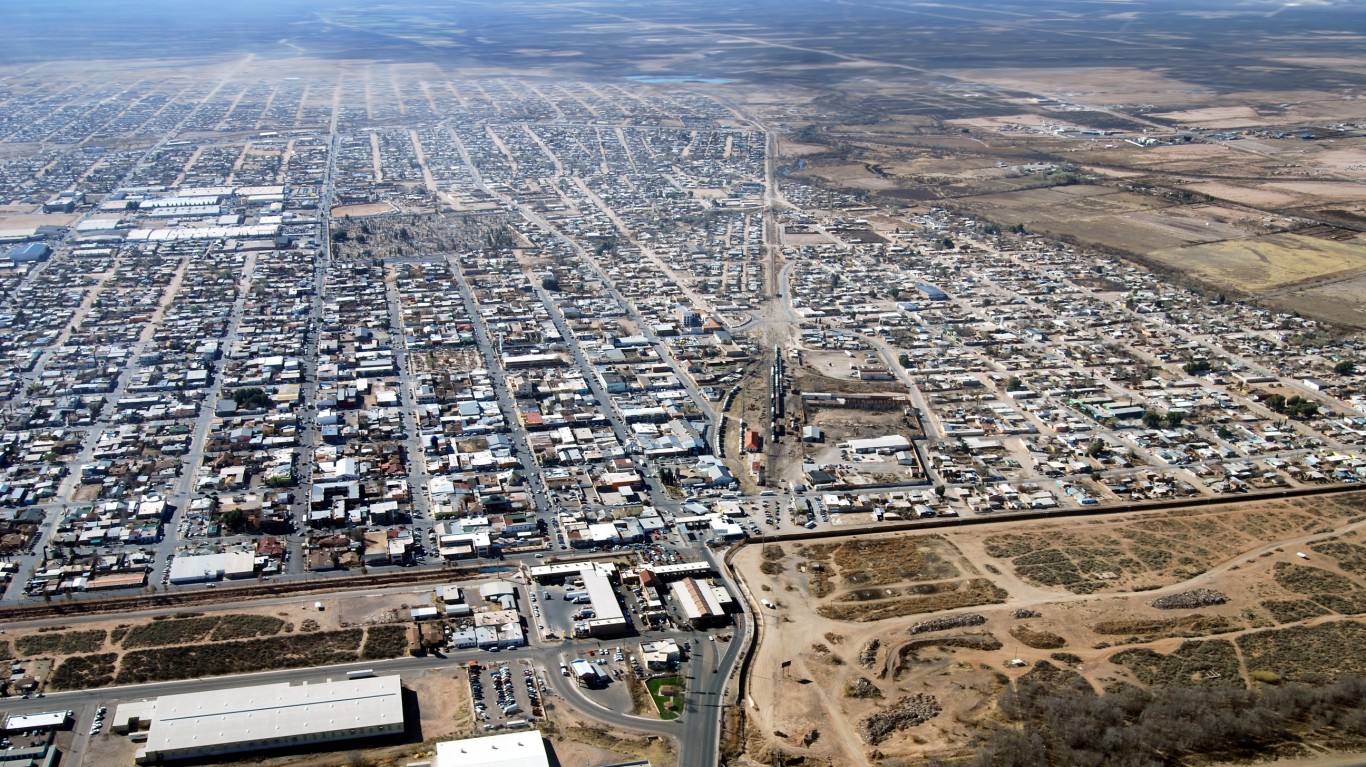
Douglas, a small city located in southern Arizona along the U.S.-Mexico border, ranks as the worst place to live in the state. The area is poor with 30.1% of the population living below the poverty line and the typical household earning about $35,500 a year. Meanwhile, only 15.1% of the Arizona population live below the poverty line and the statewide median annual household income is $58,945. The greater financial insecurity in the area is partially the result of a weak job market, as average unemployment in the city over the last five years was 11.4%, well above the 5.9% five-year rate across Arizona.
Across Cochise County, where Douglas is located, residents have relatively limited access to public spaces for recreation and exercise. Less than 60% county residents have easy access to places like parks and recreation centers, compared to about 84% of all Americans.
Arkansas: Helena-West Helena
> Population: 10,749
> Median home value: $73,400 (state: $127,800)
> Poverty rate: 45.2% (state: 17.0%)
> 5-yr. avg. unemployment: 11.8% (state: 5.1%)
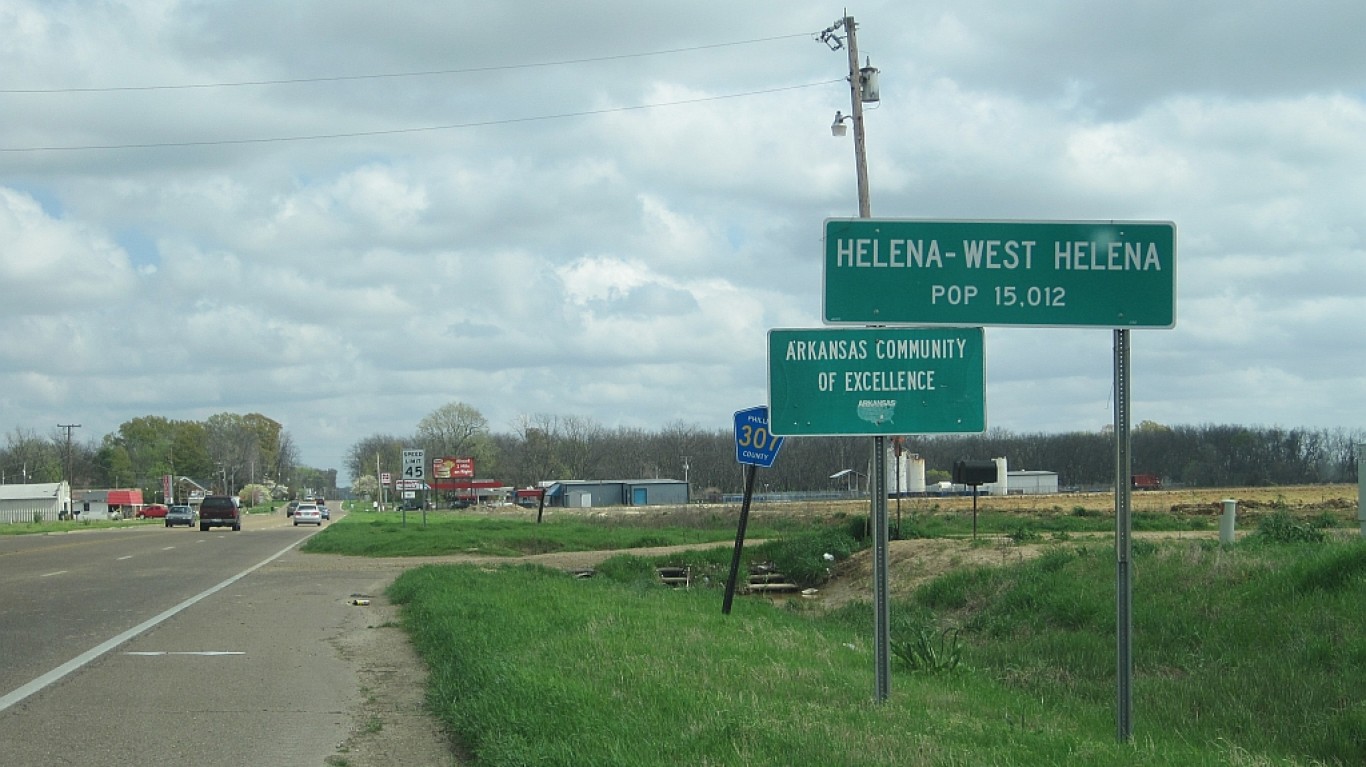
Helena-West Helena ranks as the worst place to live in Arkansas. The local poverty rate of 45.2% is among the highest of any city in the United States — well above both the 17.0% state poverty rate and 13.4% national rate. The city is also one of the most dangerous nationwide. There were 1,836 violent crimes for every 100,000 people in the city in 2019, many times higher than the national violent crime rate of 367 per 100,000.
Members of the labor force in Helena-West Helena are more than twice as likely as members of the labor force in all of Arkansas to be unemployed. With such weak economic conditions, residents are far more likely than average to depend on government assistance to meet their basic needs. An estimated 36.8% of area households receive SNAP benefits, more than triple the 11.7% national recipiency rate.
[in-text-ad-2]

California: California City
> Population: 13,826
> Median home value: $124,500 (state: $505,000)
> Poverty rate: 24.1% (state: 13.4%)
> 5-yr. avg. unemployment: 19.1% (state: 6.0%)
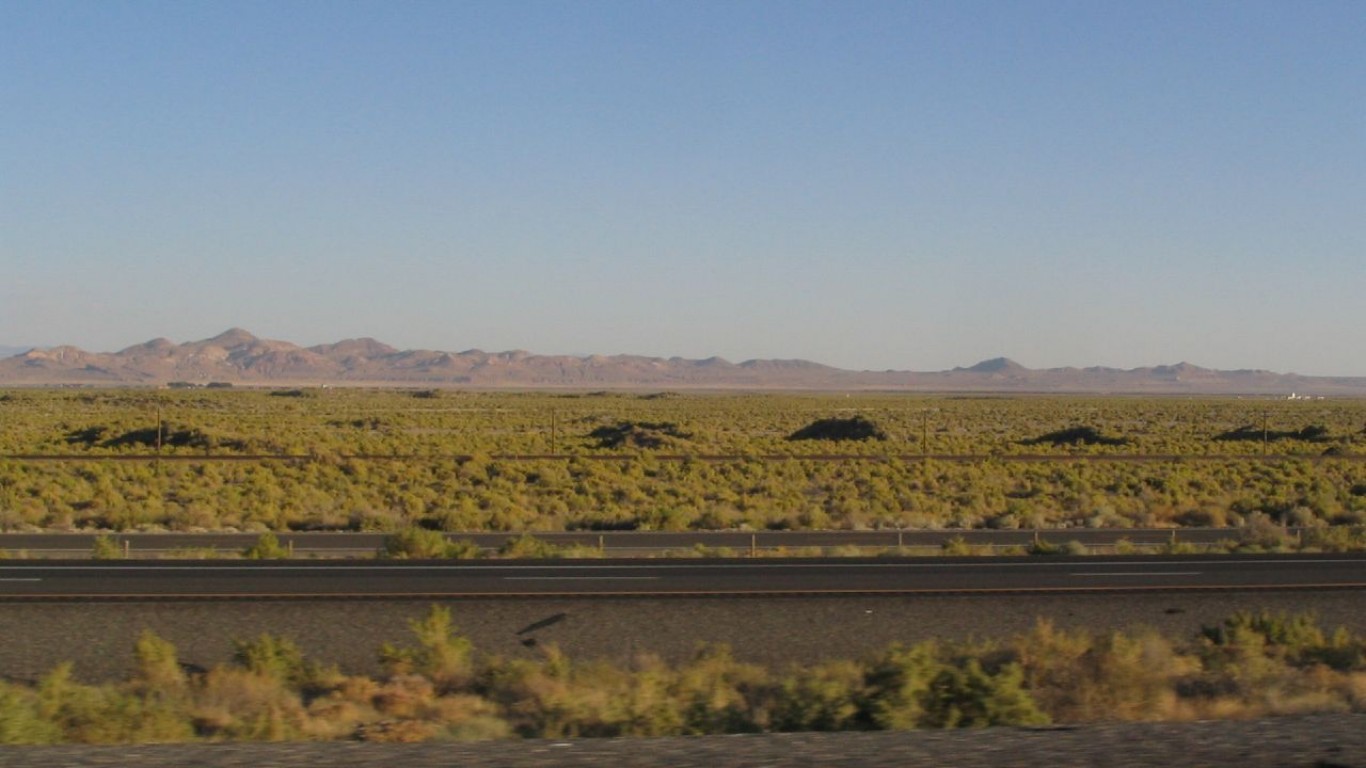
Based on a range of key socio-economic measures, California City ranks as the worst place to live in California.The city of about 14,000 residents located in the southern half of the state has one of the worst job markets in the country. Over the last five years, an average of 19.1% of the labor force were unemployed, more than triple the 6.0% statewide average over that time. The high unemployment is likely attributable in part to the relative lack of local businesses. There are a far lower than average concentration of places like bars, restaurants, hotels, gyms, theaters relative to the population in California City than there are nationwide.
Home values can be indicative of a given area’s desirability. In California City, the typical home is worth $124,500 — a fraction of the median home value across the state as a whole of over half a million dollars.
Colorado: Pueblo
> Population: 110,841
> Median home value: $141,000 (state: $343,300)
> Poverty rate: 23.5% (state: 10.3%)
> 5-yr. avg. unemployment: 8.4% (state: 4.3%)
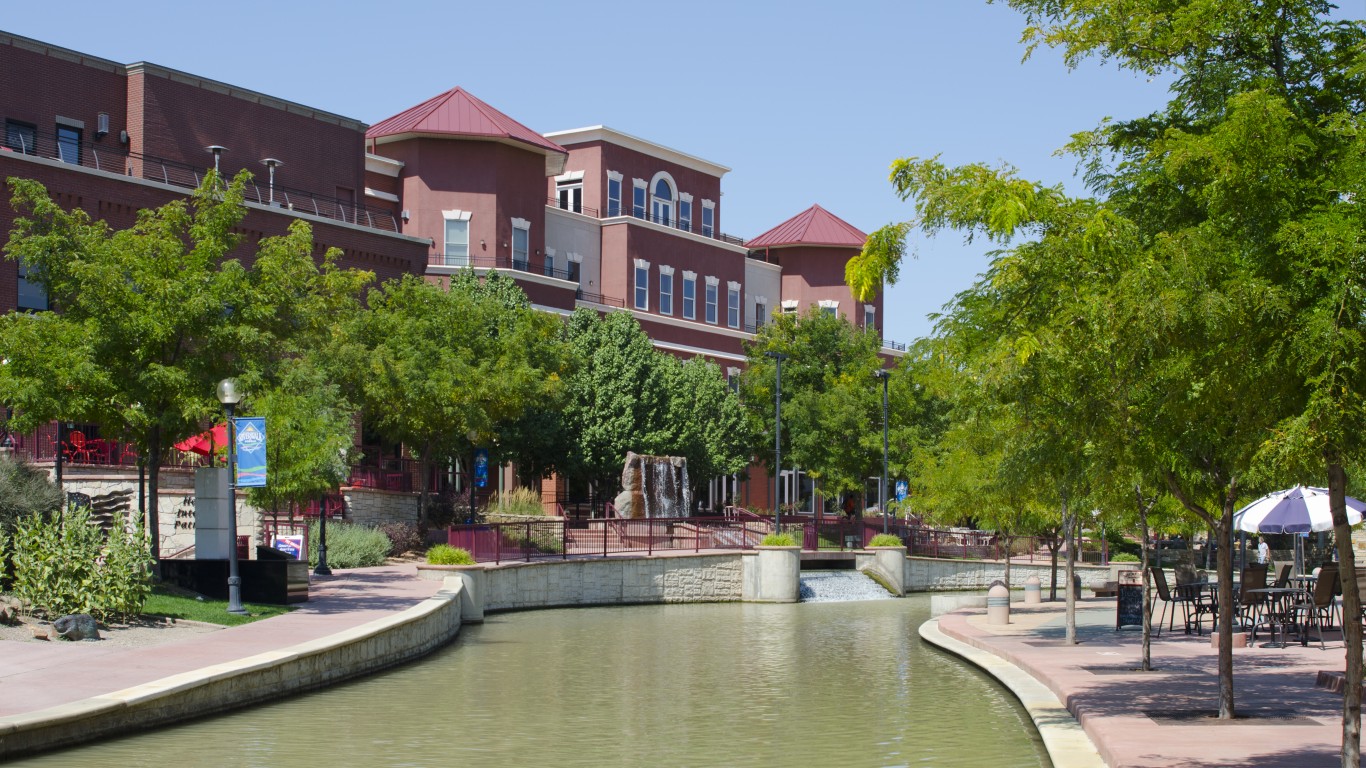
Pueblo, Colorado, a city of about 111,000 people about 100 miles south of Denver, ranks as the worst place to live in the state. Unemployment is nearly twice as high in Pueblo as it is across all of Colorado, and the local poverty rate of 23.5% is more than double the 10.3% state poverty rate.
Places with fewer economic opportunities and widespread poverty are often more susceptible to social problems such as substance use. Across Pueblo County, there are 32.9 accidental drug overdose deaths for every 100,000 people annually, well above the 22.5 overdose deaths per 100,000 people nationwide.
[in-text-ad]
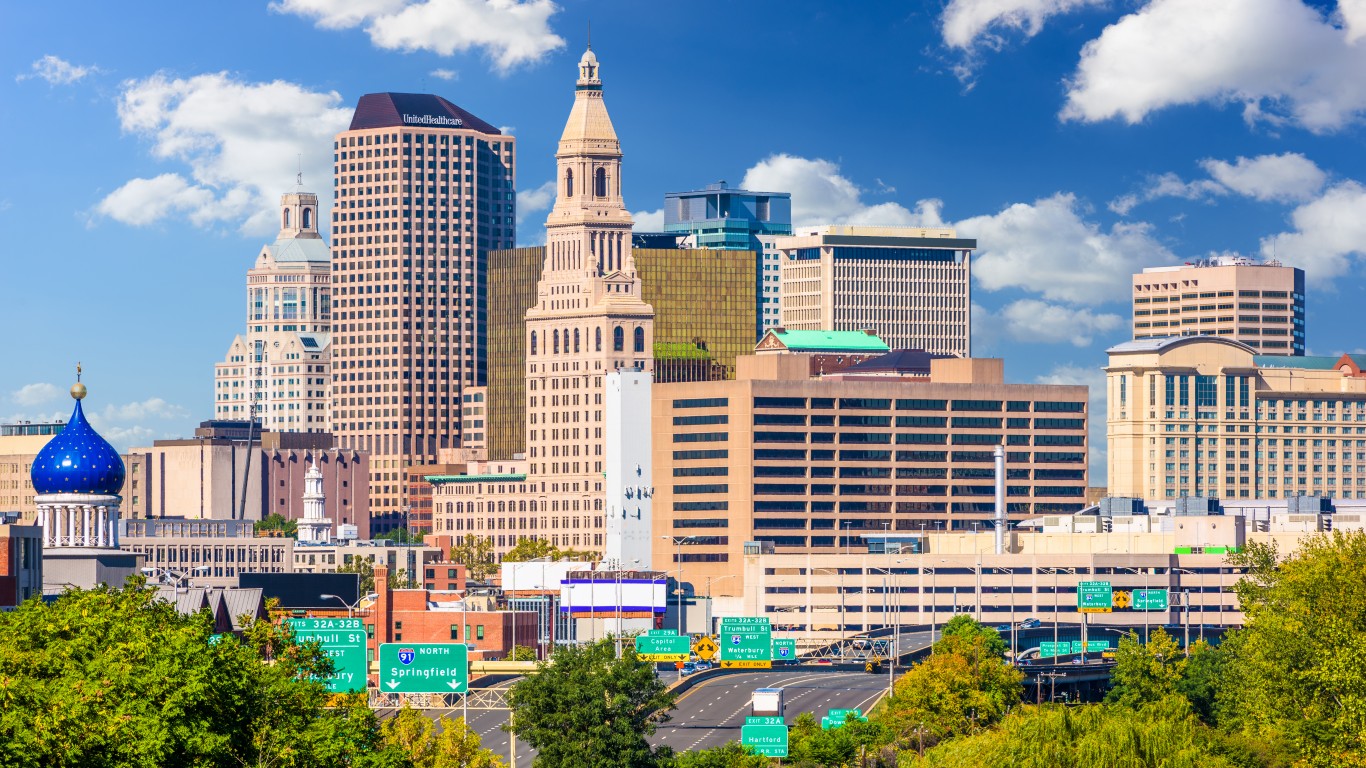
Connecticut: Hartford
> Population: 123,088
> Median home value: $165,300 (state: $275,400)
> Poverty rate: 28.1% (state: 9.9%)
> 5-yr. avg. unemployment: 12.0% (state: 6.0%)
Hartford, Connecticut’s state capital, also ranks as the worst place to live in the state. There were 858 violent crimes for every 100,000 people in Hartford in 2019, making it the most dangerous city in the state and one of the most dangerous in the country. For context, there were 367 violent crimes for every 100,000 people nationwide the same year.
High crime rates can make an area less attractive for businesses and hamper economic growth and job creation — and many in Hartford are out of work. Over the last five years, an average of 12% of the local labor force have been unemployed, double the 6% state unemployment rate over that time. High crime and limited opportunities may be pushing people out of Hartford. Over the last five years, the city’s population contracted by 1.7%.
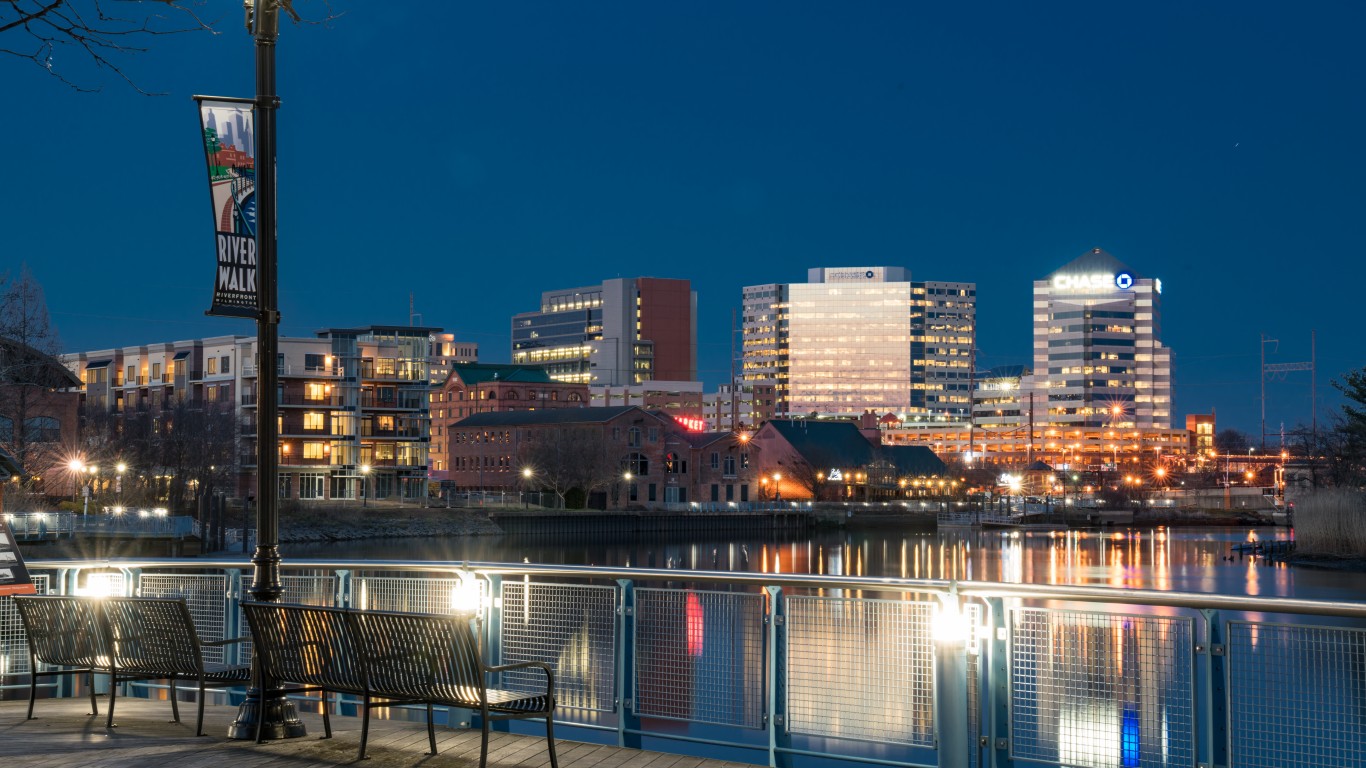
Delaware: Wilmington
> Population: 70,644
> Median home value: $168,000 (state: $251,100)
> Poverty rate: 26.0% (state: 11.8%)
> 5-yr. avg. unemployment: 8.4% (state: 5.5%)
A geographically small state, Delaware is home to only a dozen cities and towns with sufficient data for analysis. Of them, Wilmington ranks as the worst place to live. Financial insecurity hinders quality of life in the city. An estimated 13.5% of Wilmington households live on less than $10,000 a year, more than double the 5.3% share of all Delaware households.
Wilmington is also one of the most dangerous cities in the United States. There were 1,498 violent crimes for every 100,000 people in the city in 2019, many times higher than the national violent crime rate of 367 incidents per 100,000 people.
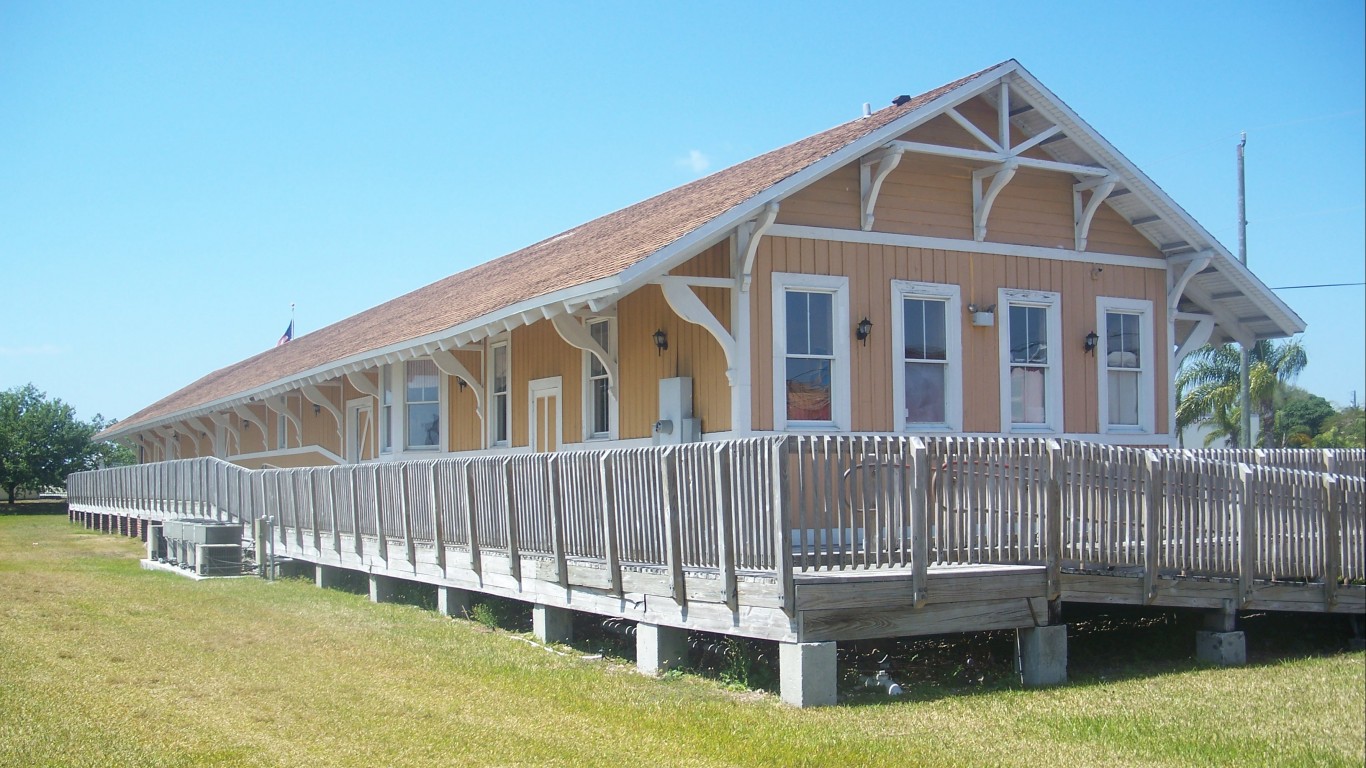
Florida: Florida City
> Population: 11,928
> Median home value: $153,100 (state: $215,300)
> Poverty rate: 40.0% (state: 14.0%)
> 5-yr. avg. unemployment: 14.0% (state: 5.6%)
Florida City, located in southern Florida, ranks as the worst place to live in the state. Likely due in part to a 14.0% average five-year unemployment rate, well more than double the comparable 5.6% statewide rate, serious financial hardship is widespread in the area. An estimated 40% of the 12,000 people living in Florida City earn a poverty level income, compared to 14% of all Floridians who do.
Florida City also has nearly the highest violent crime rate of any city tracked by the FBI. There were a total of 2,619 violent crimes reported in the area for every 100,000 people in 2019 compared to the national violent crime rate of 367 per 100,000.
[in-text-ad-2]

Georgia: Albany
> Population: 73,478
> Median home value: $99,800 (state: $176,000)
> Poverty rate: 30.8% (state: 15.1%)
> 5-yr. avg. unemployment: 13.7% (state: 5.6%)
Albany, a city of about 73,500 in southwestern Georgia, ranks as the worst place to live in the state due in large part to economic conditions. A typical resident of Albany is more than twice as likely as the typical Georgia resident to be unemployed and to live below the poverty line.
High crime rates can make an area less attractive for businesses and hamper economic growth and job creation — and Albany is a relatively dangerous city. There were 1,053 violent crimes for every 100,000 people in Albany in 2019. For context, there were 367 violent crimes for every 100,000 people nationwide the same year.

Hawaii: Makaha
> Population: 8,404
> Median home value: $404,900 (state: $615,300)
> Poverty rate: 31.0% (state: 9.4%)
> 5-yr. avg. unemployment: 12.7% (state: 4.0%)
Makaha, Hawaii, is a coastal community on the island of O’ahu. The worst place to live in the state, Makaha’s poverty rate of 31.0% is more than three times the statewide poverty rate of 9.4%. Quality of life in the area is further undermined by how unaffordable homeownership is for so many. The typical area home is worth $404,900, nearly eight times the median household income of $50,992. For context, the typical home nationwide is worth about 3.5 times more than the median household income. Likely partially as a result, the local homeownership rate is just 39.6%, compared to the 64.0% U.S. average.
Financial security among Makaha residents would likely improve with a stronger job market. The average unemployment rate in the area over the last five years of 12.7% is more than triple the 4.0% average across Hawaii over that time.
[in-text-ad]

Idaho: Mountain Home
> Population: 14,166
> Median home value: $144,200 (state: $212,300)
> Poverty rate: 16.4% (state: 13.1%)
> 5-yr. avg. unemployment: 6.6% (state: 4.3%)
Due in large part to economic conditions, Mountain Home, located in the southern half of Idaho, ranks as the worst place to live in the state. An average of 6.6% of the local labor force have been unemployed in the last five years, nearly the highest jobless rate of any city or town in the state. Additionally, only 36.9% of the local population are working, by far the smallest share in the state and well below the 47.7% share of all Americans who are working.
Job opportunities have gotten increasingly scarce in the area in recent years. The number of people working in Mountain Home fell by 7.4% between 2015 and 2019. Over the same period, employment climbed by 6.2% nationwide.

Illinois: Sauk Village
> Population: 10,423
> Median home value: $70,400 (state: $194,500)
> Poverty rate: 31.8% (state: 12.5%)
> 5-yr. avg. unemployment: 16.3% (state: 5.9%)
Sauk Village, located about 30 miles south of Chicago, ranks as the worst place to live in Illinois in part because of the share of the population that face financial hardship. Nearly 32% of the population live below the poverty line, and more than one in every 10 households earn less than $10,000 a year. Across all of Illinois, the poverty rate is 12.5%, and 6.3% of households earn less than $10,000 annually.
Adjusting for population, Sauk Village also has the highest concentration of violent crime of any city or town tracked by the FBI in the United States. There were a total of 5,485 violent crimes reported in the area for every 100,000 people in 2019 compared to the national violent crime rate of 367 incidents per 100,000 people.
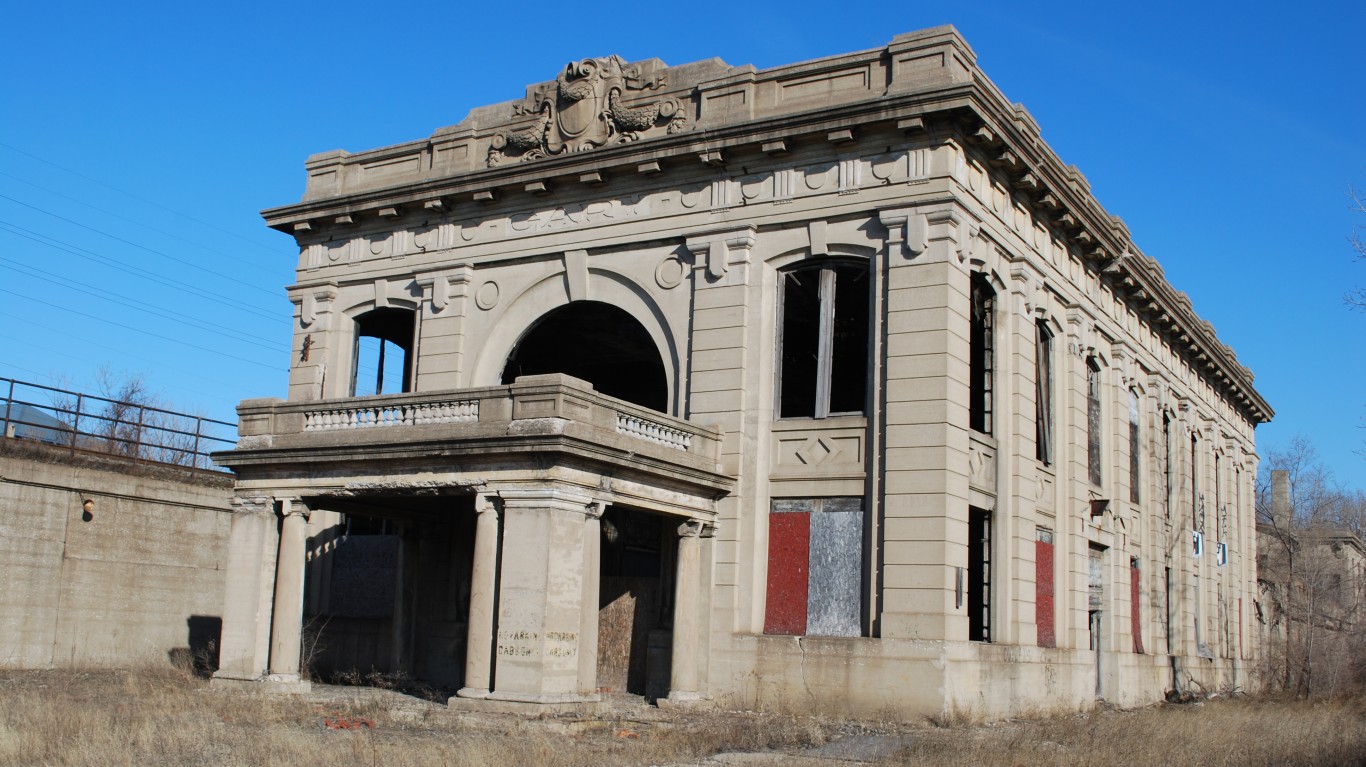
Indiana: Gary
> Population: 76,010
> Median home value: $66,100 (state: $141,700)
> Poverty rate: 30.6% (state: 13.4%)
> 5-yr. avg. unemployment: 12.4% (state: 4.8%)
Gary, a Rust Belt city in northern Indiana, ranks as the worst place to live in the state. The five-year average unemployment rate in Gary is 12.4%, making it the only place in the state with a double digit jobless rate — well above the 4.8% five-year state average. The lack of economic opportunity partially explains the poverty rate, which at 30.6% is more than double the state poverty rate of 13.4%.
A lack of economic opportunity also means Gary residents are more likely to depend on the government to meet their basic needs. An estimated 27.0% of local households receive SNAP benefits, compared to the 11.7% recipiency rate nationwide.
[in-text-ad-2]
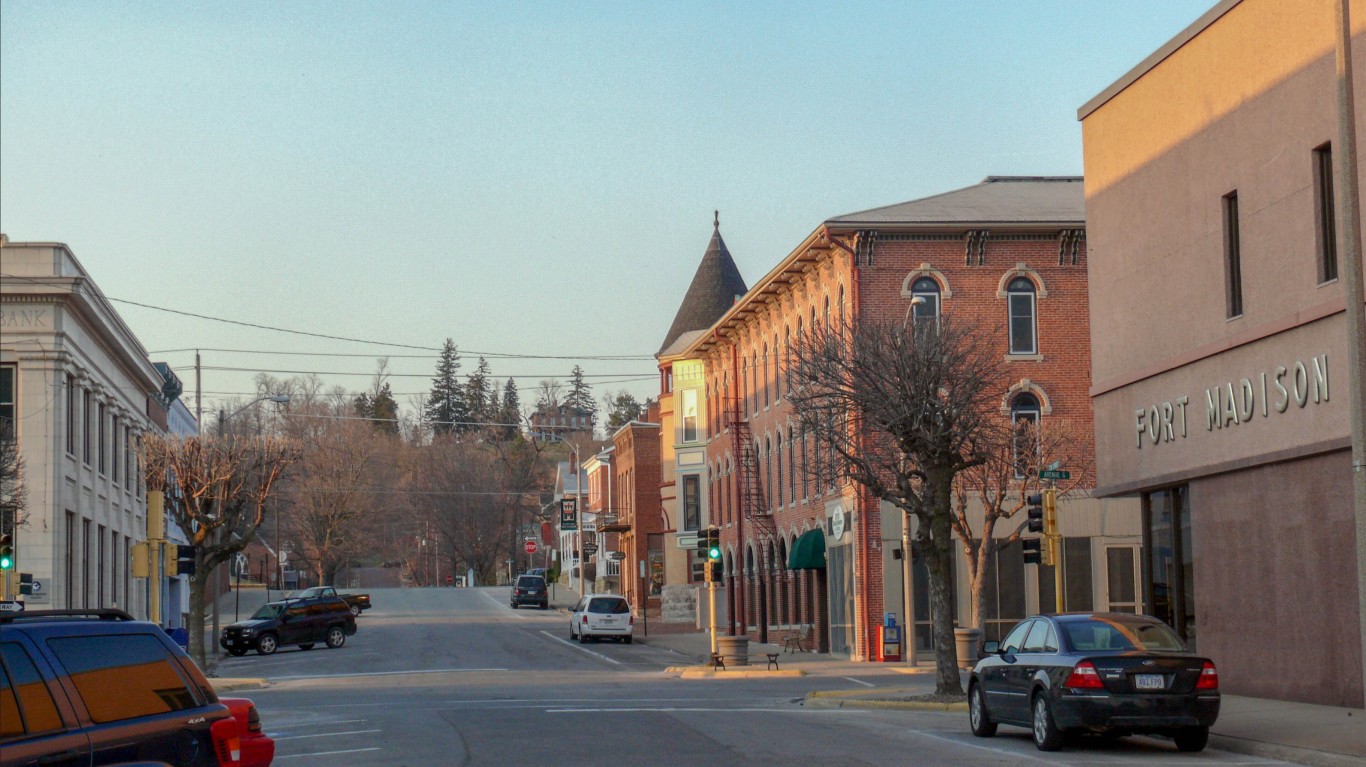
Iowa: Fort Madison
> Population: 10,513
> Median home value: $81,600 (state: $147,800)
> Poverty rate: 15.9% (state: 11.5%)
> 5-yr. avg. unemployment: 8.9% (state: 3.7%)
Fort Madison, in southeastern Iowa, is the worst place to live in the state. There were 664 violent crimes for every 100,000 city residents in 2019, well above the 367 violent crimes for every 100,000 people nationwide the same year.
High crime rates can push people out of an area and hamper economic growth and job creation. Over the last five years, an average of 8.9% of the local labor force have been unemployed, double the comparable 3.7% state unemployment rate. Additionally, the city’s population contracted by 3.8% over the last five years.
Kansas: Coffeyville
> Population: 9,457
> Median home value: $55,800 (state: $151,900)
> Poverty rate: 29.3% (state: 12.0%)
> 5-yr. avg. unemployment: 6.0% (state: 4.0%)
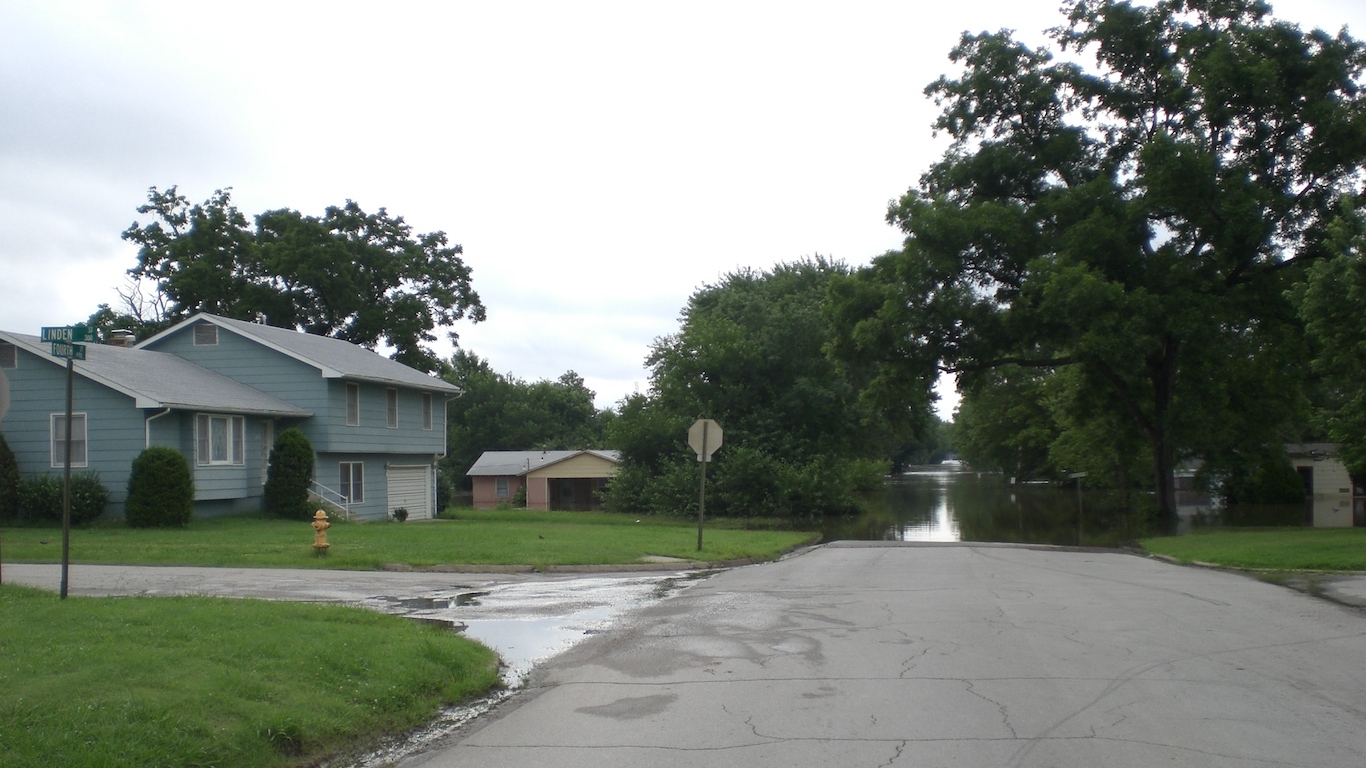
Coffeyville is a small city of less than 10,000 people in southeastern Kansas. The city ranks as the worst place to live in the state largely because of the share of residents struggling financially. The typical area household earns just $33,750 a year, less than every other city and town with sufficient data in the state. Additionally, nearly 30% of area residents live below the poverty line, more than double the 12.0% state poverty rate. Partially as a result, Coffeyville is the only city in the state where more than 20% of households receive SNAP benefits to afford basic necessities.
Home values can be indicative of an area’s desirability as a place to live. In Coffeyville, the typical home is worth just $55,800. The median home value in Kansas is $151,900, and the typical home U.S. home is worth $217,500.
[in-text-ad]
Kentucky: Mayfield
> Population: 9,867
> Median home value: $100,200 (state: $141,000)
> Poverty rate: 34.7% (state: 17.3%)
> 5-yr. avg. unemployment: 11.6% (state: 5.5%)
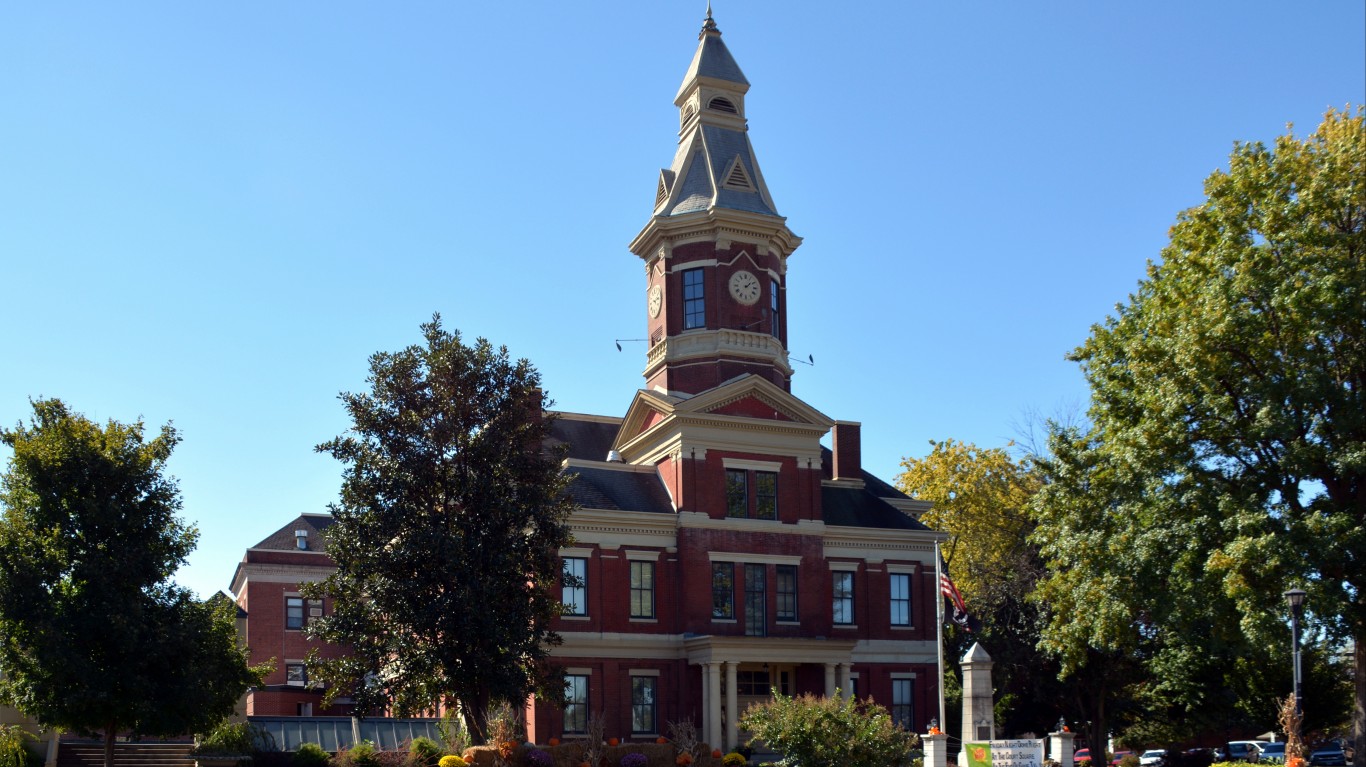
Mayfield, a small city of less than 10,000 located in southwestern Kentucky, ranks as the worst place to live in the state. The average unemployment rate in the city of 11.6% over the last five years makes Mayfield one of only two cities or towns with sufficient data in the state where more than one in every 10 members of the labor force have been out of work.
Limited job availability is contributing to financial hardship and may also be pushing people out of Mayfield. An estimated 34.7% of the local population live below the poverty line, double the state poverty rate. Additionally, over the last half decade, the number of people living in Mayfield has fallen by 2.2%.
Louisiana: Opelousas
> Population: 16,234
> Median home value: $98,100 (state: $163,100)
> Poverty rate: 43.3% (state: 19.2%)
> 5-yr. avg. unemployment: 8.8% (state: 6.4%)
Socioeconomic conditions in the city of Opelousas, Louisiana, make it the worst place to live in the state. One of the most dangerous places in the country, Opelousas’s violent crime rate of 2,455 incidents per 100,000 people is more than six times higher than the 367 per 100,000 national violent crime rate.
High crime can discourage economic development, and Opelousas has a far lower than average per capita concentration of businesses like restaurants, bars, and gyms. Additionally, the five-year average unemployment rate of 8.8% in the area is far higher than the 6.4% comparable rate across all of Louisiana.
Maine: Sanford
> Population: 21,073
> Median home value: $183,800 (state: $190,400)
> Poverty rate: 13.9% (state: 11.8%)
> 5-yr. avg. unemployment: 6.4% (state: 4.1%)
Sanford is a small city of about 21,000 residents in southwestern Maine. Due to a number of key socioeconomic indicators, it ranks as the worst place to live in the state. Parts of New England have been hit especially hard by the opioid epidemic, and in York County, where Sanford is located, there are 39.2 accidental drug overdose deaths for every 100,000 people annually, well above the comparable 22.5 per 100,000 nationwide. Substance misuse issues tend to be more common in areas with limited economic opportunity, and Sanford residents are more likely to be unemployed and living below the poverty line than the typical Maine resident.
Limited access to emergency medical care further reduces quality of life in Sanford. The nearest hospital is nearly 14 miles away from the city. None of the other cities and towns in Maine with sufficient data are more than 7 miles from a hospital.
[in-text-ad-2]

Maryland: Baltimore
> Population: 609,032
> Median home value: $160,100 (state: $314,800)
> Poverty rate: 21.2% (state: 9.2%)
> 5-yr. avg. unemployment: 8.3% (state: 5.0%)
Due in large part to several social and public health challenges, Baltimore ranks as the worst city to live in Maryland. For one, Baltimore is one of the most dangerous large cities in the United States. There were 1,859 violent crimes for every 100,000 people in Baltimore in 2019, five times the national violent crime rate of 367 per 100,000 that year.
Drugs are also taking a serious toll in Baltimore. Across the county, there are 103.5 accidental drug overdose deaths for every 100,000 people annually, more than four times the national drug fatality rate of 22.5 per 100,000. Unhealthy substance use is often more common in areas with limited economic opportunity, and in Baltimore, 21.2% of the population live below the poverty line, more than double Maryland’s 9.2% poverty rate.
Massachusetts: Holyoke
> Population: 40,241
> Median home value: $195,800 (state: $381,600)
> Poverty rate: 29.3% (state: 10.3%)
> 5-yr. avg. unemployment: 6.0% (state: 4.8%)
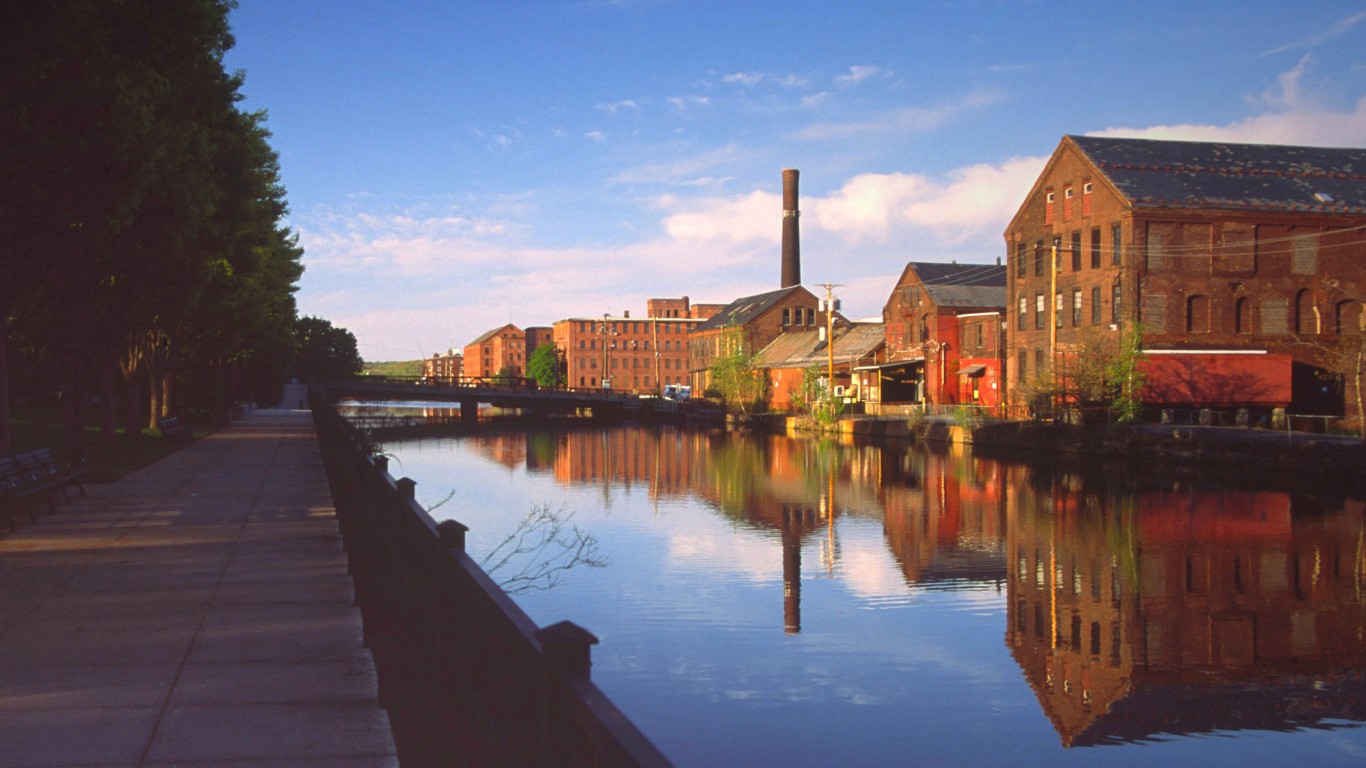
Holyoke, Massachusetts, located just north of Springfield, ranks as the worst place to live in the state. One of the poorest places in the state, Holyoke’s poverty rate of 29.3% is nearly three times higher than the state poverty rate of 10.3%
Homeownership is one of the most practical ways to build wealth in the United States, and in Holyoke, the homeownership rate is just 40.7%, well below the 64.0% national rate. For many in the city, owning a home is not affordable. The typical house in the city is worth $195,800, 4.8 times more than the local median household income of $40,769. Nationwide, the median home value is only 3.5 times higher than the median income.
[in-text-ad]
Michigan: Highland Park
> Population: 10,867
> Median home value: $45,700 (state: $154,900)
> Poverty rate: 46.5% (state: 14.4%)
> 5-yr. avg. unemployment: 22.6% (state: 5.9%)
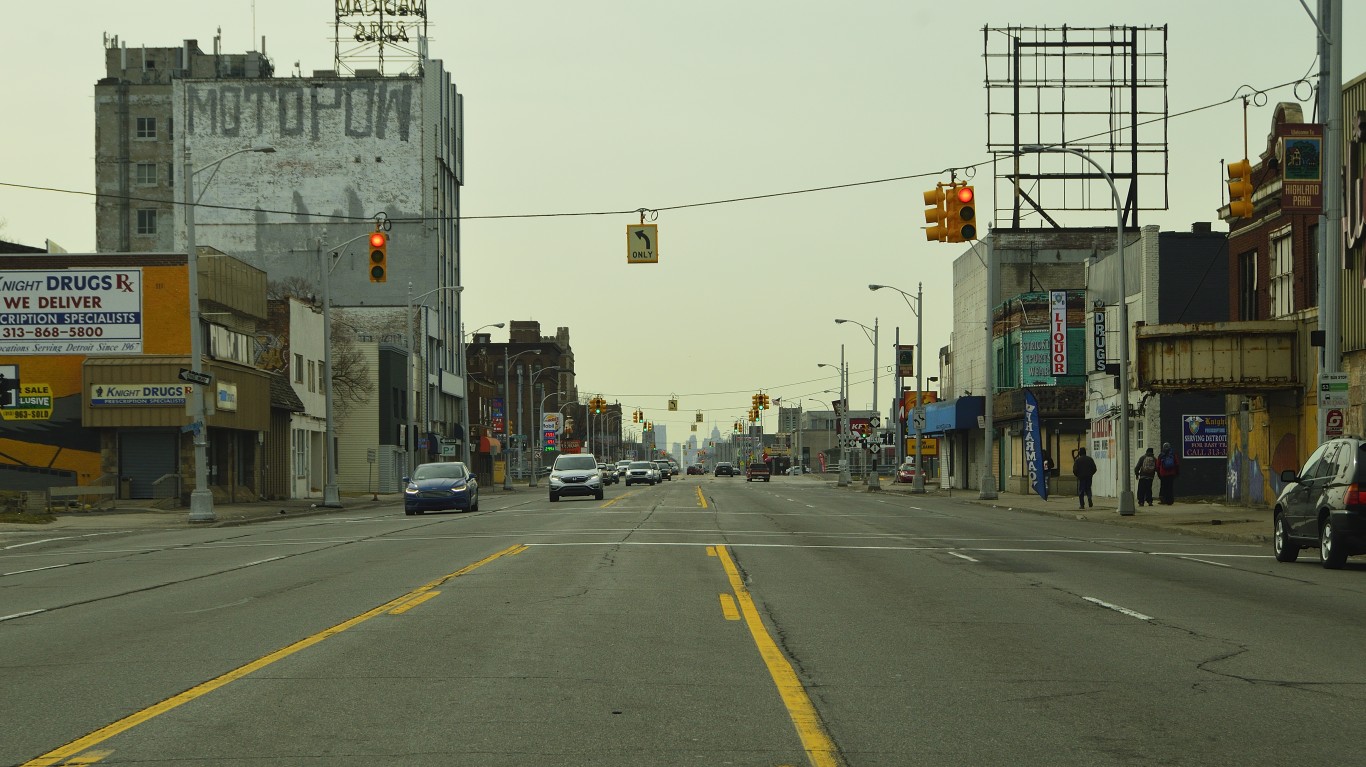
Highland Park, an independent city in Michigan bordered on all sides by Detroit, ranks as the worst place to live in the state. The city, like many others in the Rust Belt, is struggling economically. The five-year average unemployment rate in the city of 22.6% is about four times higher than the comparable 5.9% statewide average. Additionally, an estimated 46.5% of Highland Park residents live below the poverty line, compared to 14.4% of all Michigan residents.
Job growth and economic development are likely being held back, at least partially, by high crime in the city. There were 2,065 violent crimes for every 100,000 people in Highland Park in 2019, more than five times the national violent crime rate of 367 per 100,000 that year.
Minnesota: Virginia
> Population: 8,484
> Median home value: $92,200 (state: $223,900)
> Poverty rate: 25.5% (state: 9.7%)
> 5-yr. avg. unemployment: 6.4% (state: 3.6%)
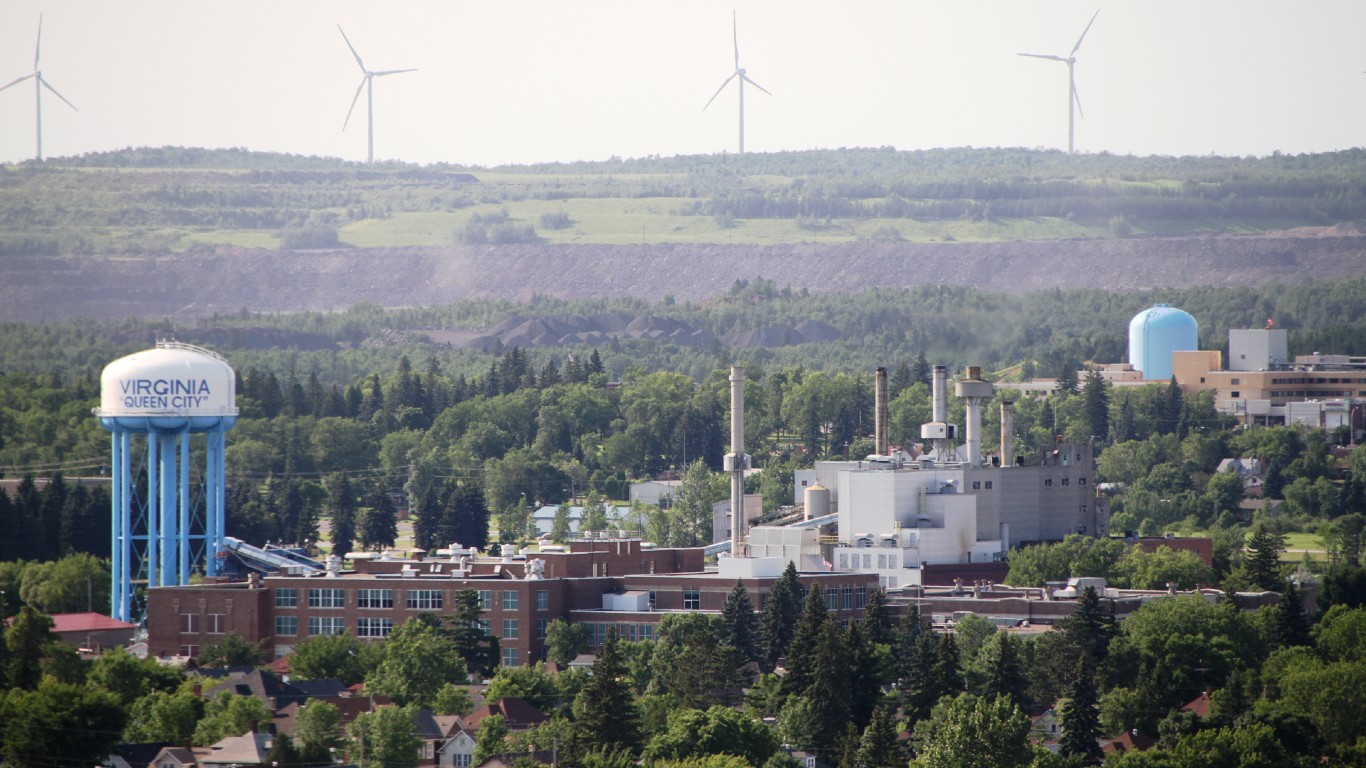
Virginia, a small city of about 8,500 residents in Minnesota’s Iron Range, is the worst place to live in the state. The region, named for its iron mining industry, has struggled since the collapse of the U.S. steel industry in the 1980s. The city’s poverty rate of 25.5% is more than double the 9.7% rate across Minnesota.
The prevalence of financial hardship may be pushing people out of the city. Over the last five years, the number of people living in Virginia has declined by 2.2%. Likely due to both population decline and widespread poverty, home values in the city are low. The typical area home is worth just $92,200, less than the median home value in any other city or town in Minnesota with adequate data.
Mississippi: Yazoo City
> Population: 11,063
> Median home value: $70,900 (state: $119,000)
> Poverty rate: 44.8% (state: 20.3%)
> 5-yr. avg. unemployment: 20.5% (state: 7.4%)
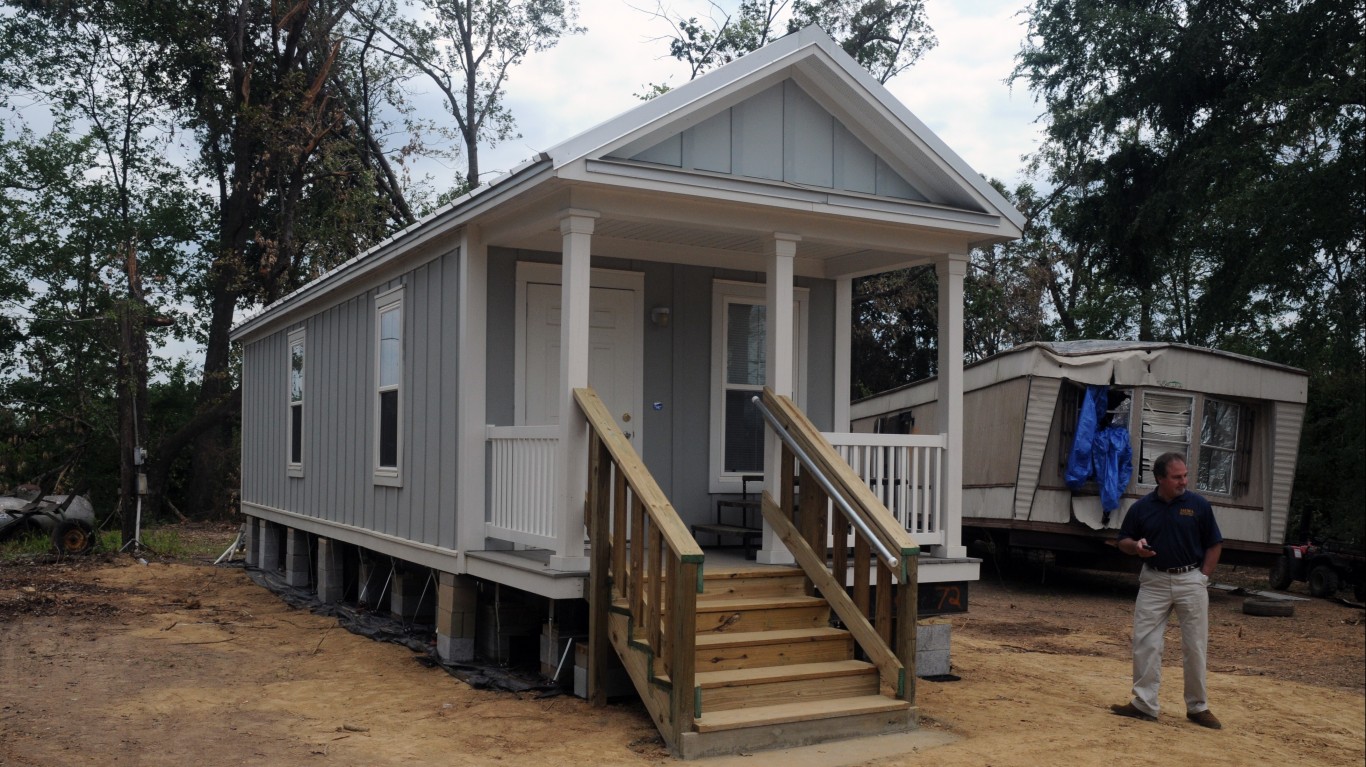
Yazoo City, located in Mississippi’s Delta region, is the worst place to live in the state. With a poverty rate of 44.8%, the city is nearly the poorest in the state and one of the poorest places in the United States. For context 20.3% of Mississippi residents and 13.4% of the U.S. population live below the poverty line. Widespread financial hardship in the area is due in part to a lack of jobs. An average of 20.5% of the local labor force have been unemployed in the last five years, well above the 7.4% statewide average over that time.
A lack of economic opportunity has left many Yazoo City residents needing to depend on government assistance to afford basic necessities. An estimated 39.1% of area households rely on SNAP benefits, more than triple the national SNAP recipiency rate of 11.7%. As is often the case in economically depressed areas, Yazoo City is losing residents. The local population contracted by 3.5% in the last five years.
[in-text-ad-2]
Missouri: St. Louis
> Population: 308,174
> Median home value: $138,700 (state: $157,200)
> Poverty rate: 21.8% (state: 13.7%)
> 5-yr. avg. unemployment: 7.0% (state: 4.5%)
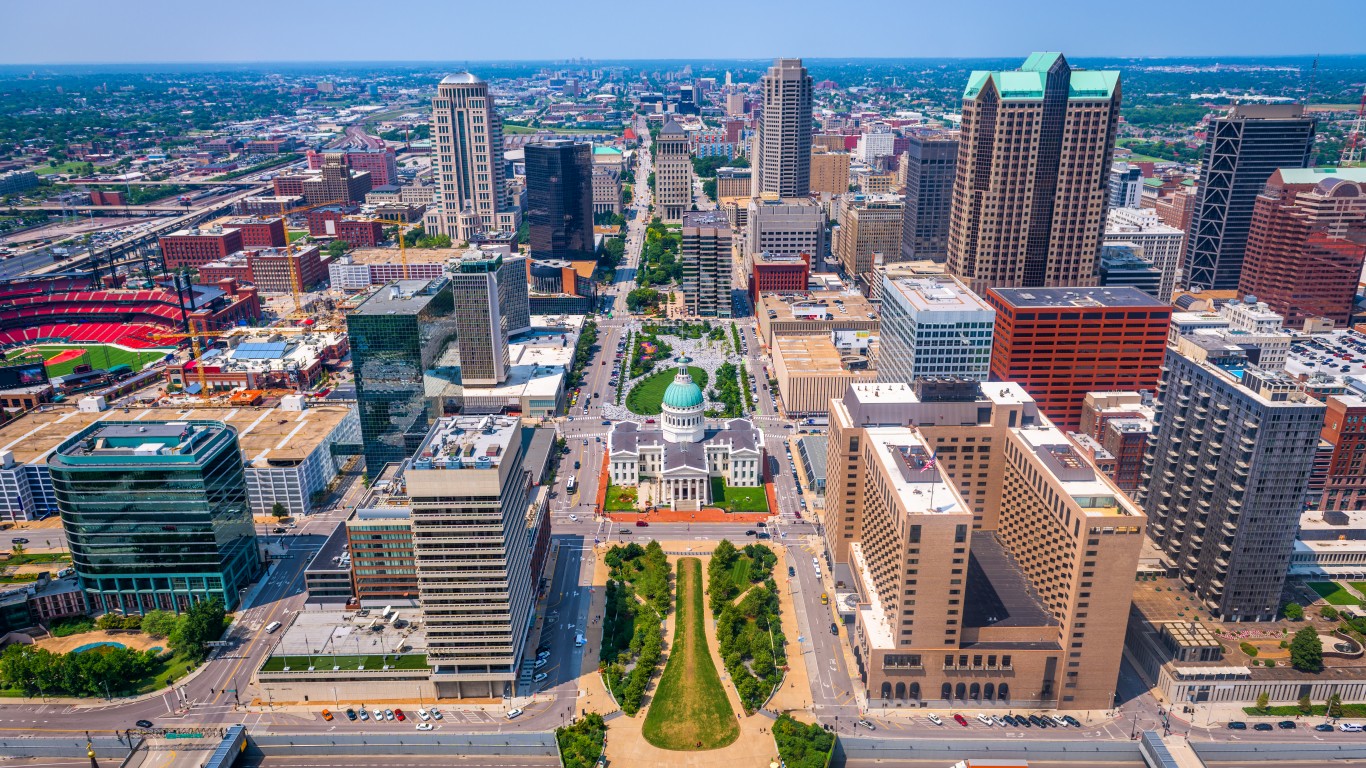
St. Louis, Missouri, ranks as the worst city to live in the state due to a number of social and economic factors. For one, St. Louis is one of the most dangerous large cities in the United States. There were 1,927 violent crimes for every 100,000 people in St. Louis in 2019, more than five times the national violent crime rate of 367 per 100,000 that year.
Drugs are also taking a serious toll in St. Louis. Across the county, there are 73.2 accidental drug overdose deaths for every 100,000 people annually, more than three times the national drug fatality rate of 22.5 per 100,000. Substance misuse is often more common in areas with limited economic opportunity, and in St. Louis, 21.8% of the population live below the poverty line, well above Missouri’s 13.7% poverty rate.
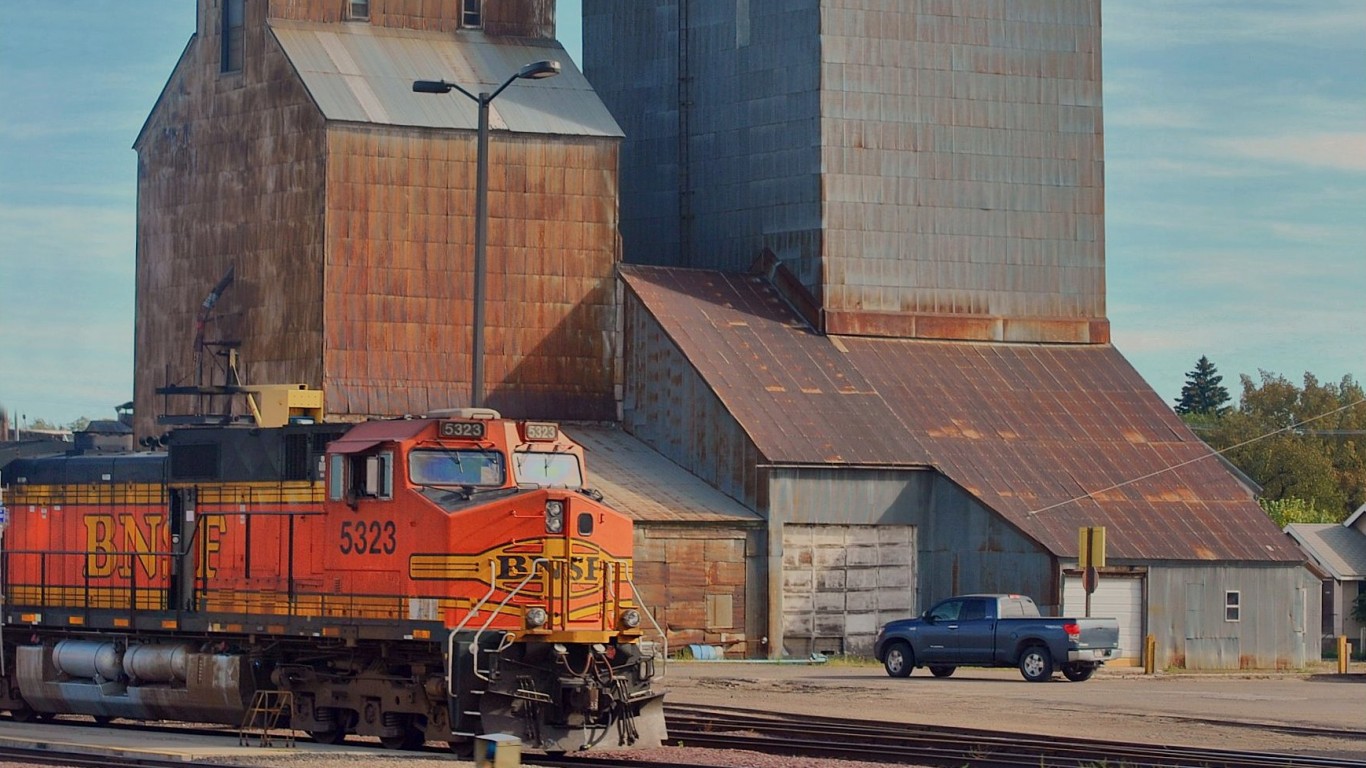
Montana: Havre
> Population: 9,786
> Median home value: $149,300 (state: $230,600)
> Poverty rate: 17.8% (state: 13.1%)
> 5-yr. avg. unemployment: 6.6% (state: 4.0%)
Havre, Montana, is a small city in the north-central part of the state. Havre ranks as the worst place to live in Montana partially because its 6.6% five-year average unemployment rate is the highest of any city or town in the state with sufficient data. With limited job opportunities, residents are more likely than most in Montana to rely on government assistance to afford basic necessities. An estimated 17.1% of area households receive SNAP benefits, the highest recipiency rate of any city or town in the state.
Home values are often indicative of an area’s desirability as a place to live. In Havre, the typical home is worth just $149,300, nearly $80,000 less than the state’s median home value of $230,600.
[in-text-ad]
Nebraska: Scottsbluff
> Population: 14,737
> Median home value: $116,600 (state: $155,800)
> Poverty rate: 18.0% (state: 11.1%)
> 5-yr. avg. unemployment: 6.4% (state: 3.3%)
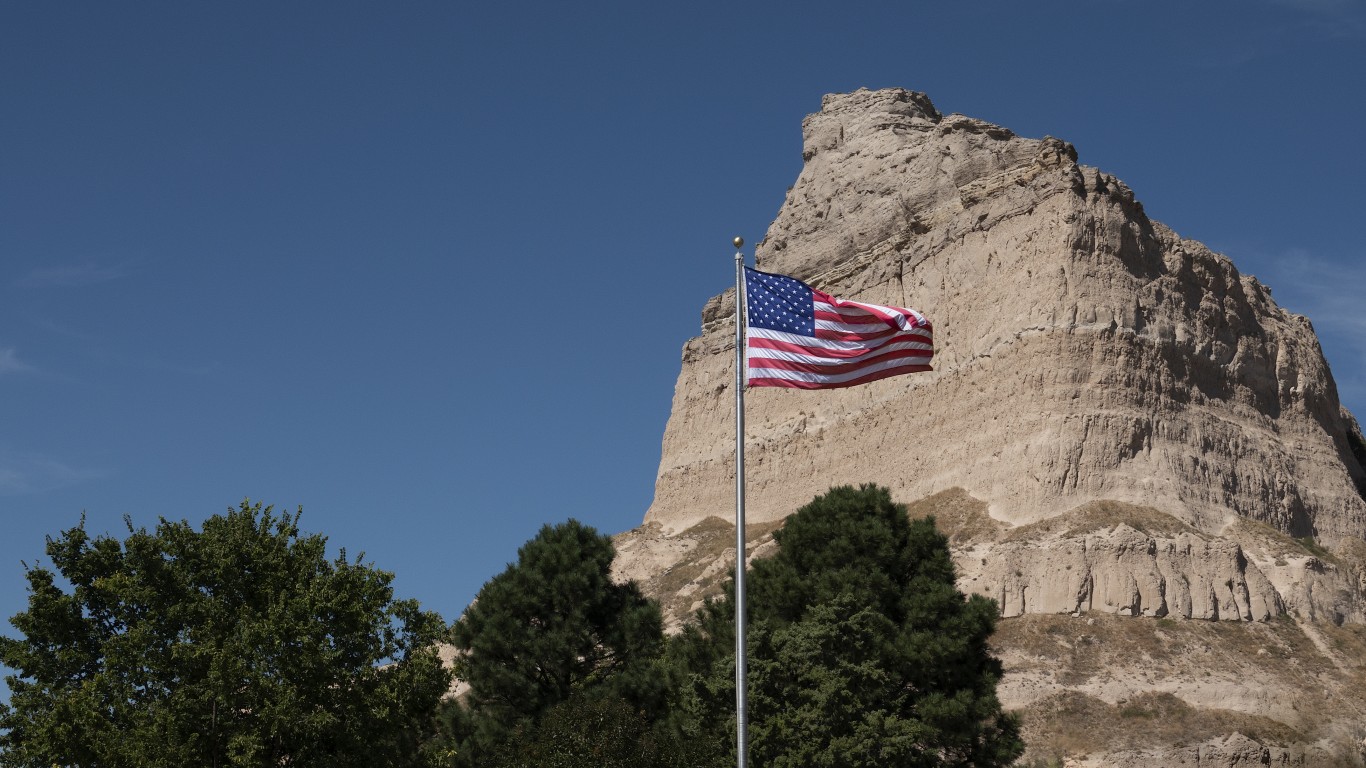
Scottsbluff, located in western Nebraska, is the worst place to live in the state. Of the 19 cities and towns in Nebraska with sufficient data, Scottsbluff has the highest five-year unemployment rate, which, at 6.4%, is nearly double the comparable 3.3% statewide rate. The relative lack of jobs is contributing to the greater likelihood of poverty in the city. An estimated 18.0% of the Scottsbluff population live below the poverty line, also the largest share in the state.
Lagging economies can often drive people away, and Scottsbluff’s population has contracted by 1.7% over the last five years.
Nevada: Fernley
> Population: 20,068
> Median home value: $221,200 (state: $267,900)
> Poverty rate: 9.9% (state: 13.1%)
> 5-yr. avg. unemployment: 5.8% (state: 6.1%)
Fernley, Nevada, a small city just east of Reno, is the worst place to live in the state, partially due to issues related to public health and health care access. Across the broader Lyon County, where Fernley is located, there are 34.8 accidental drug overdose deaths for every 100,000 people annually, the most of any county considered in the state and well above the U.S. drug fatality rate of 22.5 per 100,000. Emergency medical care is also relatively difficult to access for Fernley residents as the nearest hospital is nearly 24 miles away. No other city or town in Nevada with adequate data is farther than 14 miles from a hospital.
Across Lyon County, residents have relatively limited access to public spaces for recreation and exercise. An estimated 67.8% county residents have easy access to places like parks and recreation centers, compared to 84.2% of all Americans.
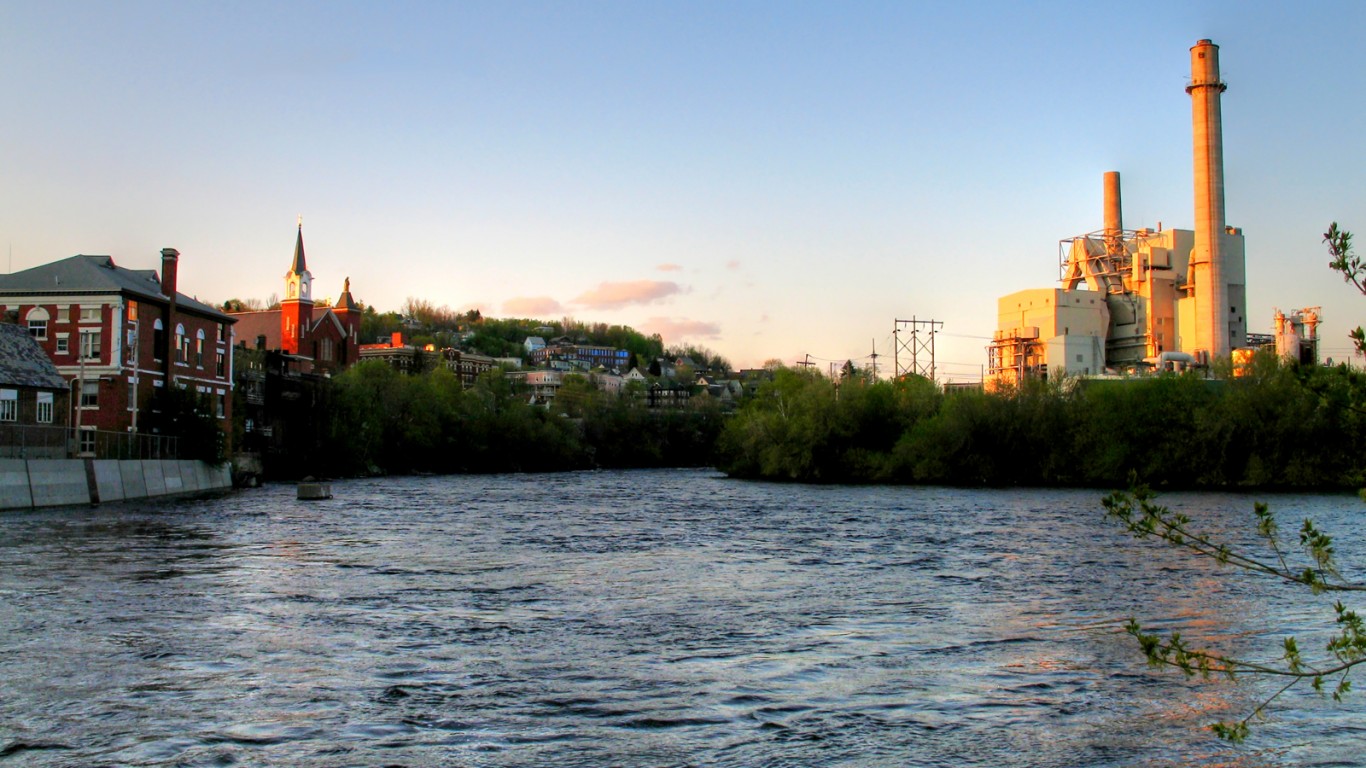
New Hampshire: Berlin
> Population: 10,221
> Median home value: $92,100 (state: $261,700)
> Poverty rate: 18.5% (state: 7.6%)
> 5-yr. avg. unemployment: 8.0% (state: 3.6%)
Berlin, a small city in northern New Hampshire, ranks as the worst place to live in the state. Home values are often a reflection of an area’s desirability, and Berlin is the only place with sufficient data in the state where most homes are worth less than $100,000. The median home value in Berlin is just $92,100, a fraction of the $261,700 statewide median.
The lack of economic opportunity hinders quality of life in the city. The average unemployment rate in Berlin over the last five years is 8.0%, more than double the comparable 3.6% statewide rate.
[in-text-ad-2]
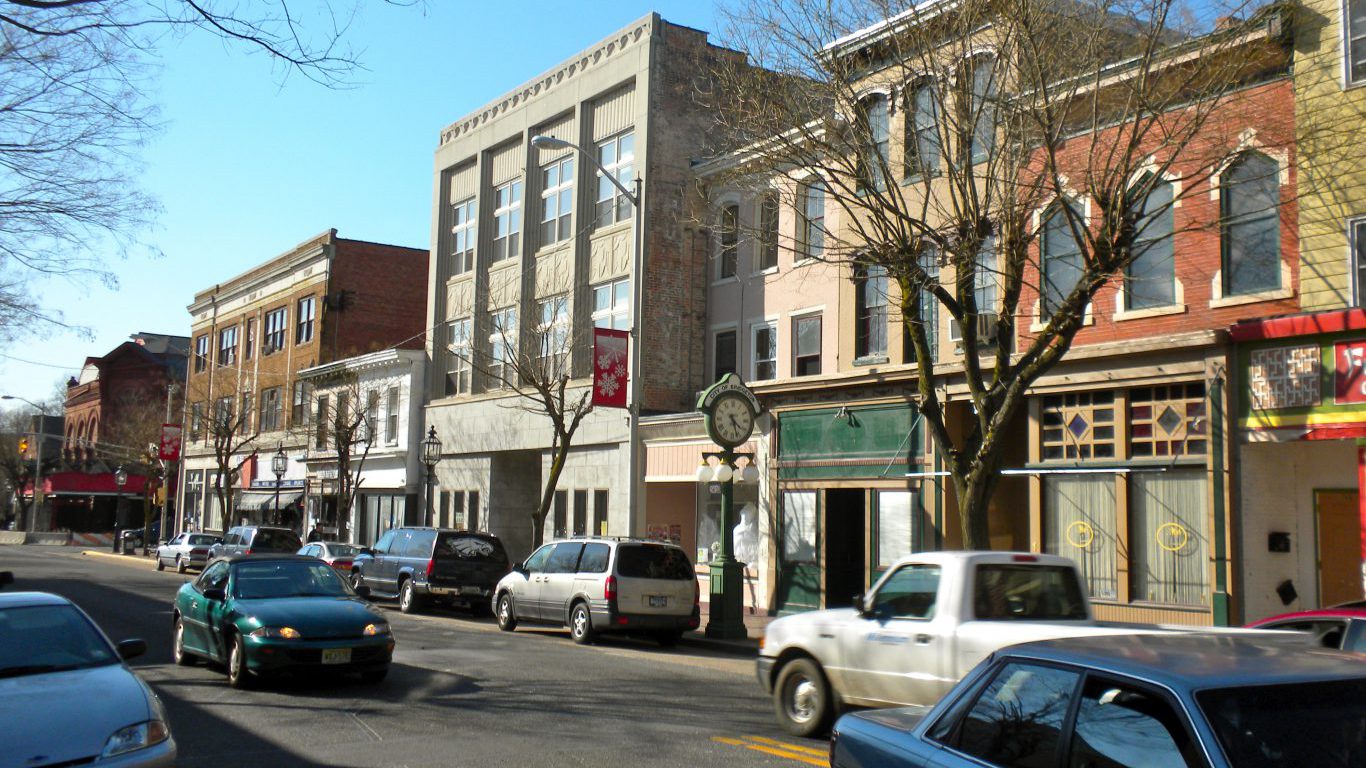
New Jersey: Bridgeton
> Population: 24,540
> Median home value: $109,200 (state: $335,600)
> Poverty rate: 31.2% (state: 10.0%)
> 5-yr. avg. unemployment: 6.9% (state: 5.5%)
The southern New Jersey city of Bridgeton ranks as the worst place to live in the state. Cumberland County, where Bridgeton is located, has been hit especially hard by the opioid epidemic. There are 63.2 accidental drug overdose deaths for every 100,000 residents annually, nearly three times the U.S. overdose fatality rate of 22.5 per 100,000.
Public health issues like risky substance use are often more common in areas with limited economic opportunity, and in Bridgeton, 31.2% of the population live below the poverty line, well above New Jersey’s 10.0% poverty rate.
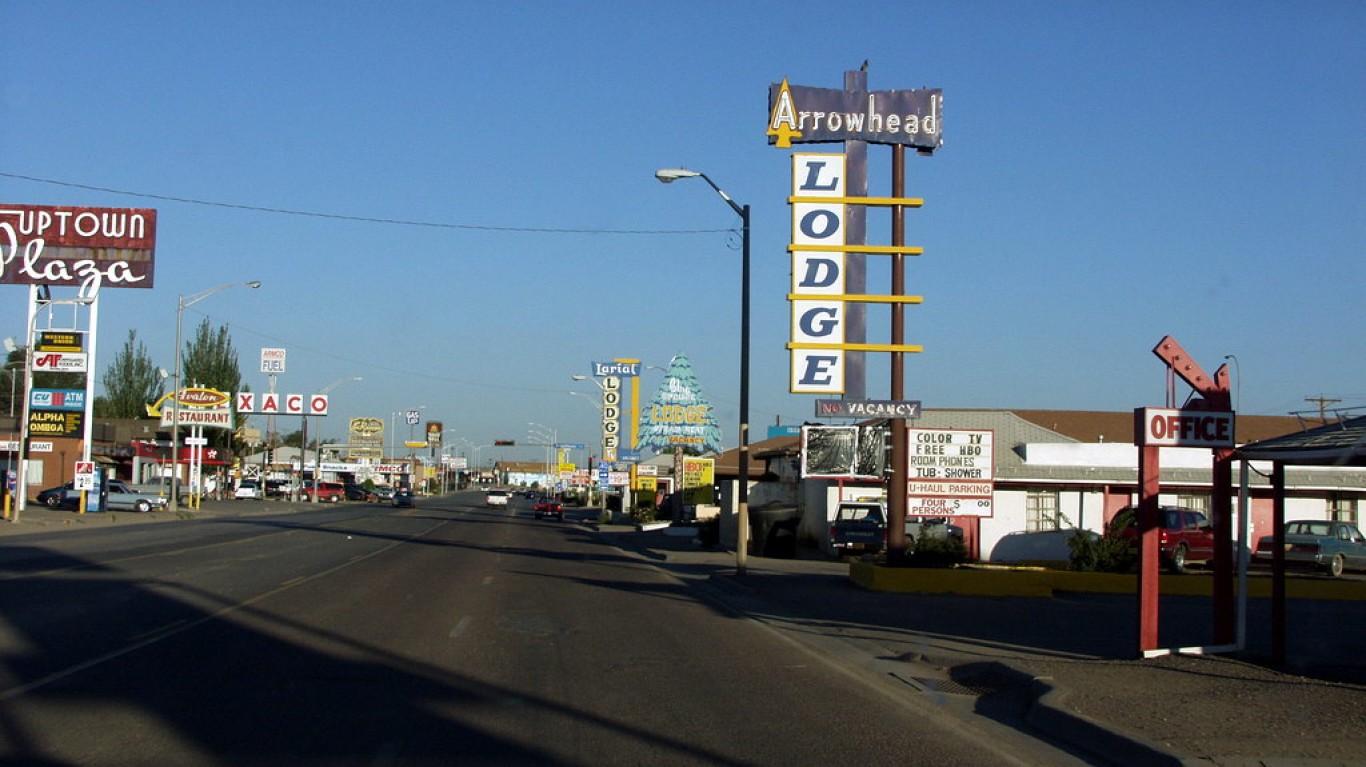
New Mexico: Gallup
> Population: 21,854
> Median home value: $132,000 (state: $171,400)
> Poverty rate: 28.4% (state: 19.1%)
> 5-yr. avg. unemployment: 7.4% (state: 6.6%)
Gallup, New Mexico ranks as the worst place to live in the state due in part to limited access to key amenities. For example, over 60% of Gallup’s nearly 22,000 residents have limited access to fresh, healthy food — meaning those living in urban areas are over a mile away from a grocery store, and those in rural areas are over 10 miles away. Additionally, Residents of McKinley County, where Gallup is located, have relatively limited access to public spaces for recreation and exercise. An estimated 43.3% of county residents have easy access to places like parks and recreation centers, compared to 84.2% of all Americans.
Gallup is also a dangerous place. There were 1,992 violent crimes for every 100,000 people in the city in 2019, more than five times the national violent crime rate of 367 per 100,000 that year.
[in-text-ad]
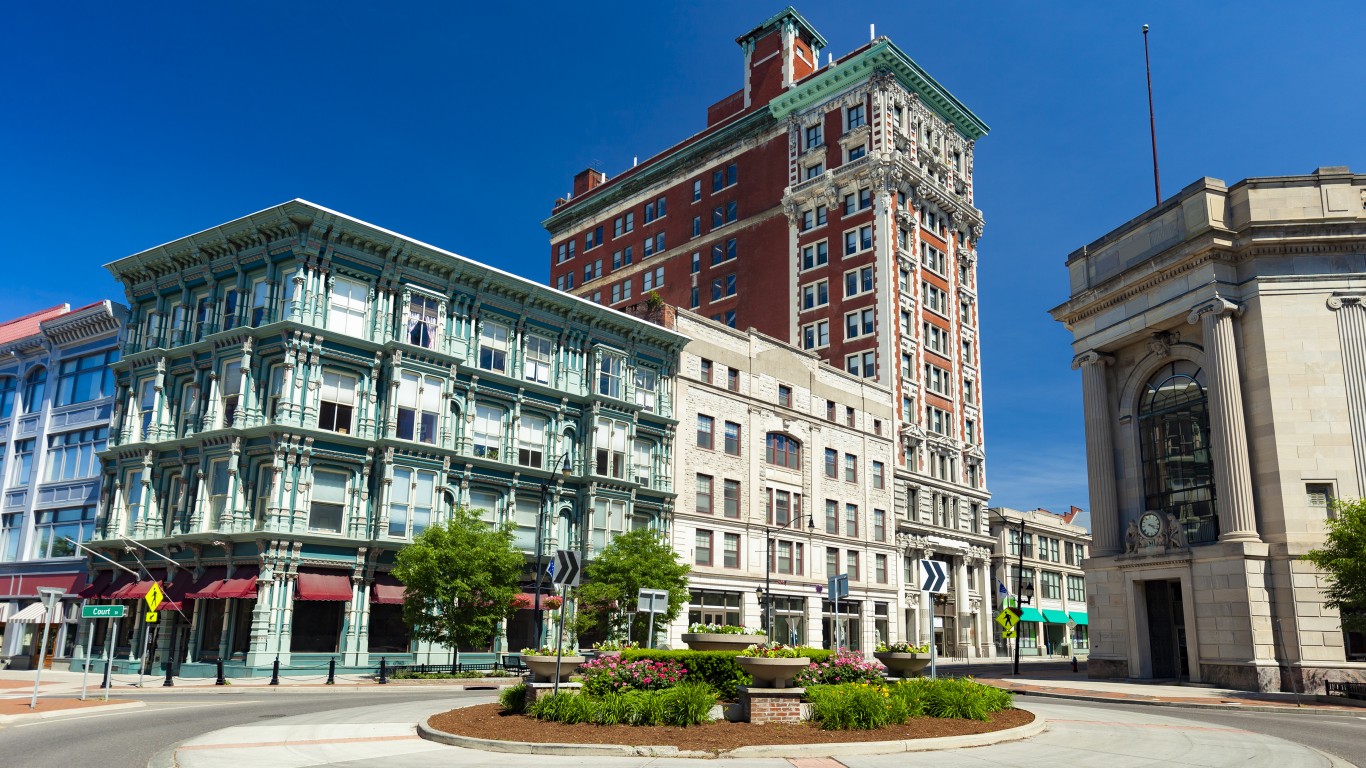
New York: Binghamton
> Population: 45,140
> Median home value: $91,000 (state: $313,700)
> Poverty rate: 32.6% (state: 14.1%)
> 5-yr. avg. unemployment: 10.4% (state: 5.4%)
Binghamton is a city of about 45,000 in the Southern Tier of New York state. The city ranks as the worst place to live in the state partially because, compared to the typical New Yorker, Binghamton residents are more than twice as likely to live below the poverty line and are nearly twice as likely to be unemployed.
Public health issues like risky substance use are often more common in areas with limited economic opportunity, and in Broome County, where Binghamton is located, there are 32.9 accidental drug overdose deaths for every 100,000 people annually, nearly the most in the state and well above the 22.5 per 100,000 national drug fatality rate.
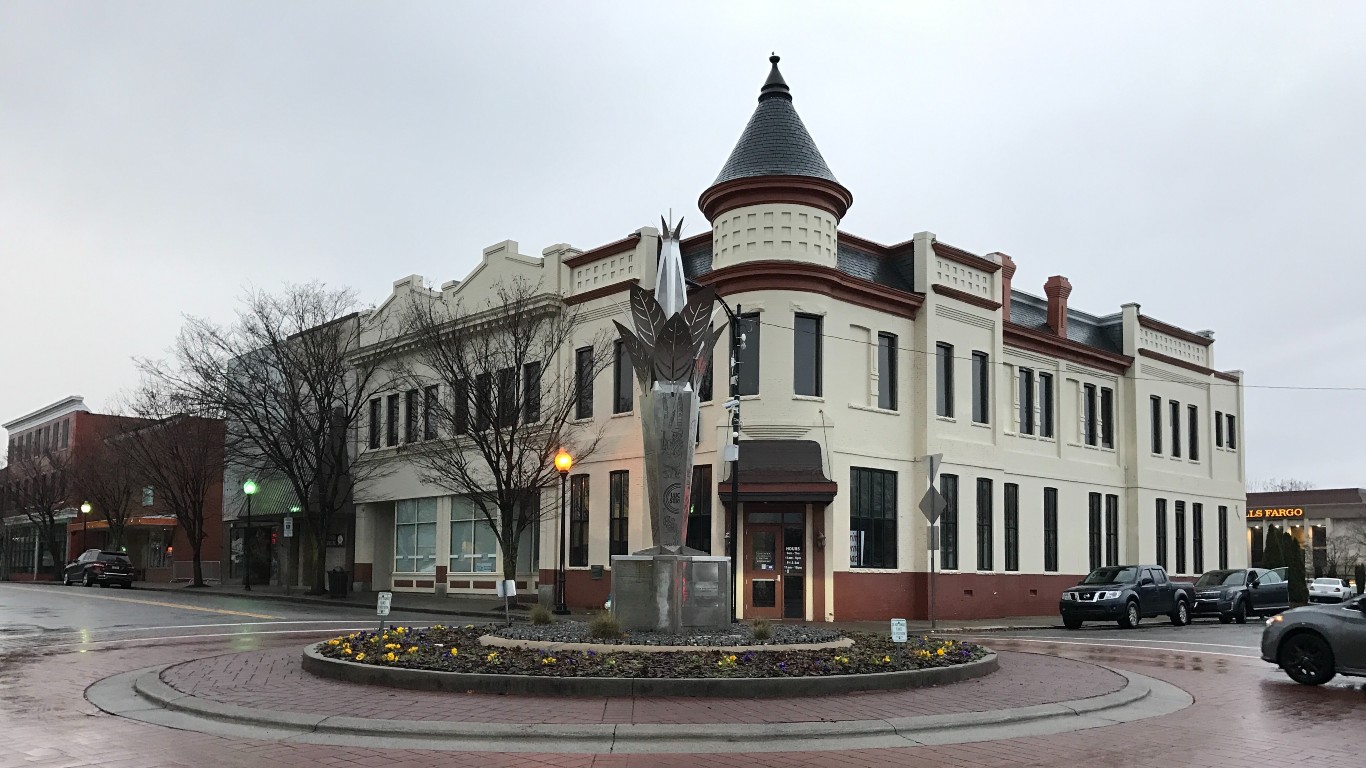
North Carolina: Reidsville
> Population: 13,915
> Median home value: $103,500 (state: $172,500)
> Poverty rate: 24.3% (state: 14.7%)
> 5-yr. avg. unemployment: 9.5% (state: 5.5%)
Reidsville, North Carolina, is a small city of about 14,000 people in the northern part of the state. It ranks as the worst place to live in North Carolina due in part to its high violent crime rate, which, at 752 incidents per 100,000 people is more than double the 367 per 100,000 national rate.
Limited access to key amenities also reduces quality of life in the city. More than one in every five Reidsville residents have limited access to fresh, healthy food — meaning those living in urban areas are over a mile from a grocery store, and those in rural areas are over 10 miles. Additionally, in Rockingham County, where Reidsville is located, residents have relatively limited access to public spaces for recreation and exercise. An estimated 65.4% county residents have easy access to places like parks and recreation centers, compared to 84.2% of all Americans.
North Dakota: Jamestown
> Population: 15,289
> Median home value: $144,800 (state: $193,900)
> Poverty rate: 14.7% (state: 10.7%)
> 5-yr. avg. unemployment: 3.2% (state: 2.7%)
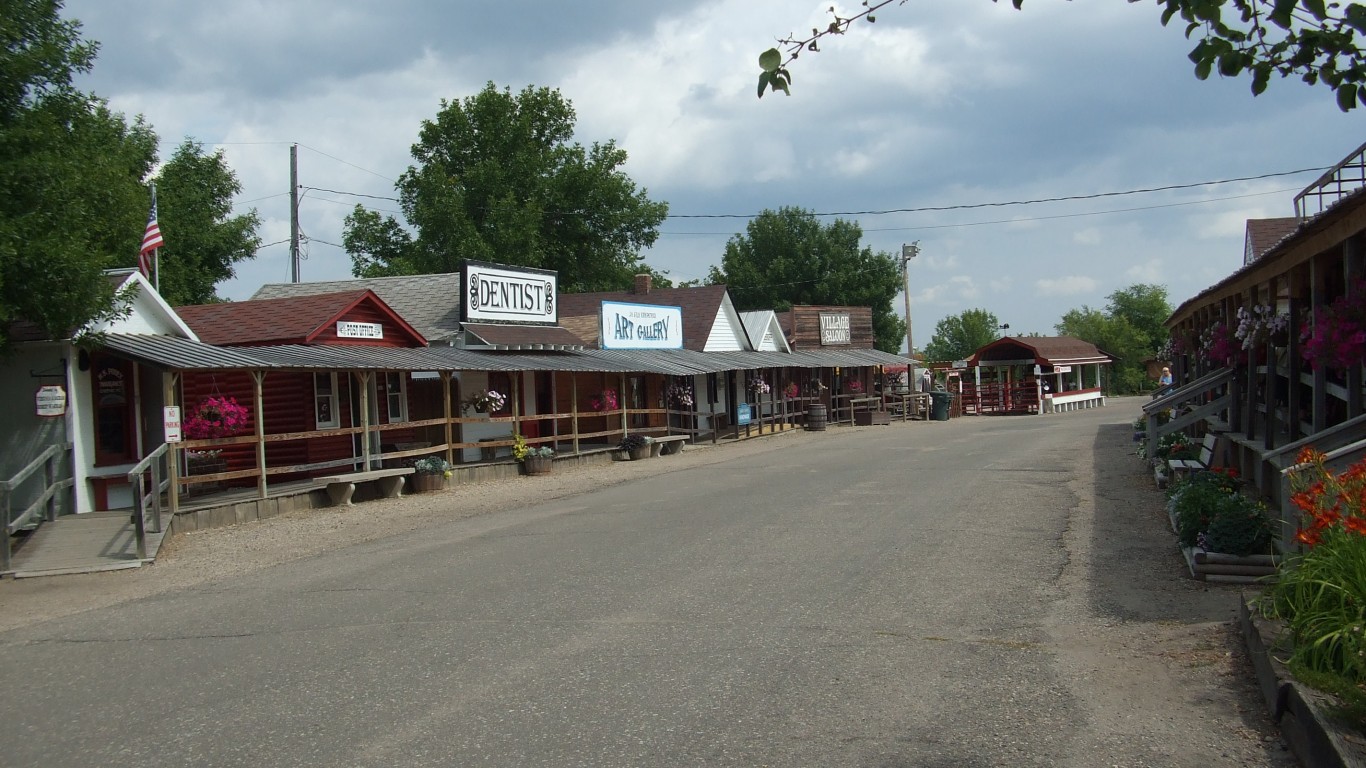
Of the nine cities in North Dakota with sufficient data, Jamestown, located in the eastern half of the state, ranks as the worst place to live. Over the last five years, the number employed Jamestown residents fell by 4.4%. Meanwhile, every other city in the state added jobs over the same period. Perhaps due in part to reduced job opportunities, the local poverty rate of 14.7% is higher than the 10.7% state poverty rate, and labor force participants in Jamestown are more likely to be out of work than their workers across the state as a whole.
Home values can be indicative of an area’s desirability as a place to live, and in Jamestown, the typical home is worth $144,800, the lowest of any city in the state and well below the $193,900 median home value across the state as a whole.
[in-text-ad-2]
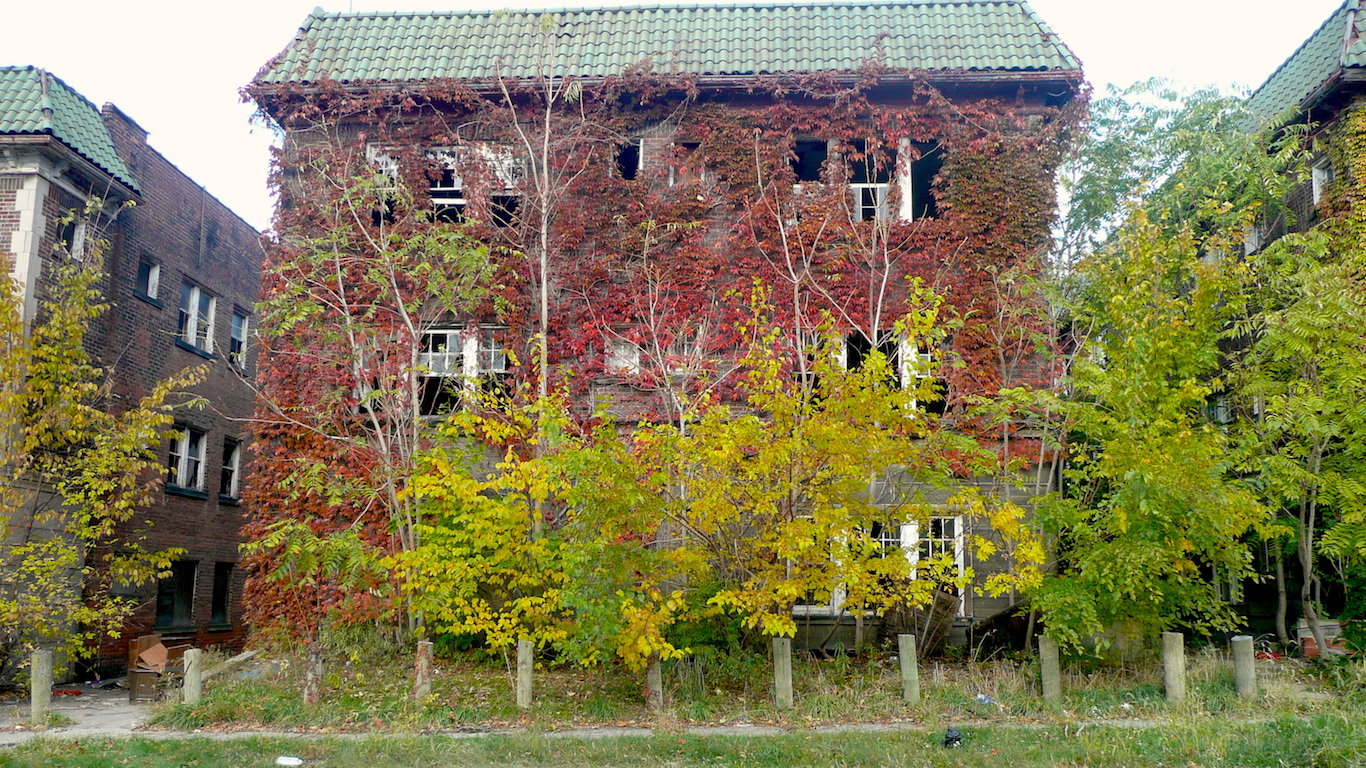
Ohio: East Cleveland
> Population: 17,200
> Median home value: $58,100 (state: $145,700)
> Poverty rate: 37.5% (state: 14.0%)
> 5-yr. avg. unemployment: 18.8% (state: 5.3%)
East Cleveland, Ohio, ranks as the worst place to live in the state largely because of the share of local residents struggling financially. Most households in the city earn less than $21,000 a year, and nearly one in every four earn less than $10,000 a year. The local poverty rate of 37.5% is more than double the 14.0% state poverty rate.
The area’s widespread poverty is partially attributable to a lack of economic opportunity. Only 33.2% of the population in East Cleveland are employed, compared to 47.7% of all Americans. Additionally, over the last five years, an average of 18.8% of the local labor force have been unemployed, more than triple the five-year average jobless rate across Ohio.
Oklahoma: McAlester
> Population: 18,045
> Median home value: $101,600 (state: $136,800)
> Poverty rate: 19.5% (state: 15.7%)
> 5-yr. avg. unemployment: 6.9% (state: 5.0%)
McAlester is a small city in eastern Oklahoma. The worst place to live in the state, McAlester’s population contracted by 1.7% over the last five years. High crime may be driving many residents away. There were 5,824 property crimes and 555 violent crimes per 100,000 people in 2019, well above the national rates of 2,110 and 367 per 100,000, respectively.
Economic conditions in McAlester are also worse than in much of the state. Residents are slightly more likely to be unemployed and live below the poverty line than the typical Oklahoma resident.
[in-text-ad]
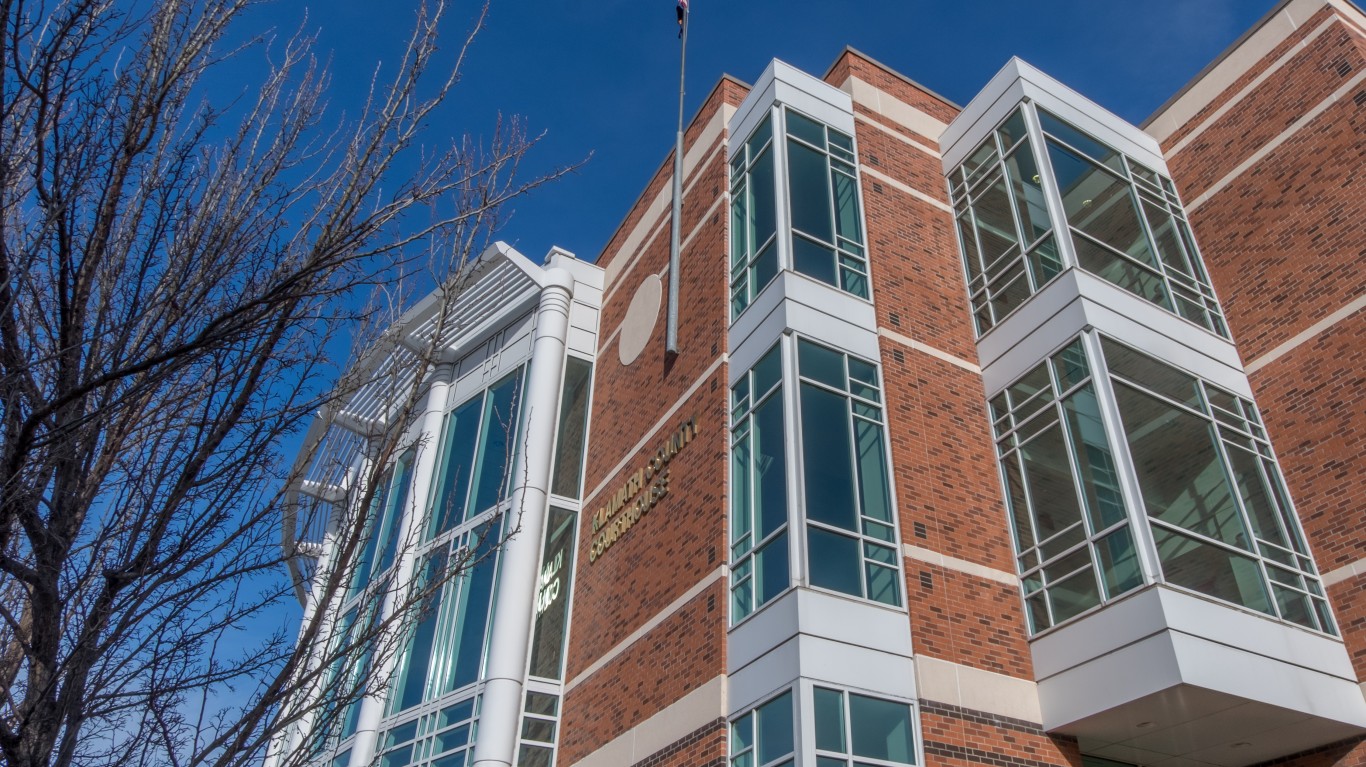
Oregon: Klamath Falls
> Population: 21,335
> Median home value: $159,500 (state: $312,200)
> Poverty rate: 22.7% (state: 13.2%)
> 5-yr. avg. unemployment: 9.3% (state: 5.5%)
Klamath Falls, Oregon, ranks as the worst place to live in the state partially because of high crime rates. There were 3,301 property crimes and 468 violent crimes per 100,000 people in the city in 2019, well above the national rates of 2,110 and 367 per 100,000, respectively. Crime can discourage investment and result in reduced economic opportunity — and in Klamath Falls, the five-year average unemployment rate of 9.3% is considerably higher than the comparable 5.5% state rate.
For those who are working in Klamath Falls, incomes are relatively low. The typical area household earns just $41,444 a year, far less than the state and national median incomes, which are each about $62,800.
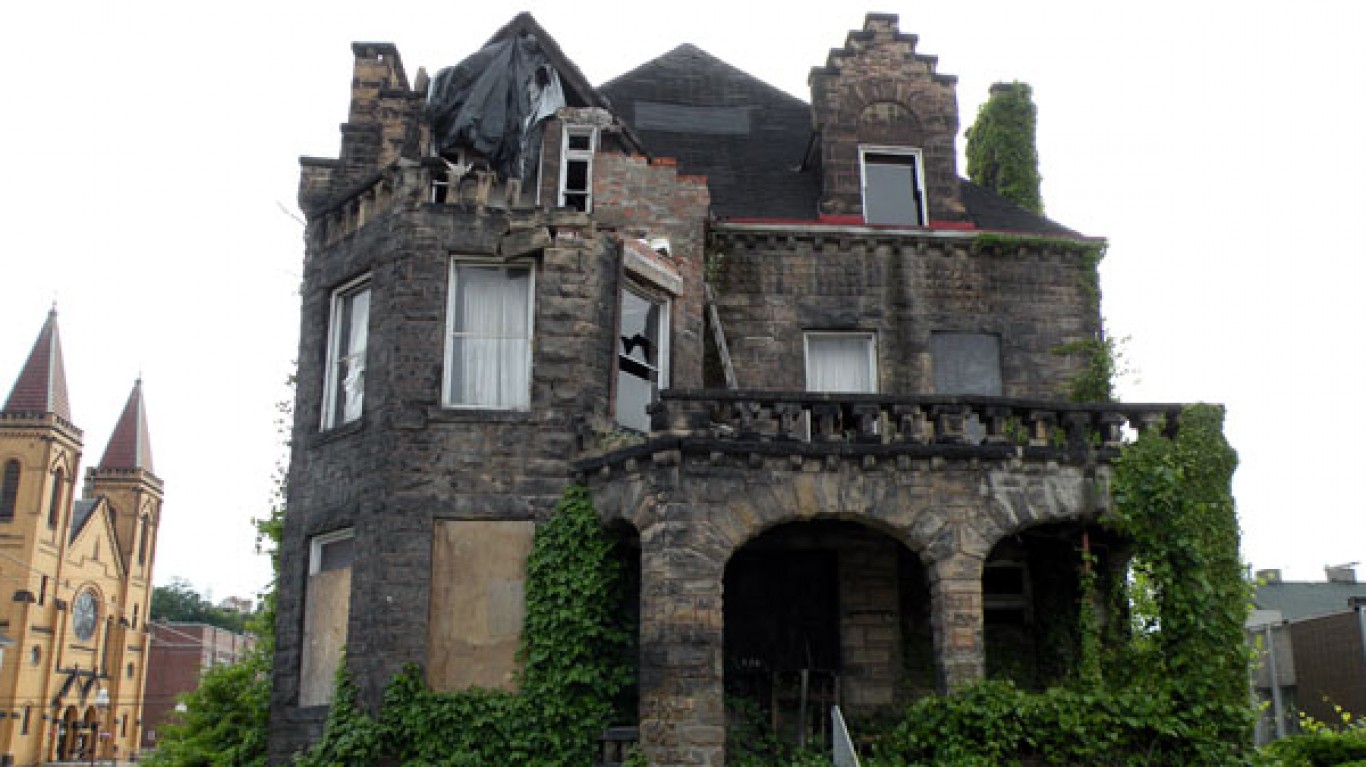
Pennsylvania: McKeesport
> Population: 19,225
> Median home value: $48,000 (state: $180,200)
> Poverty rate: 31.4% (state: 12.4%)
> 5-yr. avg. unemployment: 12.1% (state: 5.3%)
The small Pittsburgh suburb of McKeesport ranks as the worst place to live in Pennsylvania. Over the last five years, McKeesport reported a 2.2% population decline. Limited economic opportunity may be pushing residents out. Most households in McKeesport earn less than $30,000 a year, and nearly 15% of local households earn less than $10,000 annually.
An improved job market would likely reduce financial hardship in McKeesport, as the five-year average unemployment rate in the city of 12.1% is more than double the comparable 5.3% state rate. However, a high concentration of serious crime may be hampering economic development. There were 1,531 violent crimes reported for every 100,000 people in McKeesport in 2019, well above the 367 per 100,000 U.S. violent crime rate.
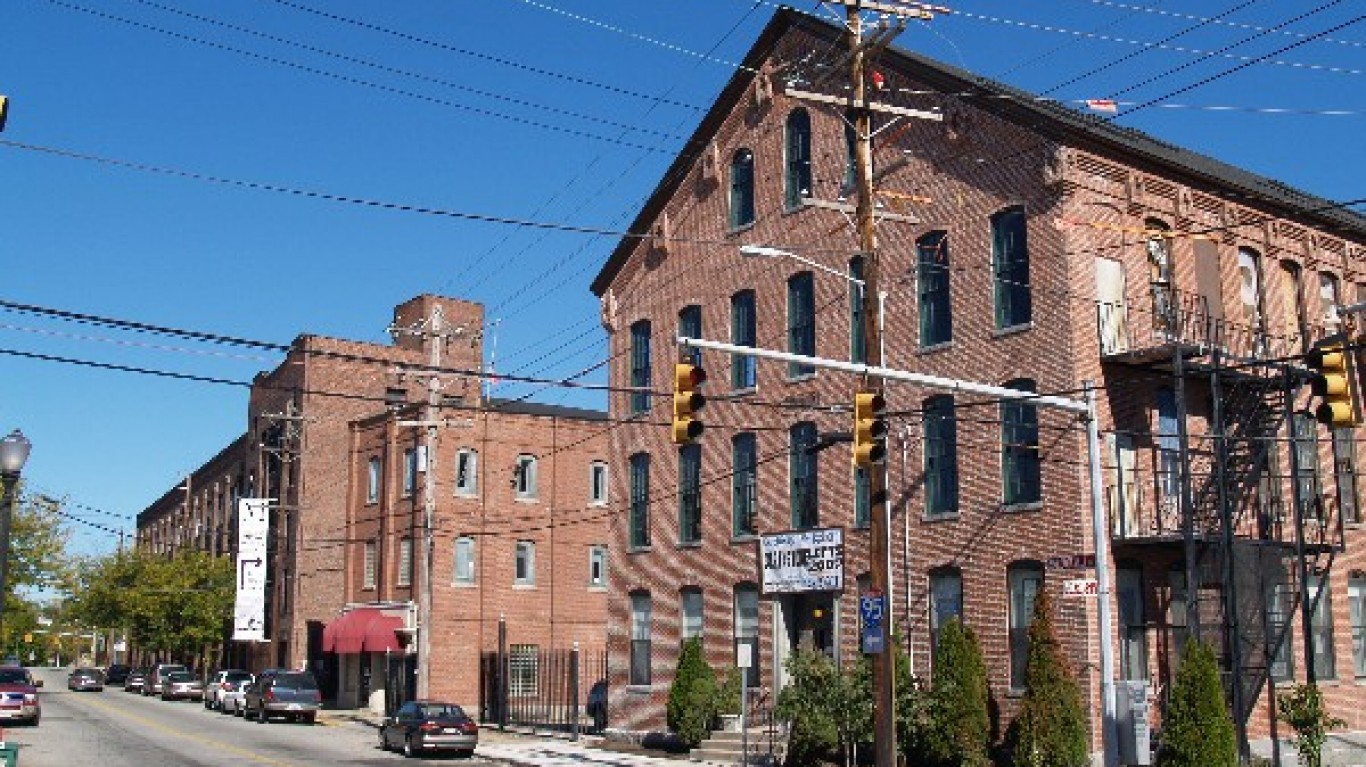
Rhode Island: Central Falls
> Population: 19,429
> Median home value: $159,100 (state: $261,900)
> Poverty rate: 30.2% (state: 12.4%)
> 5-yr. avg. unemployment: 6.8% (state: 5.4%)
Of the 14 Rhode Island cities and towns with sufficient data, Central Falls ranks as the worst place to live. Central Falls residents are more than twice as likely as the typical Rhode Islander to live below the poverty line. Partially as a result, a far larger than average share of city residents depend on government assistance to afford basic necessities. An estimated 39.6% of area households rely on SNAP benefits, by far the largest share in the state and more than triple the national SNAP recipiency rate of 11.7%.
Homeownership is one of the most practical ways to build wealth in the United States, and in Central Falls, the homeownership rate is only 20.2%, less than one-third of the 64.0% national rate. For many Central Falls residents, buying a home is prohibitively expensive. The median home value in the area is $159,100, 4.8 times higher than the median household income of $32,982. Meanwhile, the national home value-to-income ratio is just 3.5.
[in-text-ad-2]
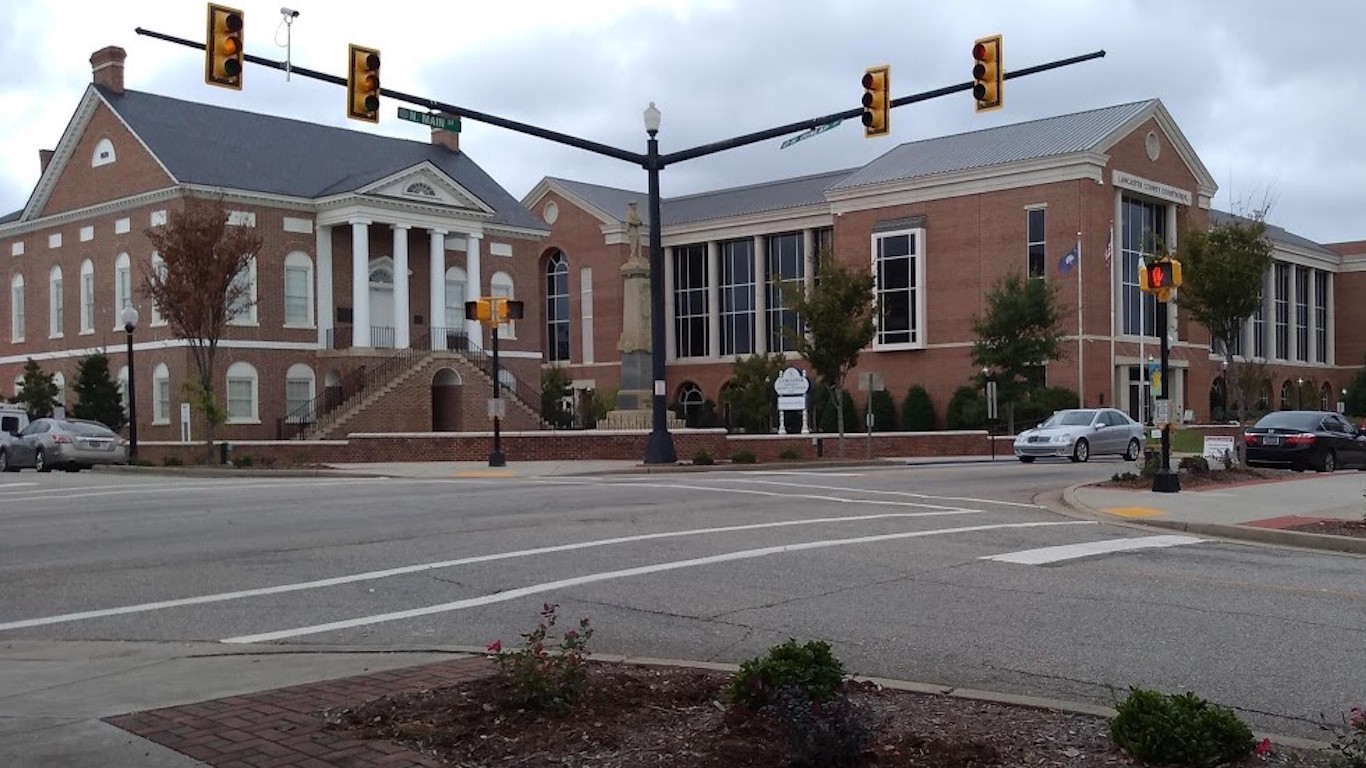
South Carolina: Lancaster
> Population: 9,143
> Median home value: $141,600 (state: $162,300)
> Poverty rate: 35.3% (state: 15.2%)
> 5-yr. avg. unemployment: 18.0% (state: 5.7%)
Lancaster, South Carolina, ranks as the worst place to live in the state largely because of widespread financial hardship. An estimated 35.3% of local residents live below the poverty line, and the local five-year average unemployment rate is 18.0% — each well above the respective state rates of 15.2% and 5.7%.
Homeownership is one of the most practical ways to build wealth in the United States, and in Lancaster, the homeownership rate is only 44.2%, less than the 64.0% national rate. For many Lancaster residents, buying a home is prohibitively expensive. The median home value in the area is $141,600, 4.7 times higher than the median household income of $30,122. Meanwhile, the typical American home is worth just 3.5 times more than the median income.
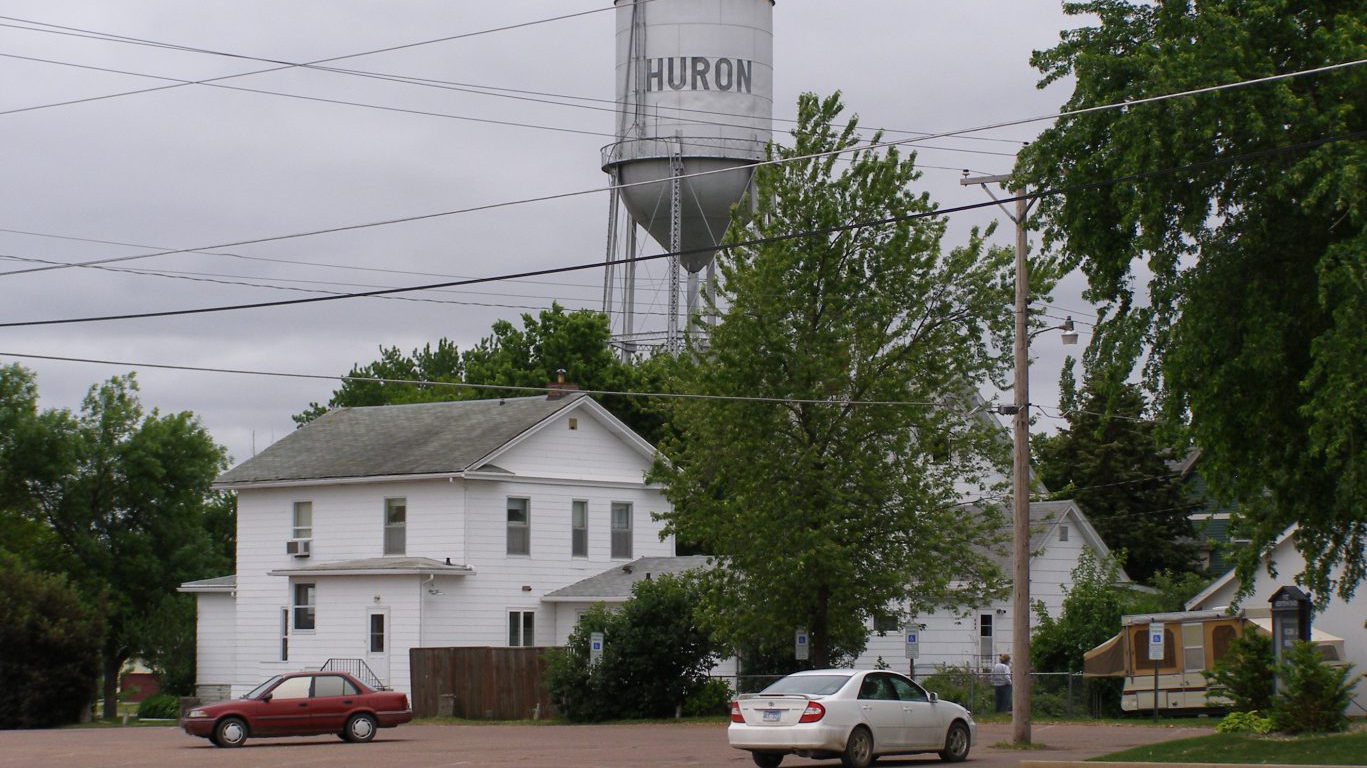
South Dakota: Huron
> Population: 13,282
> Median home value: $91,900 (state: $167,100)
> Poverty rate: 19.7% (state: 13.1%)
> 5-yr. avg. unemployment: 1.6% (state: 3.4%)
Huron, South Dakota, is a small city in the eastern half of the state. It ranks as the worst place to live in South Dakota largely because of economic conditions. Nearly one in every five Huron residents live below the poverty line compared to 13.1% of state residents.
Home values can be indicative of an area’s desirability as a place to live. In Huron, the typical home is worth just $91,900. The median home value in South Dakota is $167,100, and the typical home U.S. home is worth $217,500.
[in-text-ad]

Tennessee: Memphis
> Population: 651,932
> Median home value: $101,800 (state: $167,200)
> Poverty rate: 25.1% (state: 15.2%)
> 5-yr. avg. unemployment: 8.7% (state: 5.2%)
Memphis, the worst place to live in Tennessee, is one of the most dangerous large cities in the United States. There were 1,901 violent crimes for every 100,000 people in the city in 2019, five times the U.S. violent crime rate of 367 incidents per 100,000 that year. As is often the case in dangerous cities, economic opportunity is limited in Memphis. The local poverty rate of 25.1% is well above the 15.2% rate across Tennessee.
Greater job availability would likely go a long way toward reducing financial hardship in the area. Over the last five years, an average of 8.7% of the local labor force were unemployed, compared to the 5.2% five-year statewide average.
Texas: Robstown
> Population: 11,400
> Median home value: $64,000 (state: $172,500)
> Poverty rate: 38.4% (state: 14.7%)
> 5-yr. avg. unemployment: 15.4% (state: 5.0%)
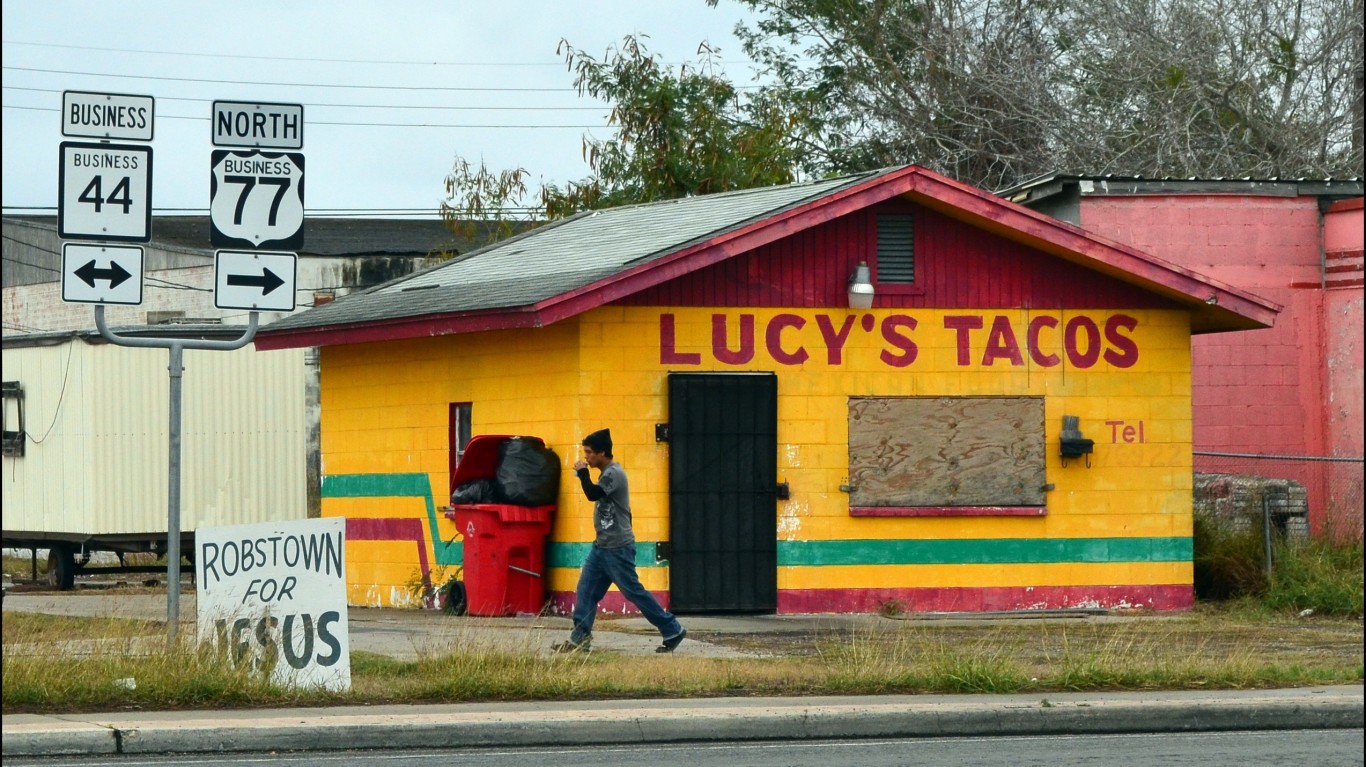
Robstown, a small city in southeast Texas, ranks as the worst place to live in the state. Over the last five years, Robstown reported a 1.7% population decline. Limited economic opportunity may be pushing residents out. Most city households earn less than $36,000 a year, and over 16% of local households earn less than $10,000 annually. The local poverty rate of 38.4% is the highest in the state and more than double Texas’ 14.7% poverty rate.
Because of the widespread financial hardship in Robstown, a larger share of residents depend on government assistance to afford basic necessities. An estimated 36.2% of area households rely on SNAP benefits, more than triple the national SNAP recipiency rate of 11.7%.
Utah: Price
> Population: 8,265
> Median home value: $144,700 (state: $279,100)
> Poverty rate: 21.9% (state: 9.8%)
> 5-yr. avg. unemployment: 7.7% (state: 3.6%)
Utah is one of the fastest growing states in the country. Price, a small city in central Utah, ranks as the worst place to live in the state. The city is one of the few in Utah to report recent population decline. Over the last five years, Price’s population contracted by 3.7%. Price is also shedding jobs as total employment in the area fell by 6.8% over the same period.
Financial hardship is one reason people may be leaving Price. It is the only city or town in the state with sufficient data where more than one in every 10 households earn less than $10,000 a year. Substance misuse tends to be more common in places with limited economic opportunity, and across Carbon County, where Price is located, there are 44.6 accidental drug overdose deaths for every 100,000 people annually, the most of any county in Utah and nearly double the 22.5 per 100,000 national rate.
[in-text-ad-2]
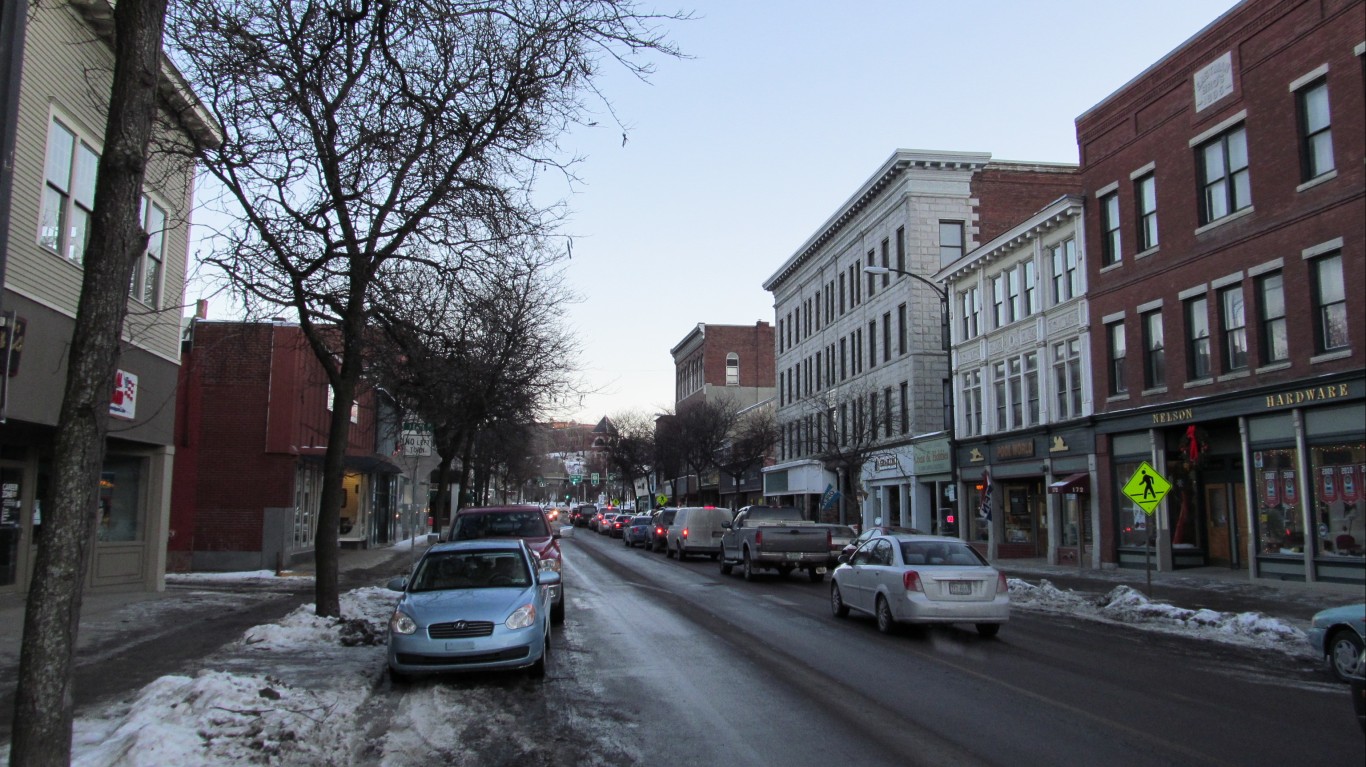
Vermont: Barre
> Population: 8,646
> Median home value: $158,300 (state: $227,700)
> Poverty rate: 22.8% (state: 10.9%)
> 5-yr. avg. unemployment: 7.4% (state: 3.6%)
Of the half dozen cities and towns in Vermont with sufficient data, Barre ranks as the worst place to live. The five-year average unemployment rate in Barre of 7.4% is by far the highest of any city or town in the state, and has likely driven up the poverty rate, which at 22.8%, is more than double Vermont’s 10.9% poverty rate. Poverty and limited economic opportunities mean that a relatively large share of Barre residents rely on government assistance to afford basic necessities. Barre is the only city or town in the state where more than one in every four households receive SNAP benefits.
Crime is more of a problem in Barre than it is elsewhere in Vermont. There were 748 violent crimes for every 100,000 people in the city in 2019, the most of any city or town in that and more than double the 367 per 100,000 national rate that year.
Virginia: Petersburg
> Population: 31,362
> Median home value: $108,100 (state: $273,100)
> Poverty rate: 24.1% (state: 10.6%)
> 5-yr. avg. unemployment: 11.7% (state: 4.5%)
Petersburg, a city of about 31,000 in southeastern Virginia, is the worst place to live in the state. Petersburg residents are more than twice as likely as the typical Virginian to be unemployed and live below the poverty line. Dangerous substance misuse is often more common in economically disadvantaged areas, and in Petersburg, there are 45.9 accidental drug overdose deaths for every 100,000 people annually, well above the 22.5 per 100,000 national average.
Due in part to a near-nation leading murder rate — 12 times higher than the national average — Petersburg is also a relatively dangerous city. There were 748 violent crimes for every 100,000 people in the city in 2019, more than double the 367 per 100,000 national rate that year.
[in-text-ad]
Washington: Tukwila
> Population: 20,196
> Median home value: $315,000 (state: $339,000)
> Poverty rate: 17.2% (state: 10.8%)
> 5-yr. avg. unemployment: 7.6% (state: 4.9%)
Tukwila, Washington, ranks as the worst place to live in the state, largely because of how unaffordable it is for so many of its residents. The typical home in the city is worth $315,000, 5.4 times higher than the local median household income of $58,097. Nationwide, the typical home is worth 3.5 times more than the median income. Likely partially as a result, the local homeownership rate is just 36.6%, well below the 64.0% national rate.
Tukwila is also a relatively dangerous place. There were 773 violent crimes for every 100,000 people in the city in 2019, more than double the 367 per 100,000 national rate that year.

West Virginia: Huntington
> Population: 46,667
> Median home value: $98,200 (state: $119,600)
> Poverty rate: 32.3% (state: 17.6%)
> 5-yr. avg. unemployment: 6.8% (state: 6.5%)
Huntington, located in western West Virginia along the Ohio border, ranks as the worst place to live in the state. Huntington is the seat of Cabell County, which is the epicenter of the opioid epidemic nationwide. There are 155.4 accidental drug overdose deaths for every 100,000 people in Cabell County annually, the most of any U.S. county and nearly seven times the 22.5 per 100,000 national drug fatality rate.
Like many parts of the country struggling with substance misuse, many in Huntington are struggling financially. Nearly one out of every three of the city’s 46,700 residents live below the poverty line, and 22.1% of households rely on government assistance in the form of SNAP benefits to afford basic necessities.
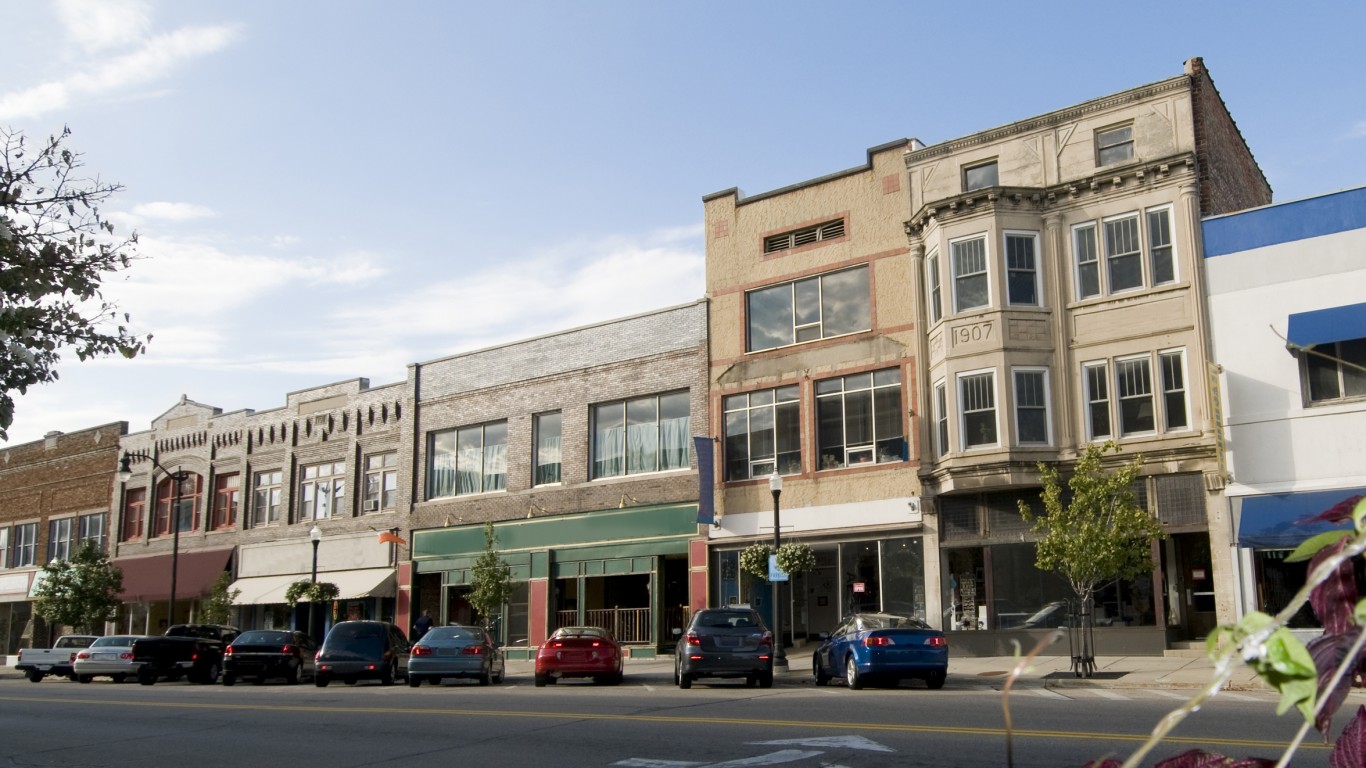
Wisconsin: Beloit
> Population: 36,836
> Median home value: $89,900 (state: $180,600)
> Poverty rate: 23.1% (state: 11.3%)
> 5-yr. avg. unemployment: 8.8% (state: 3.6%)
Beloit is a city of about 37,000 in southern Wisconsin along the Illinois border and ranks as the worst place to live in the state. Beloit residents are more than twice as likely as the typical Wisconsin resident to be unemployed and live below the poverty line.
Beloit residents also have relatively limited access to key amenities. For example, nearly 30% of area residents have limited access to fresh, healthy food — meaning those living in urban areas are over a mile away from a grocery store, and those in rural areas are over 10 miles away.
[in-text-ad-2]
Wyoming: Rawlins
> Population: 8,820
> Median home value: $171,700 (state: $220,500)
> Poverty rate: 11.0% (state: 11.0%)
> 5-yr. avg. unemployment: 5.3% (state: 4.4%)
Of the dozen cities and towns in Wyoming with sufficient data, Rawlongs ranks as the worst place to live. The city, located in the south-central part of the state, has reported a 4.1% population decline over the last five years. The city is also shedding jobs as total employment in the area fell by 12.5% over the same period.
Rawlins residents also have relatively limited access to key amenities. For example, over half of area residents have limited access to fresh, healthy food — meaning those living in urban areas are over a mile away from a grocery store, and those in rural areas are over 10 miles away.
Methodology
To identify the worst cities to live in, 24/7 Wall St. created a weighted index of 24 measures across four categories: affordability, economy, quality of life, and community.
1.) The affordability category consists of two measures:
- The ratio of median home value to median household income, at one-fourth weight.
- Median property taxes paid as a percentage of median home value, at one-fourth weight.
2.) The economy category consists of four measures:
- Median home value, at full weight.
- Employment growth from 2015 to 2019, at full weight.
- The ratio of the number of employed workers to the total population, at one-half weight.
- The unemployment rate, at full weight.
3.) The quality of life category consists of seven measures:
- The poverty rate, at full weight.
- The share of the population in urban census tracts at least 1 mile from a grocery store and in rural census tracts at least 10 miles from a grocery store, a measure of poor food access, at one-half weight.
- The distance from the city center to the nearest hospital, at one-fourth weight.
- The percentage of patients discharged from acute care hospitals who are readmitted to the hospital within 30 days, at one-fourth weight.
- The percentage of heart attack, coronary artery bypass grafting (CABG) surgery, chronic obstructive pulmonary disease (COPD), heart failure, pneumonia, and stroke patients who pass away within 30 days of treatment at a hospital, at full weight.
- The number of hospital admissions for conditions that could be treated in an outpatient setting per 1,000 Medicare enrollees — an indication of poor outpatient care and overuse of hospitals — at one-half weight.
- The number of drug-related fatalities per 100,000 residents, at full weight.
4.) The community category consists of 11 measures:
- The percentage of workers 16 and over commuting by public transit, walking, or other non-car means, at one-half weight.
- The average travel time to work, at one-fourth weight.
- The number of violent crimes — homicide, rape, robbery, and aggravated assault — reported per 100,000 residents, at full weight.
- The number of property crimes — burglary, larceny, motor vehicle theft, and arson — reported per 100,000 residents, at full weight.
- The number of movie theaters per 100,000 residents, at one-twentieth weight.
- The number of libraries and archives per 100,000 residents, at one-twentieth weight.
- The number of theater companies and dinner theaters per 100,000 residents, at one-twentieth weight.
- The number of museums per 100,000 residents, at one-twentieth weight.
- The number of nature parks and similar institutions per 100,000 residents, at one-twentieth weight.
- The number of alcoholic drinking places per 100,000 residents, at one-twentieth weight.
- The number of restaurants and other eating places per 100,000 residents, at one-twentieth weight.
Data on population, employment, unemployment, median home value, median household income, median property taxes paid, commuter characteristics, average travel time to work, and poverty came from the U.S. Census Bureau’s American Community Survey and are five-year estimates for the period 2014 to 2018. Employment data used to calculate five-year employment growth are five-year estimates for the years 2010 to 2014. Data on cost of living came from real estate analysis company ATTOM Data Solutions and is for the year 2014.
Data on the share of the population in urban census tracts at least 1 mile from a grocery store and in rural census tracts at least 10 miles from a grocery store, a measure of poor food access, came from the U.S. Department of Agriculture’s 2017 update to the Food Access Research Atlas and is at the county level.
Data on hospital locations came from the Centers for Medicare & Medicaid Services. Data on 30-day readmission rates and 30-day mortality rates also came from the CMS and are for the period July 2016 to June 2019. Data was aggregated to the city level for cities with at least one hospital and to the county level for cities with no hospitals. Data on the number of drug-related deaths per 100,000 residents per year for the period 2016 to 2018 is from the Centers for Disease Control and Prevention and is at the county level. Data on preventable hospitalizations per 1,000 Medicare enrollees came from the 2020 County Health Rankings and Roadmaps program, a collaboration between the Robert Wood Johnson Foundation and University of Wisconsin Population Health Institute, and is at the county level.
Data on the number of violent crimes and property crimes reported per 100,000 residents came from the FBI’s Uniform Crime Reporting Program and are for the year 2018.
County-level data on the number of movie theaters, libraries and archives, theater companies and dinner theaters, museums, nature parks and other similar institutions, alcoholic beverage drinking places, and restaurants and other eating places came from the Census Bureau’s 2018 County Business Patterns series.
To avoid geographic clustering, we only took the lowest-ranking city in a given county. Our list includes cities, towns, villages, boroughs, and census-designated places. We did not include places with fewer than 8,000 residents in our analysis. We also excluded places with more than 20% enrollment in college and graduate school as well as places where more than 20% of the population are employed in the armed forces, based on five-year data from the 2018 ACS.
Want to Retire Early? Start Here (Sponsor)
Want retirement to come a few years earlier than you’d planned? Or are you ready to retire now, but want an extra set of eyes on your finances?
Now you can speak with up to 3 financial experts in your area for FREE. By simply clicking here you can begin to match with financial professionals who can help you build your plan to retire early. And the best part? The first conversation with them is free.
Click here to match with up to 3 financial pros who would be excited to help you make financial decisions.
Have questions about retirement or personal finance? Email us at [email protected]!
By emailing your questions to 24/7 Wall St., you agree to have them published anonymously on a673b.bigscoots-temp.com.
By submitting your story, you understand and agree that we may use your story, or versions of it, in all media and platforms, including via third parties.
Thank you for reading! Have some feedback for us?
Contact the 24/7 Wall St. editorial team.
 24/7 Wall St.
 24/7 Wall St.
 24/7 Wall St.