Nationally, the share of adults who meet or exceed federal exercise guidelines is on the rise. The Department of Health and Human Services recommends adults ages 18-64 engage in at least 150 to 300 minutes a week of moderate exercise — about 20 to 40 minutes a day.
Over 53% of adult Americans met the exercise requirements in 2018, compared to nearly 52% in 2016 and 41.4% a decade earlier, according to the Centers for Disease Control and Prevention. While this is encouraging news, not all cities boast high exercise rates.
To determine the metropolitan area where residents are getting the least exercise, 24/7 Tempo reviewed data from the 2021 County Health Rankings on the percentage of adults who are physically active and the percentage of the population with access to a location appropriate for exercise.
About 22.7% of adult Americans report that they do not get any physical activity in their leisure time.
Five of the 10 cities with the lowest share of adults who exercise or engage in any physical activity in their free time are in Georgia. In fact, most of the cities with the lowest percentage of adults exercising are in the South.
Exercise has been shown to be a crucial factor in maintaining a healthy weight as it helps burn body fat and build muscle tissue. Physical activity is also linked to better overall quality of life as well as longer life. Some research shows that even just 15 minutes a day of physical activity provides benefits, including lowering the risk of heart disease, diabetes, and some common types of cancer.
Consistent lack of exercise appears to play a role in certain unhealthy outcomes. All but three of the 50 cities where adults get the least exercise, have an adult obesity rate that is higher than the national rate of 29.7%. All 50 cities on this list have a higher share of the adult population reporting being in poor or fair health than the U.S. share of 16.5%. These are the most obese places in America.
Income also appears to correlate with activity rates. All but one of the 50 cities where the lowest share of adults exercise have a median annual household income lower than the national median of nearly $66,000. Wealthier people are more likely to exercise as they generally have more time and money to spare on different activity options.
Click here to see the laziest cities in the U.S.
To determine the U.S. cities getting the least exercise, 24/7 Tempo reviewed data about adults who are physically active in all 382 metro areas in the United States. The measure came from the 2021 County Health Rankings & Roadmaps (CHR), a collaboration between the Robert Wood Johnson Foundation and the University of Wisconsin Population Health Institute.
Obesity rates — the share of adult residents who report a body mass index of 30 or greater — as well as the share of adults who have access to exercise facilities and the share of the population reporting to be in fair or poor health also came from the 2021 CHR. All CHR data is for the most recent year available.
The age-adjusted percentage of the total population 20 years and over diagnosed with diabetes in 2017, the latest year for which data is available, also came from the 2021 CHR. Diabetes age-adjusted rates were provided at the county level, which were then aggregated to the metropolitan level using a weighted average, based on the percentage of the 2019 5-year population of each county within each metro area.
Population figures, as well as median household income, and poverty rate came from the American Community Survey 2019 5-Year Estimates.
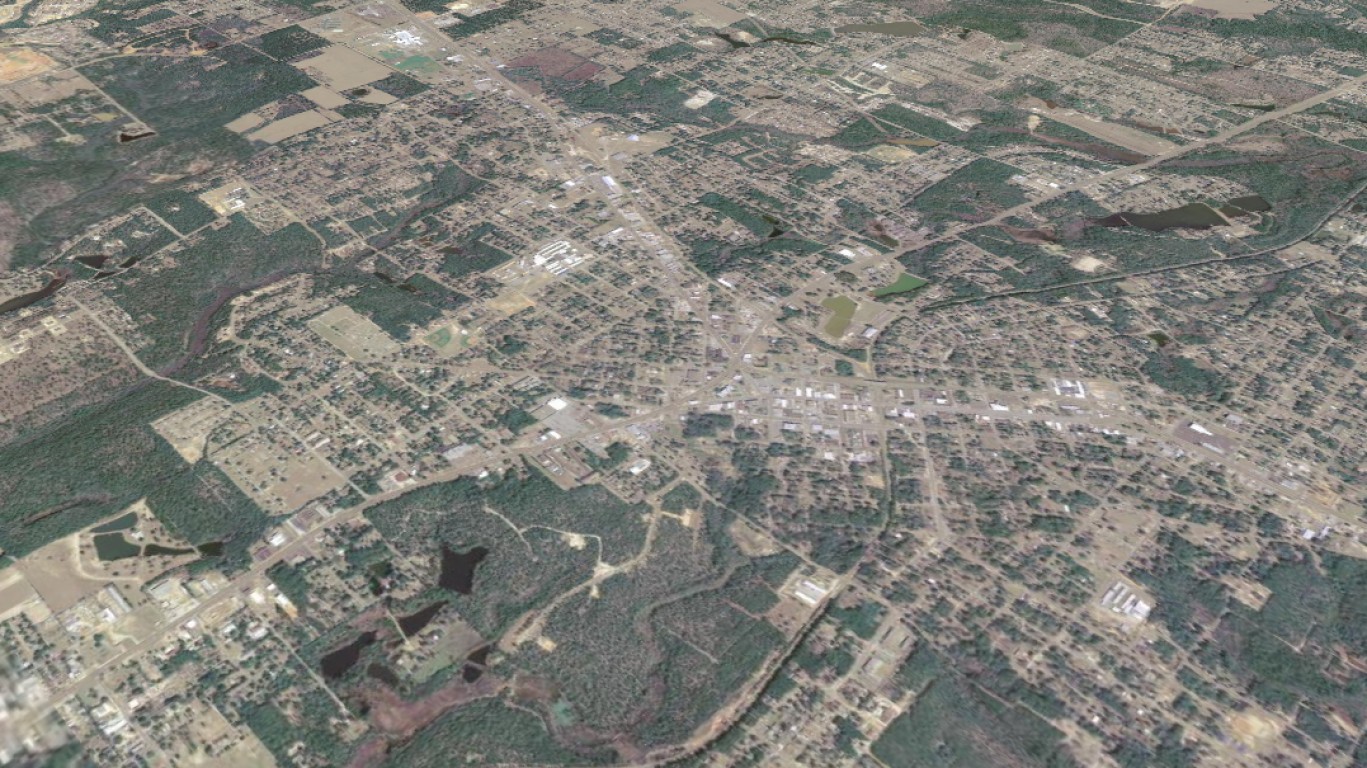
50. Crestview-Fort Walton Beach-Destin, Florida
> Adults who don’t exercise: 29.7% (US avg: 22.7%)
> Pop. with access to places for physical activity: 73.1% — #279 out of 382 (US avg: 84.2%)
> Adult obesity rate: 28.5% — #302 out of 382 (US avg: 29.7%)
> Pop. over 20 with diabetes: 11.8% — #145 out of 382 (US avg: 10.5%)
> Adults in poor or fair health: 17.8% — #222 out of 382 (US avg: 16.5%)
> Physically unhealthy days a month: 4.2 — #201 out of 382 (US avg: 3.7)
> Median household income: $62,627 — #131 out of 382 (US median: $65,712)
[in-text-ad]

49. Madera, California
> Adults who don’t exercise: 29.8% (US avg: 22.7%)
> Pop. with access to places for physical activity: 70.3% — #300 out of 382 (US avg: 84.2%)
> Adult obesity rate: 36.8% — #61 out of 382 (US avg: 29.7%)
> Pop. over 20 with diabetes: 12.1% — #127 out of 382 (US avg: 10.5%)
> Adults in poor or fair health: 25.7% — #14 out of 382 (US avg: 16.5%)
> Physically unhealthy days a month: 5.2 — #16 out of 382 (US avg: 3.7)
> Median household income: $64,827 — #113 out of 382 (US median: $65,712)
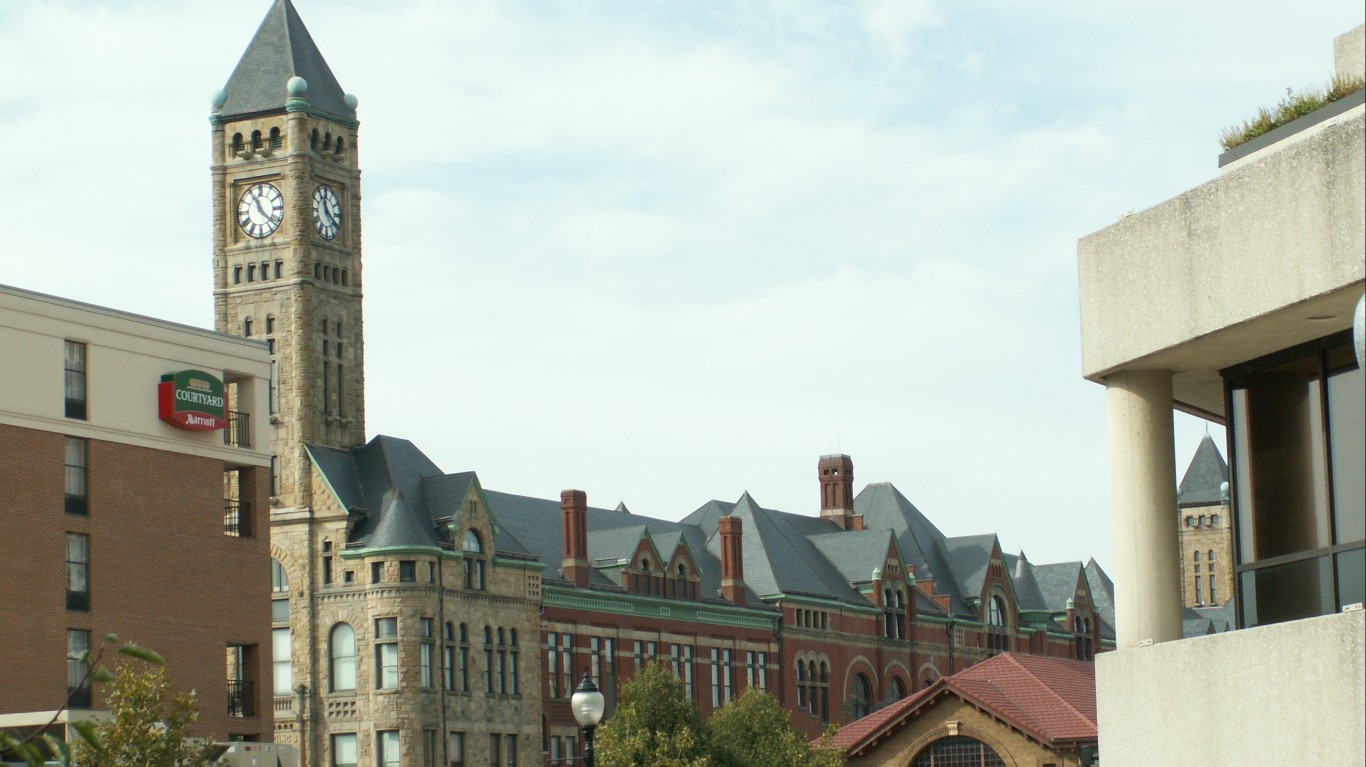
48. Springfield, Ohio
> Adults who don’t exercise: 29.9% (US avg: 22.7%)
> Pop. with access to places for physical activity: 86.4% — #111 out of 382 (US avg: 84.2%)
> Adult obesity rate: 37.0% — #55 out of 382 (US avg: 29.7%)
> Pop. over 20 with diabetes: 14.1% — #51 out of 382 (US avg: 10.5%)
> Adults in poor or fair health: 20.9% — #98 out of 382 (US avg: 16.5%)
> Physically unhealthy days a month: 4.8 — #44 out of 382 (US avg: 3.7)
> Median household income: $50,128 — #322 out of 382 (US median: $65,712)
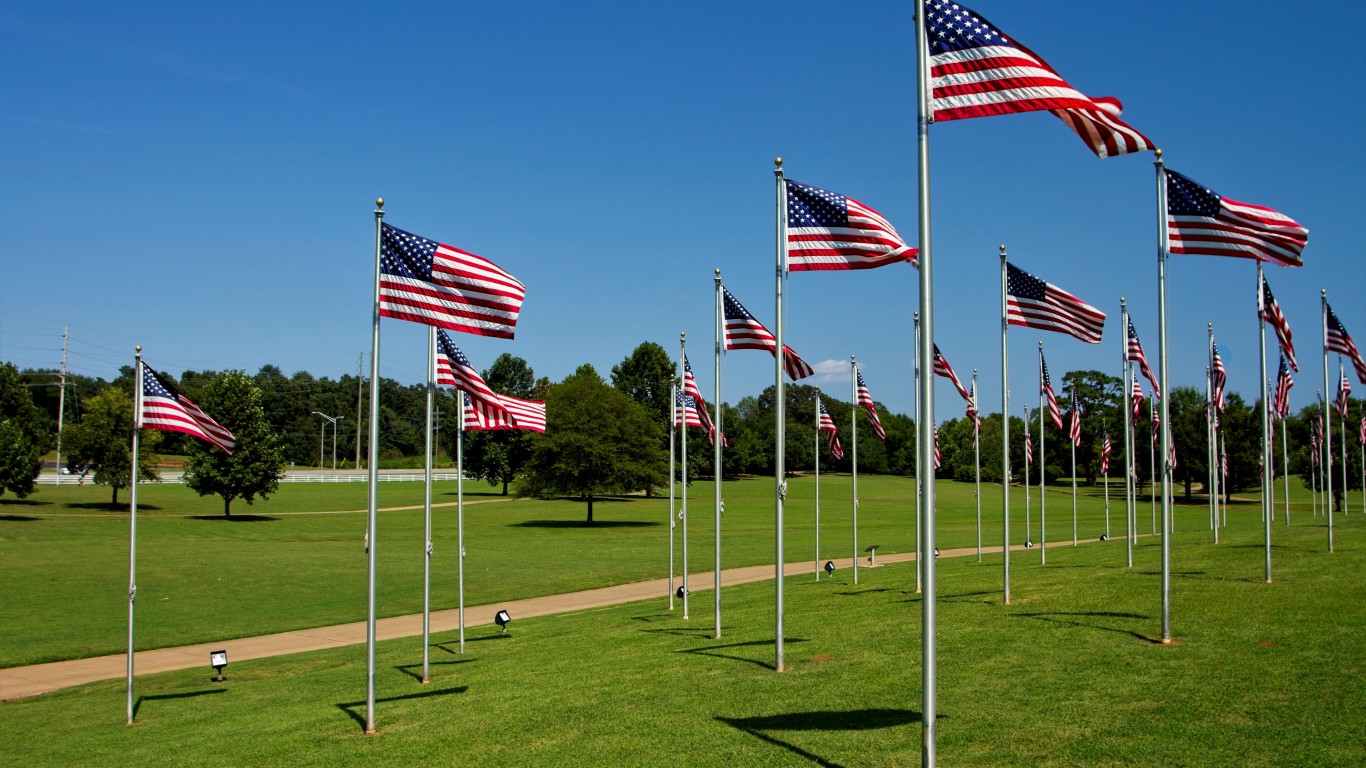
47. Florence-Muscle Shoals, Alabama
> Adults who don’t exercise: 30.0% (US avg: 22.7%)
> Pop. with access to places for physical activity: 61.9% — #353 out of 382 (US avg: 84.2%)
> Adult obesity rate: 34.1% — #128 out of 382 (US avg: 29.7%)
> Pop. over 20 with diabetes: 15.4% — #26 out of 382 (US avg: 10.5%)
> Adults in poor or fair health: 20.9% — #94 out of 382 (US avg: 16.5%)
> Physically unhealthy days a month: 4.5 — #105 out of 382 (US avg: 3.7)
> Median household income: $45,824 — #364 out of 382 (US median: $65,712)
[in-text-ad-2]
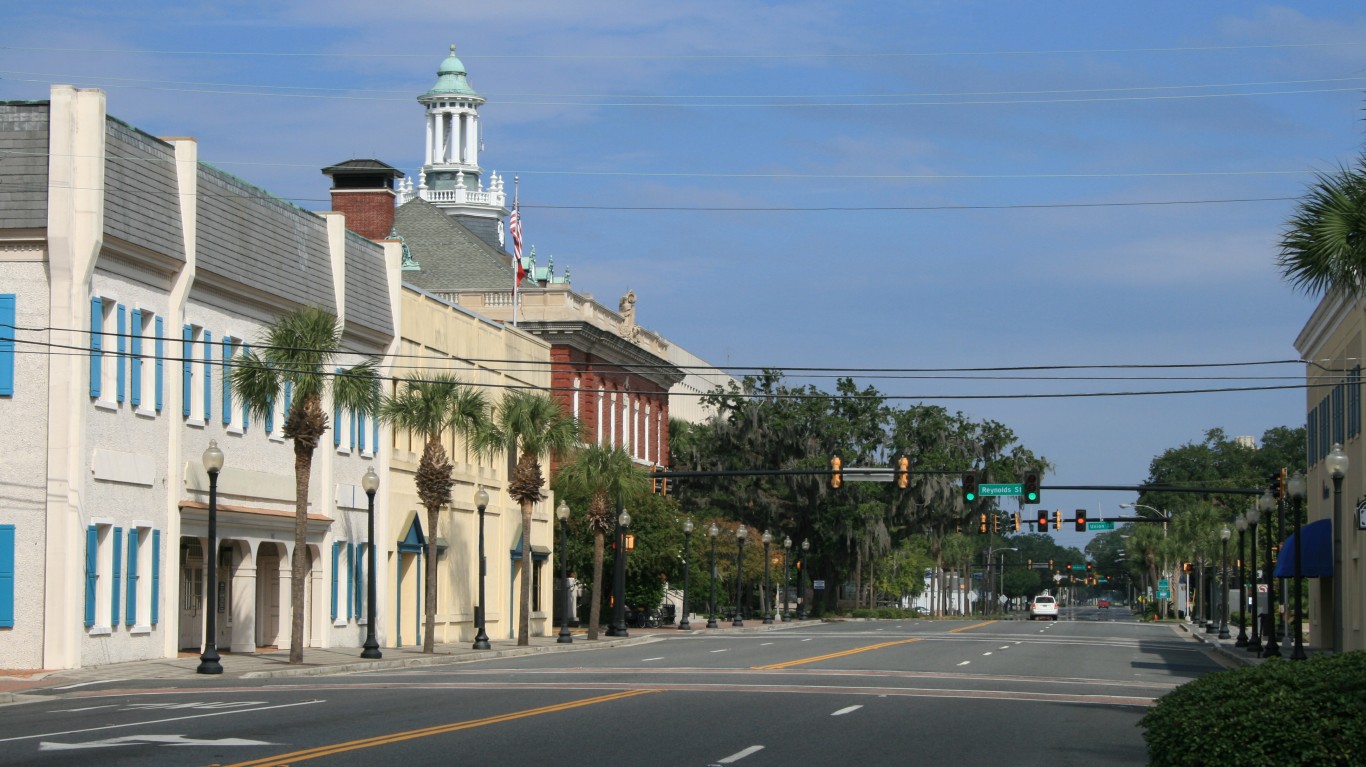
46. Brunswick, Georgia
> Adults who don’t exercise: 30.2% (US avg: 22.7%)
> Pop. with access to places for physical activity: 65.7% — #334 out of 382 (US avg: 84.2%)
> Adult obesity rate: 32.1% — #185 out of 382 (US avg: 29.7%)
> Pop. over 20 with diabetes: 11.0% — #184 out of 382 (US avg: 10.5%)
> Adults in poor or fair health: 19.5% — #149 out of 382 (US avg: 16.5%)
> Physically unhealthy days a month: 4.3 — #162 out of 382 (US avg: 3.7)
> Median household income: $57,381 — #219 out of 382 (US median: $65,712)
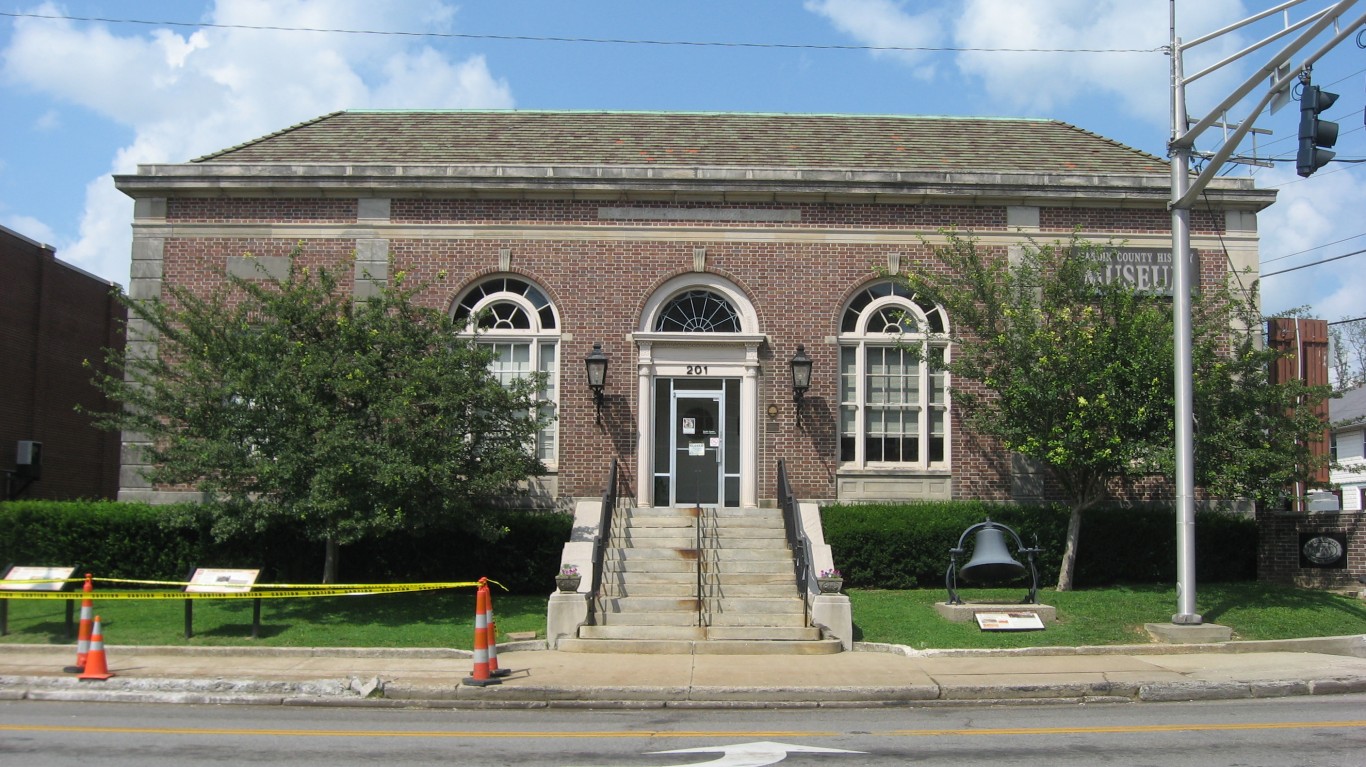
45. Elizabethtown-Fort Knox, Kentucky
> Adults who don’t exercise: 30.2% (US avg: 22.7%)
> Pop. with access to places for physical activity: 53.3% — #371 out of 382 (US avg: 84.2%)
> Adult obesity rate: 38.9% — #24 out of 382 (US avg: 29.7%)
> Pop. over 20 with diabetes: 12.1% — #126 out of 382 (US avg: 10.5%)
> Adults in poor or fair health: 21.7% — #74 out of 382 (US avg: 16.5%)
> Physically unhealthy days a month: 5.0 — #31 out of 382 (US avg: 3.7)
> Median household income: $55,246 — #255 out of 382 (US median: $65,712)
[in-text-ad]
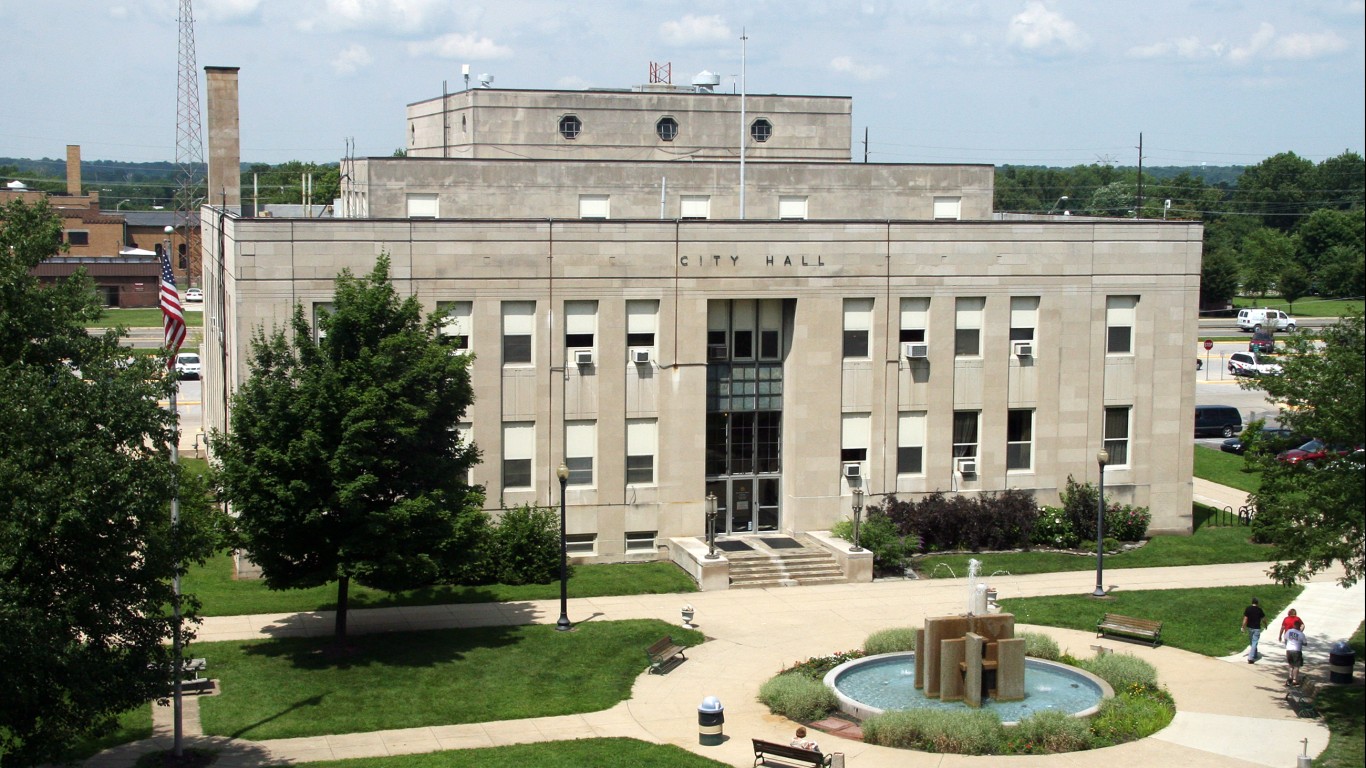
44. Terre Haute, Indiana
> Adults who don’t exercise: 30.3% (US avg: 22.7%)
> Pop. with access to places for physical activity: 75.2% — #259 out of 382 (US avg: 84.2%)
> Adult obesity rate: 34.7% — #111 out of 382 (US avg: 29.7%)
> Pop. over 20 with diabetes: 13.1% — #74 out of 382 (US avg: 10.5%)
> Adults in poor or fair health: 20.0% — #128 out of 382 (US avg: 16.5%)
> Physically unhealthy days a month: 4.3 — #137 out of 382 (US avg: 3.7)
> Median household income: $50,129 — #321 out of 382 (US median: $65,712)

43. Parkersburg-Vienna, West Virginia
> Adults who don’t exercise: 30.3% (US avg: 22.7%)
> Pop. with access to places for physical activity: 66.9% — #322 out of 382 (US avg: 84.2%)
> Adult obesity rate: 39.4% — #19 out of 382 (US avg: 29.7%)
> Pop. over 20 with diabetes: 17.8% — #04 out of 382 (US avg: 10.5%)
> Adults in poor or fair health: 23.1% — #39 out of 382 (US avg: 16.5%)
> Physically unhealthy days a month: 5.3 — #08 out of 382 (US avg: 3.7)
> Median household income: $48,680 — #341 out of 382 (US median: $65,712)
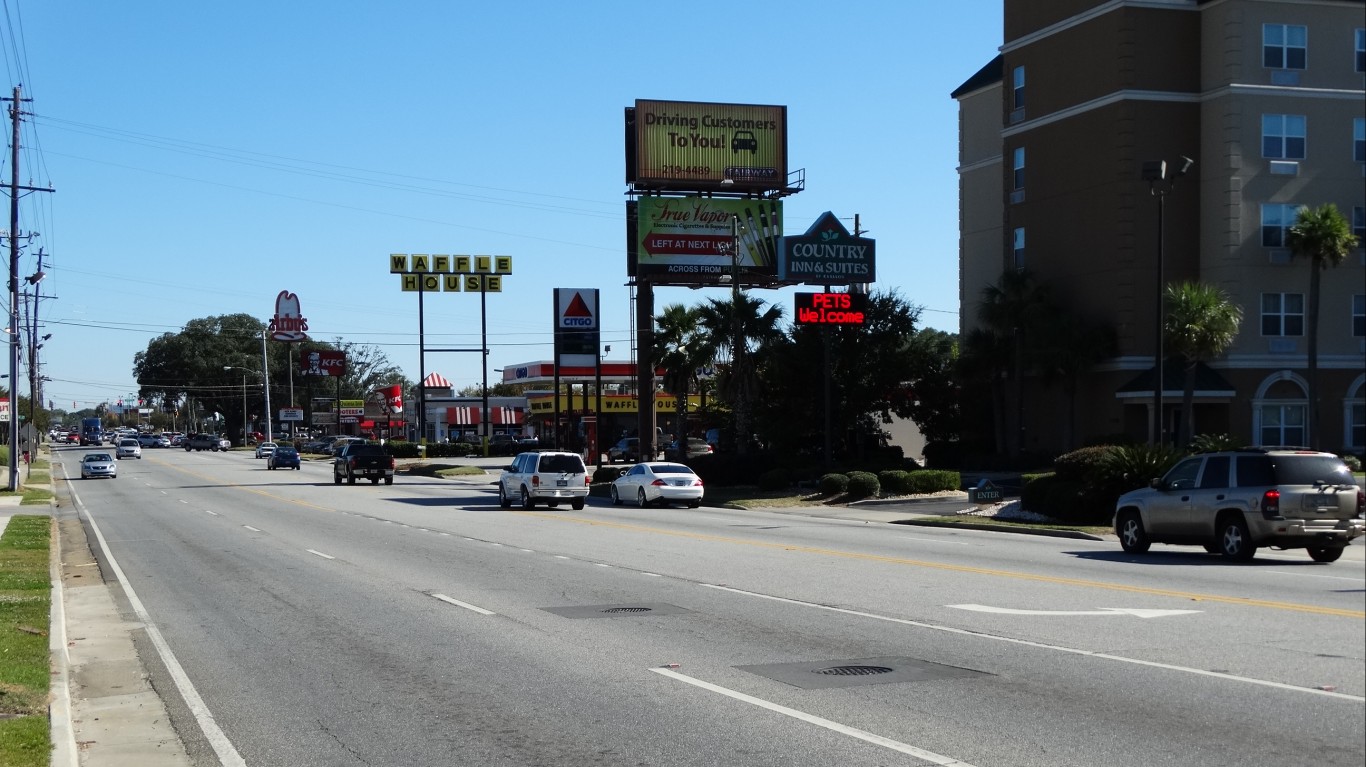
42. Valdosta, Georgia
> Adults who don’t exercise: 30.4% (US avg: 22.7%)
> Pop. with access to places for physical activity: 63.6% — #343 out of 382 (US avg: 84.2%)
> Adult obesity rate: 34.8% — #107 out of 382 (US avg: 29.7%)
> Pop. over 20 with diabetes: 16.8% — #11 out of 382 (US avg: 10.5%)
> Adults in poor or fair health: 22.4% — #50 out of 382 (US avg: 16.5%)
> Physically unhealthy days a month: 4.5 — #102 out of 382 (US avg: 3.7)
> Median household income: $43,787 — #372 out of 382 (US median: $65,712)
[in-text-ad-2]
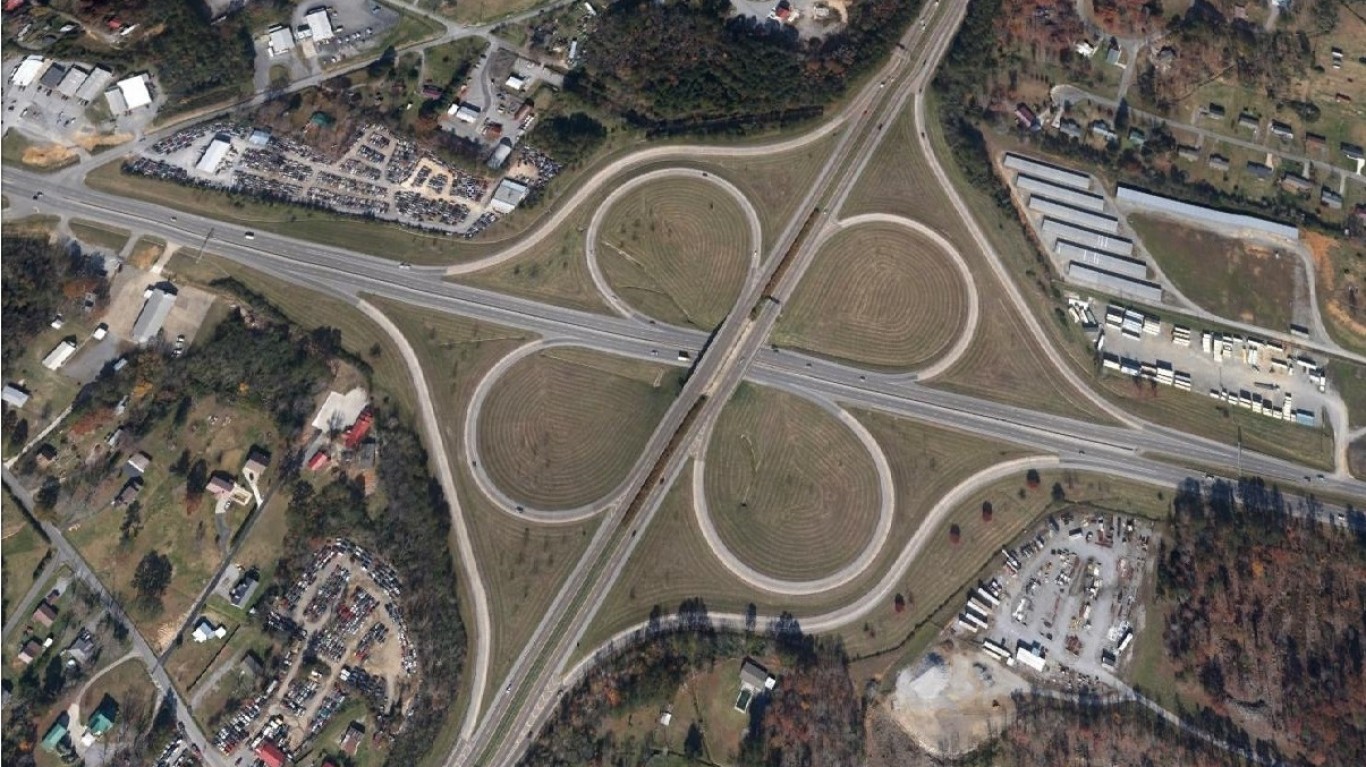
41. Cleveland, Tennessee
> Adults who don’t exercise: 30.5% (US avg: 22.7%)
> Pop. with access to places for physical activity: 76.3% — #246 out of 382 (US avg: 84.2%)
> Adult obesity rate: 37.6% — #43 out of 382 (US avg: 29.7%)
> Pop. over 20 with diabetes: 14.6% — #44 out of 382 (US avg: 10.5%)
> Adults in poor or fair health: 22.5% — #47 out of 382 (US avg: 16.5%)
> Physically unhealthy days a month: 5.1 — #20 out of 382 (US avg: 3.7)
> Median household income: $52,178 — #292 out of 382 (US median: $65,712)
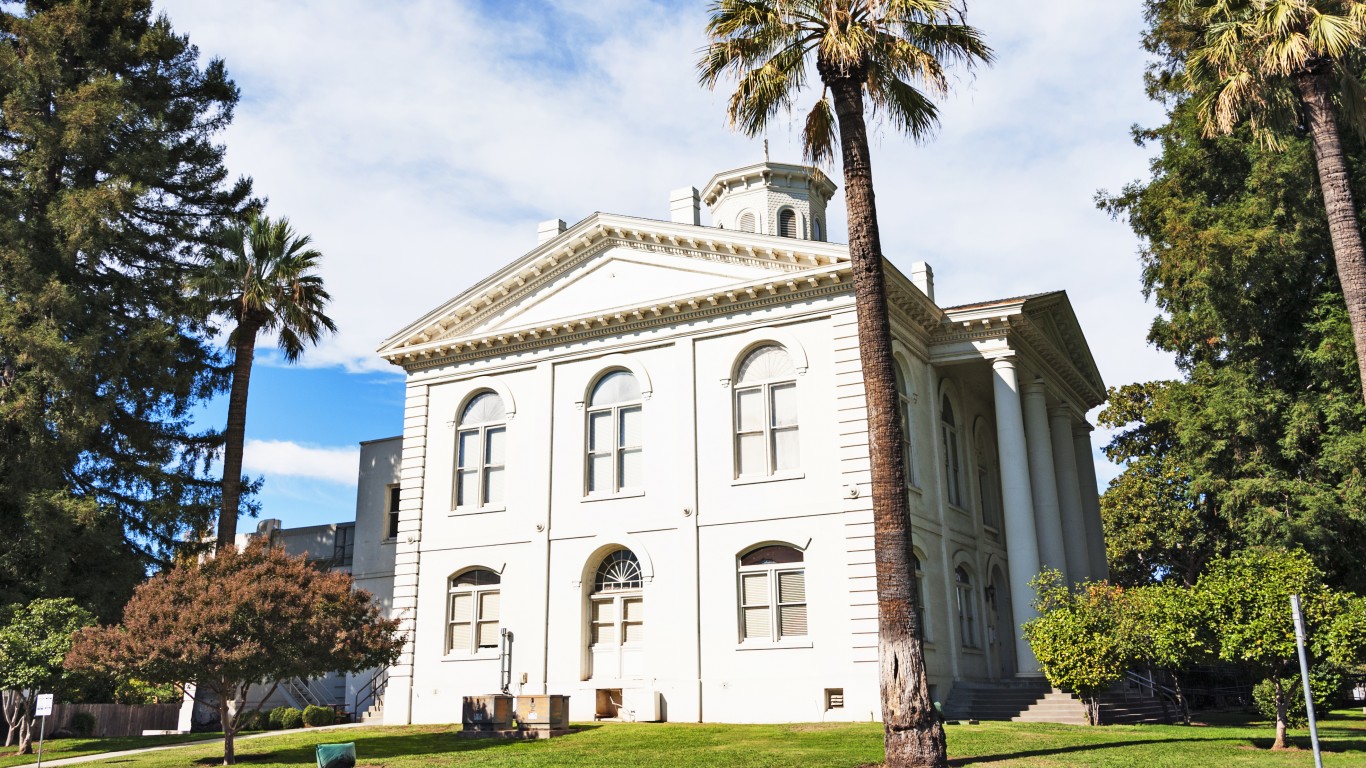
40. Yuba City, California
> Adults who don’t exercise: 30.5% (US avg: 22.7%)
> Pop. with access to places for physical activity: 76.1% — #248 out of 382 (US avg: 84.2%)
> Adult obesity rate: 29.6% — #271 out of 382 (US avg: 29.7%)
> Pop. over 20 with diabetes: 12.9% — #82 out of 382 (US avg: 10.5%)
> Adults in poor or fair health: 21.7% — #73 out of 382 (US avg: 16.5%)
> Physically unhealthy days a month: 4.9 — #37 out of 382 (US avg: 3.7)
> Median household income: $61,307 — #153 out of 382 (US median: $65,712)
[in-text-ad]

39. Beckley, West Virginia
> Adults who don’t exercise: 30.7% (US avg: 22.7%)
> Pop. with access to places for physical activity: 57.3% — #368 out of 382 (US avg: 84.2%)
> Adult obesity rate: 38.9% — #23 out of 382 (US avg: 29.7%)
> Pop. over 20 with diabetes: 17.9% — #03 out of 382 (US avg: 10.5%)
> Adults in poor or fair health: 25.6% — #15 out of 382 (US avg: 16.5%)
> Physically unhealthy days a month: 5.5 — #01 out of 382 (US avg: 3.7)
> Median household income: $44,785 — #369 out of 382 (US median: $65,712)
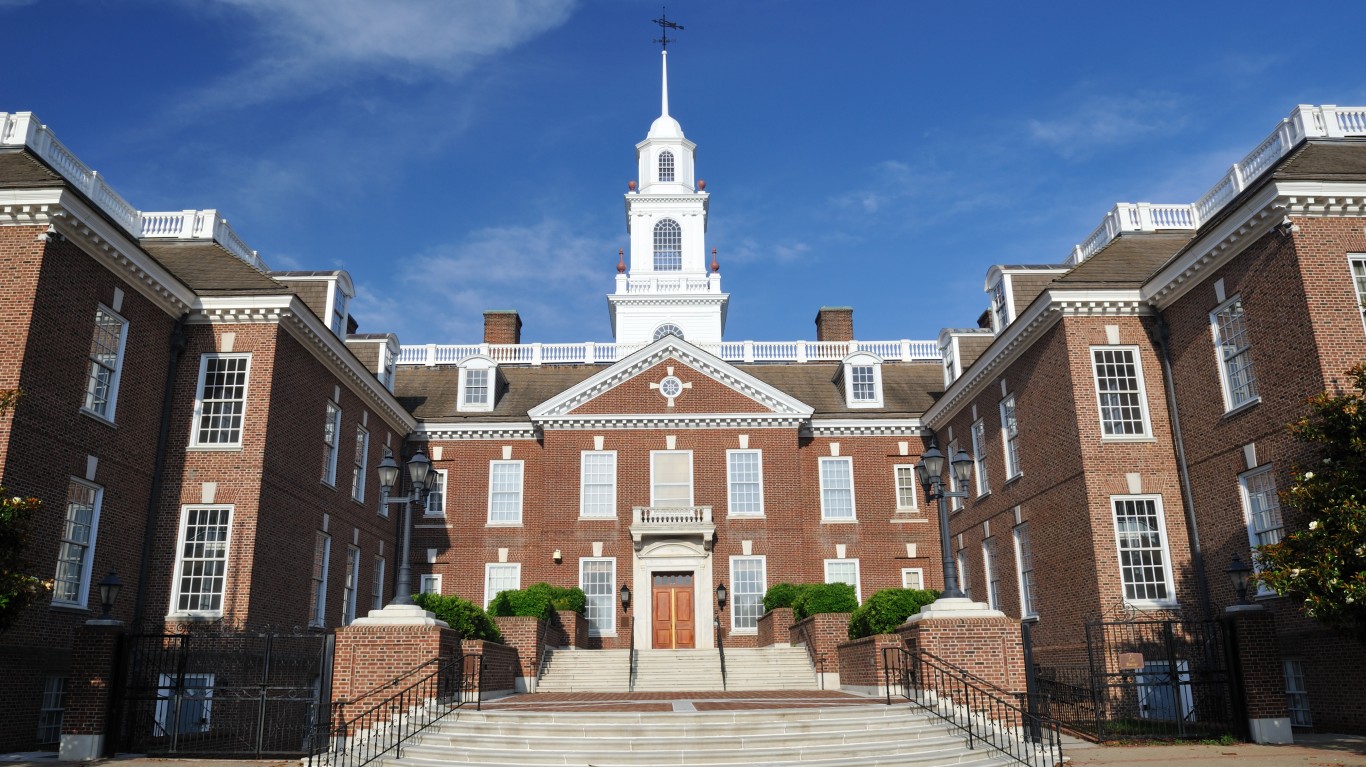
38. Dover, Delaware
> Adults who don’t exercise: 30.9% (US avg: 22.7%)
> Pop. with access to places for physical activity: 66.8% — #324 out of 382 (US avg: 84.2%)
> Adult obesity rate: 38.4% — #29 out of 382 (US avg: 29.7%)
> Pop. over 20 with diabetes: 13.9% — #54 out of 382 (US avg: 10.5%)
> Adults in poor or fair health: 21.0% — #92 out of 382 (US avg: 16.5%)
> Physically unhealthy days a month: 4.5 — #103 out of 382 (US avg: 3.7)
> Median household income: $58,001 — #208 out of 382 (US median: $65,712)
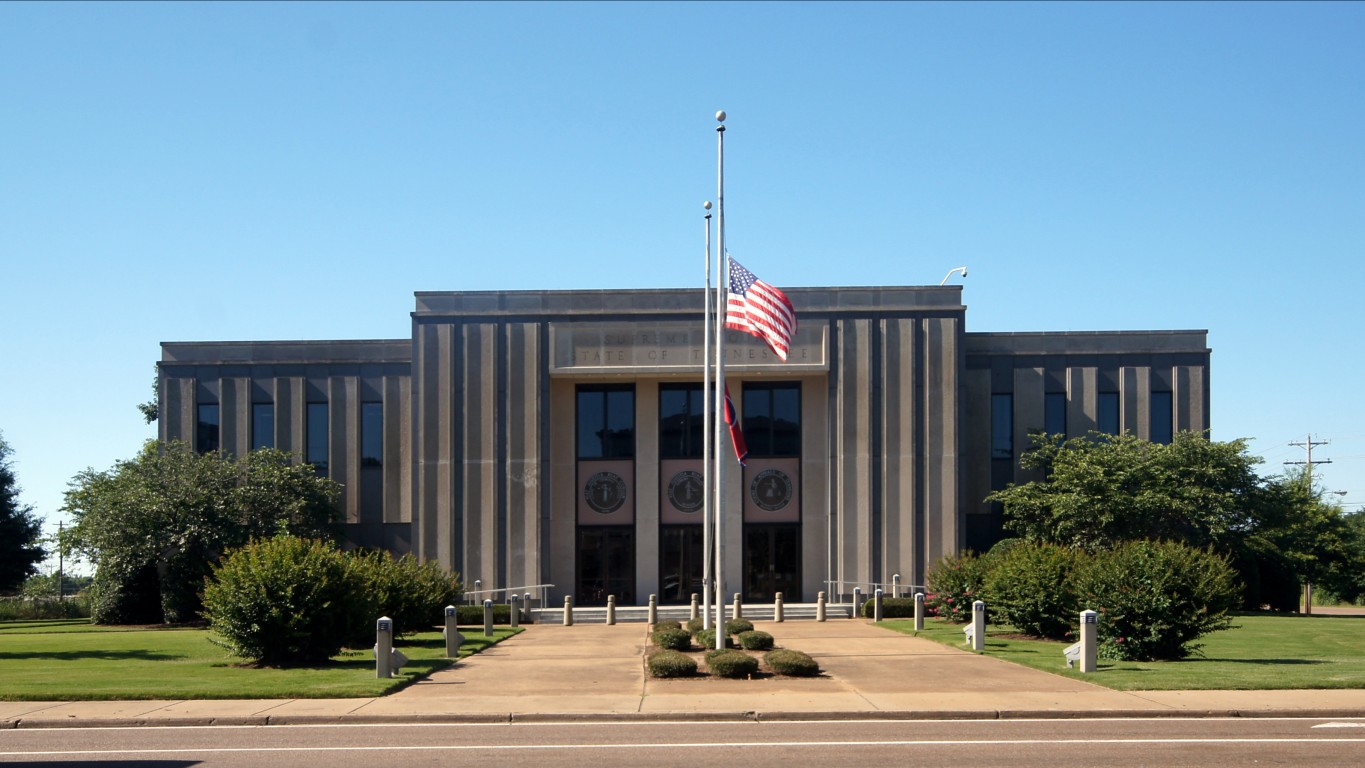
37. Jackson, Tennessee
> Adults who don’t exercise: 31.0% (US avg: 22.7%)
> Pop. with access to places for physical activity: 63.2% — #346 out of 382 (US avg: 84.2%)
> Adult obesity rate: 40.1% — #09 out of 382 (US avg: 29.7%)
> Pop. over 20 with diabetes: 15.6% — #20 out of 382 (US avg: 10.5%)
> Adults in poor or fair health: 23.8% — #26 out of 382 (US avg: 16.5%)
> Physically unhealthy days a month: 5.0 — #29 out of 382 (US avg: 3.7)
> Median household income: $48,700 — #339 out of 382 (US median: $65,712)
[in-text-ad-2]
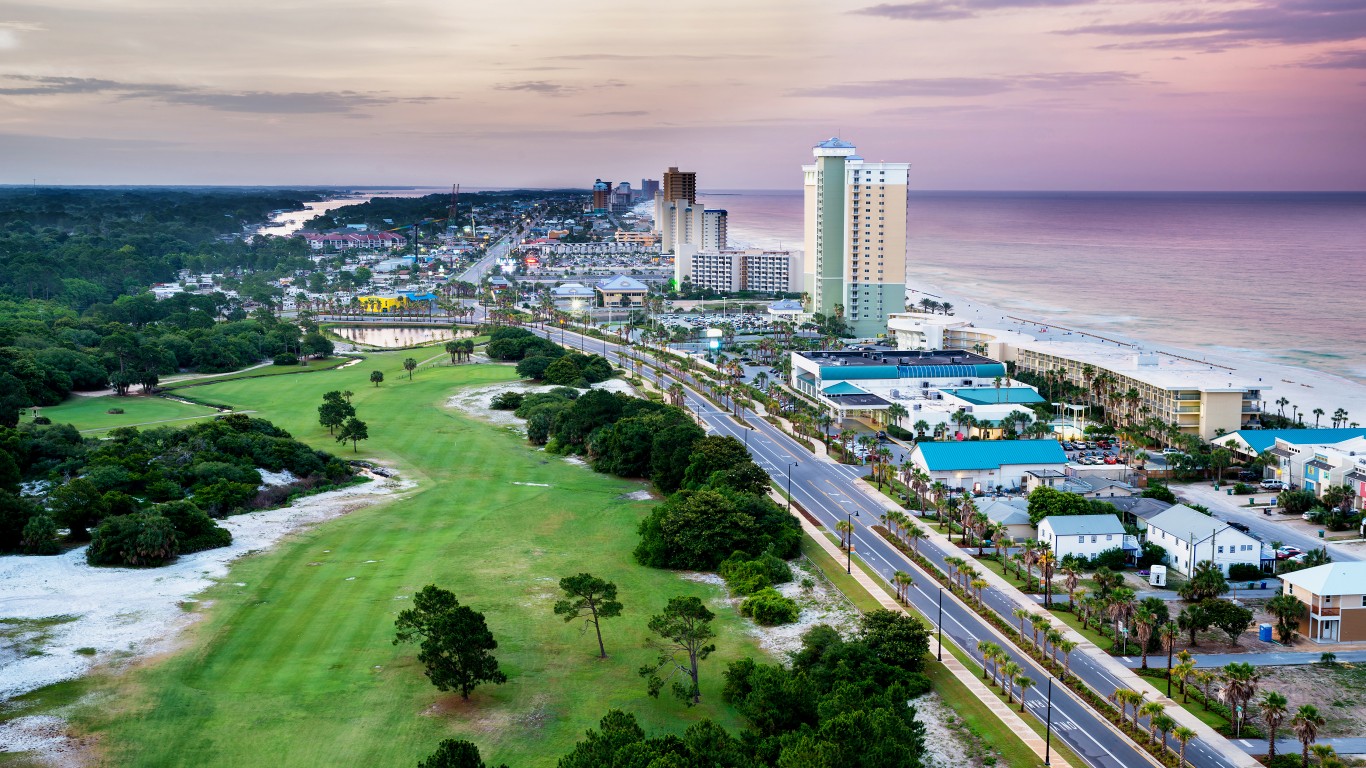
36. Panama City, Florida
> Adults who don’t exercise: 31.1% (US avg: 22.7%)
> Pop. with access to places for physical activity: 66.9% — #323 out of 382 (US avg: 84.2%)
> Adult obesity rate: 30.2% — #255 out of 382 (US avg: 29.7%)
> Pop. over 20 with diabetes: 12.1% — #128 out of 382 (US avg: 10.5%)
> Adults in poor or fair health: 21.3% — #84 out of 382 (US avg: 16.5%)
> Physically unhealthy days a month: 4.9 — #36 out of 382 (US avg: 3.7)
> Median household income: $59,450 — #194 out of 382 (US median: $65,712)
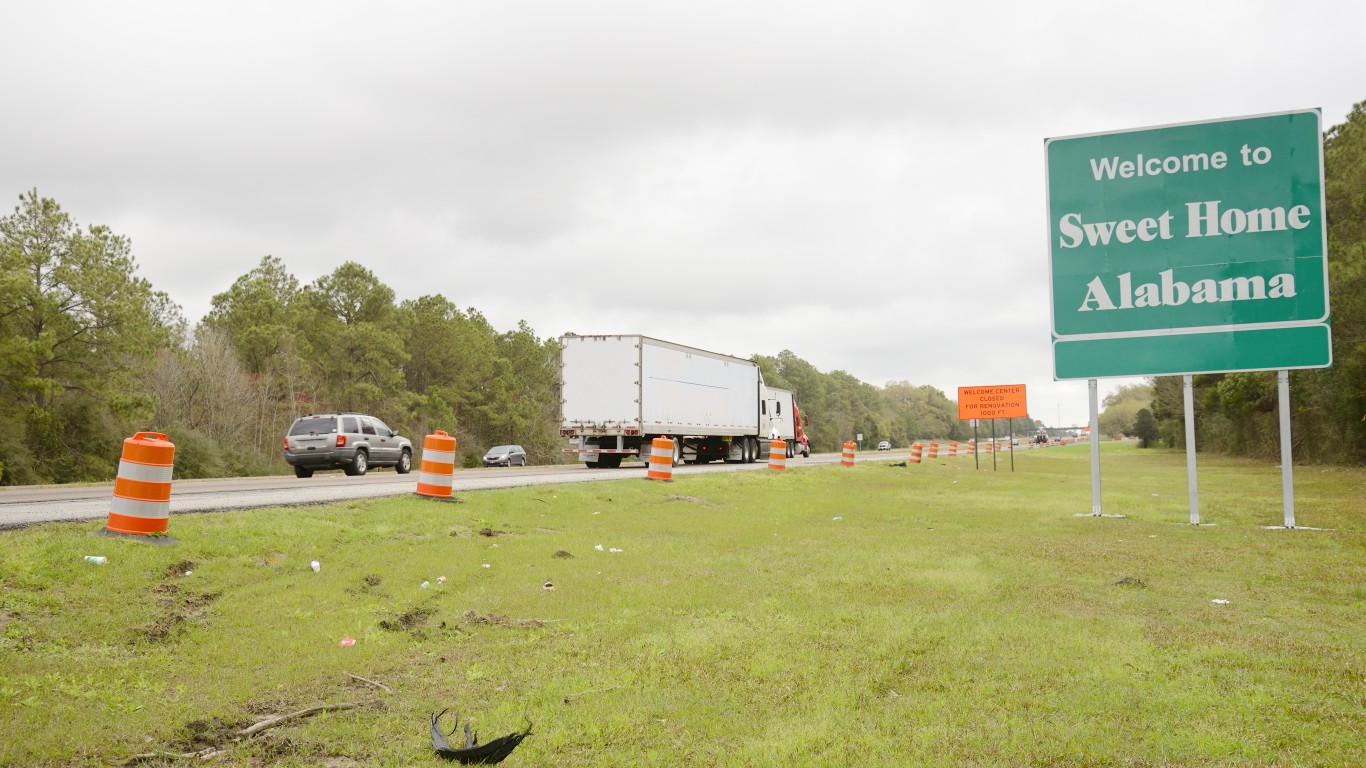
35. Anniston-Oxford-Jacksonville, Alabama
> Adults who don’t exercise: 31.1% (US avg: 22.7%)
> Pop. with access to places for physical activity: 47.7% — #379 out of 382 (US avg: 84.2%)
> Adult obesity rate: 39.7% — #12 out of 382 (US avg: 29.7%)
> Pop. over 20 with diabetes: 17.0% — #08 out of 382 (US avg: 10.5%)
> Adults in poor or fair health: 23.7% — #29 out of 382 (US avg: 16.5%)
> Physically unhealthy days a month: 4.9 — #35 out of 382 (US avg: 3.7)
> Median household income: $48,156 — #351 out of 382 (US median: $65,712)
[in-text-ad]
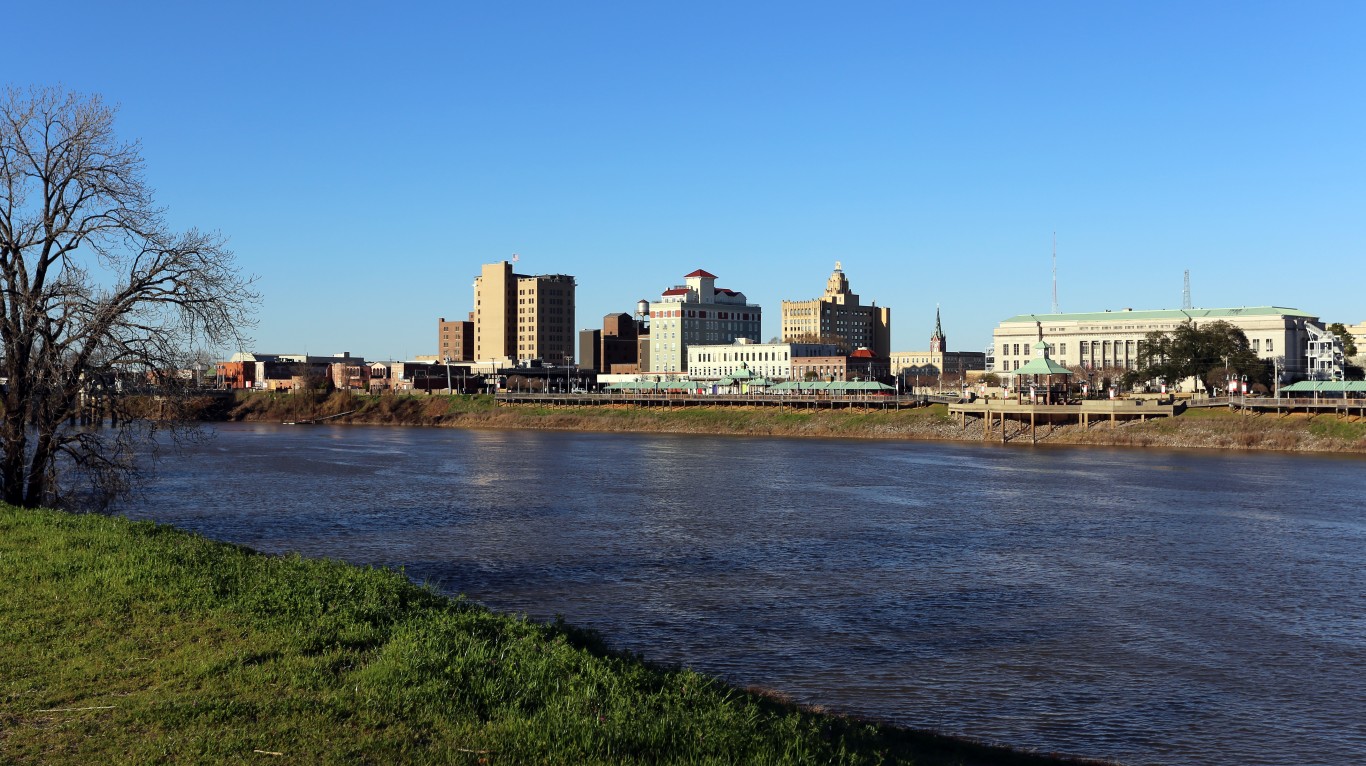
34. Monroe, Louisiana
> Adults who don’t exercise: 31.2% (US avg: 22.7%)
> Pop. with access to places for physical activity: 73.4% — #276 out of 382 (US avg: 84.2%)
> Adult obesity rate: 42.0% — #04 out of 382 (US avg: 29.7%)
> Pop. over 20 with diabetes: 15.0% — #34 out of 382 (US avg: 10.5%)
> Adults in poor or fair health: 23.8% — #25 out of 382 (US avg: 16.5%)
> Physically unhealthy days a month: 4.7 — #63 out of 382 (US avg: 3.7)
> Median household income: $40,136 — #380 out of 382 (US median: $65,712)

33. Huntington-Ashland, West Virginia
> Adults who don’t exercise: 31.3% (US avg: 22.7%)
> Pop. with access to places for physical activity: 66.0% — #333 out of 382 (US avg: 84.2%)
> Adult obesity rate: 39.6% — #17 out of 382 (US avg: 29.7%)
> Pop. over 20 with diabetes: 15.5% — #21 out of 382 (US avg: 10.5%)
> Adults in poor or fair health: 23.2% — #36 out of 382 (US avg: 16.5%)
> Physically unhealthy days a month: 5.3 — #07 out of 382 (US avg: 3.7)
> Median household income: $48,329 — #349 out of 382 (US median: $65,712)
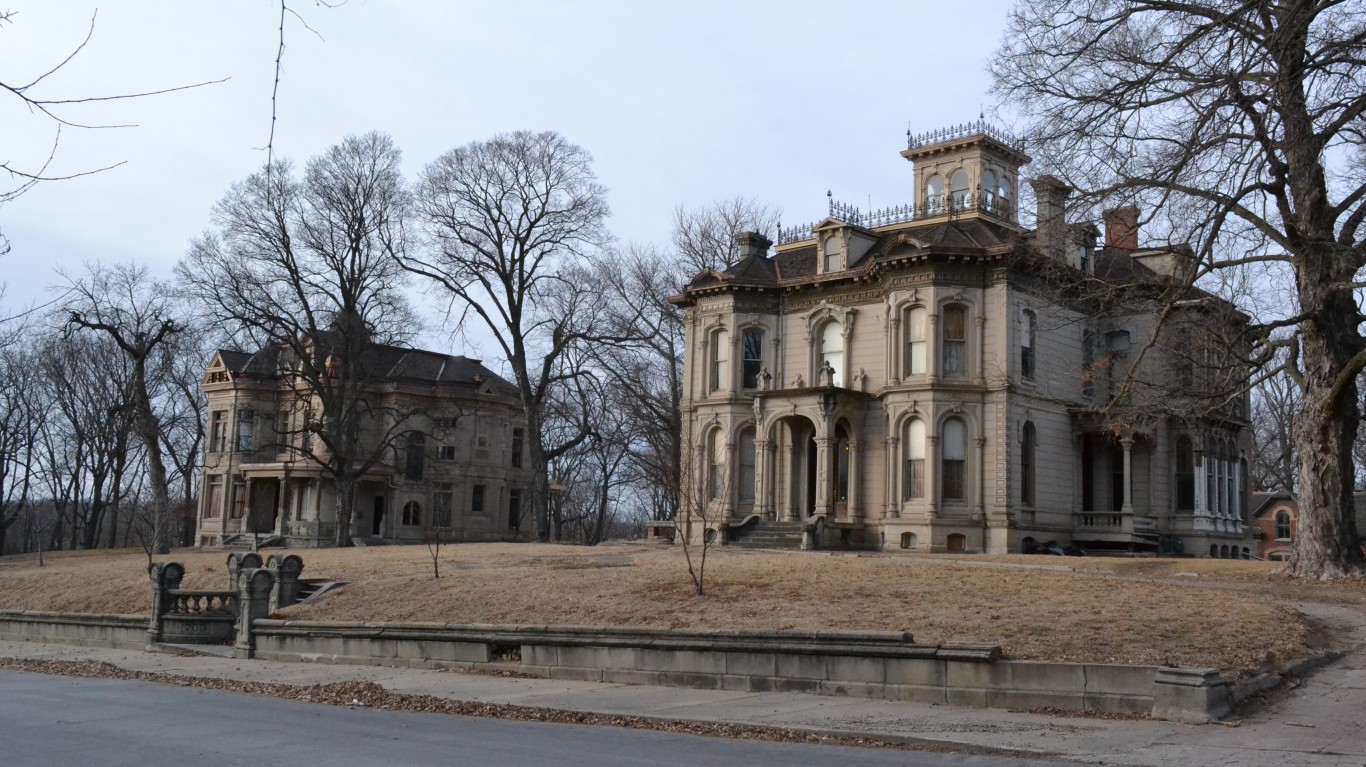
32. St. Joseph, Missouri
> Adults who don’t exercise: 31.4% (US avg: 22.7%)
> Pop. with access to places for physical activity: 74.9% — #264 out of 382 (US avg: 84.2%)
> Adult obesity rate: 37.0% — #54 out of 382 (US avg: 29.7%)
> Pop. over 20 with diabetes: 12.4% — #114 out of 382 (US avg: 10.5%)
> Adults in poor or fair health: 20.9% — #97 out of 382 (US avg: 16.5%)
> Physically unhealthy days a month: 4.7 — #66 out of 382 (US avg: 3.7)
> Median household income: $50,425 — #315 out of 382 (US median: $65,712)
[in-text-ad-2]

31. Kingsport-Bristol-Bristol, Tennessee
> Adults who don’t exercise: 31.5% (US avg: 22.7%)
> Pop. with access to places for physical activity: 69.0% — #311 out of 382 (US avg: 84.2%)
> Adult obesity rate: 32.3% — #179 out of 382 (US avg: 29.7%)
> Pop. over 20 with diabetes: 15.0% — #33 out of 382 (US avg: 10.5%)
> Adults in poor or fair health: 21.8% — #69 out of 382 (US avg: 16.5%)
> Physically unhealthy days a month: 5.0 — #24 out of 382 (US avg: 3.7)
> Median household income: $48,615 — #342 out of 382 (US median: $65,712)
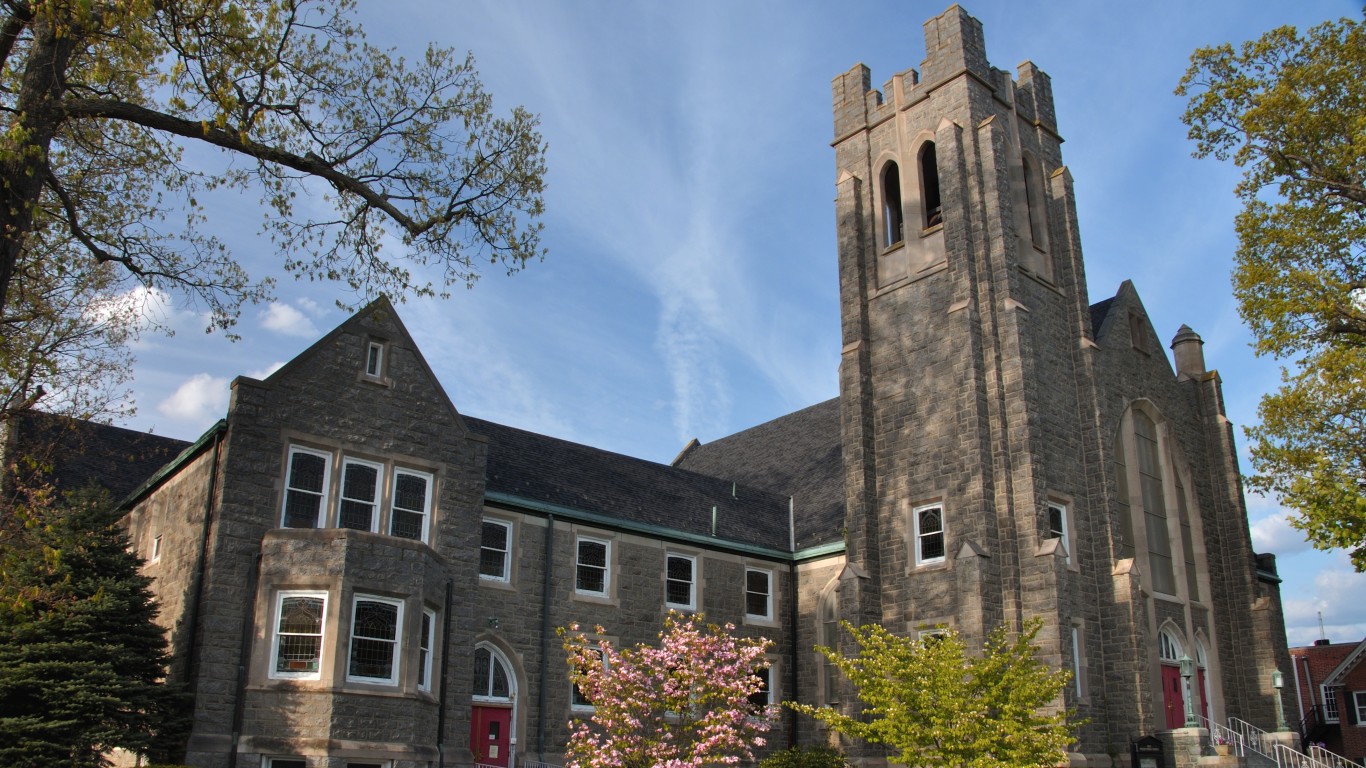
30. Vineland-Bridgeton, New Jersey
> Adults who don’t exercise: 31.7% (US avg: 22.7%)
> Pop. with access to places for physical activity: 79.3% — #209 out of 382 (US avg: 84.2%)
> Adult obesity rate: 36.5% — #64 out of 382 (US avg: 29.7%)
> Pop. over 20 with diabetes: 12.7% — #94 out of 382 (US avg: 10.5%)
> Adults in poor or fair health: 25.2% — #17 out of 382 (US avg: 16.5%)
> Physically unhealthy days a month: 5.3 — #09 out of 382 (US avg: 3.7)
> Median household income: $54,587 — #263 out of 382 (US median: $65,712)
[in-text-ad]

29. Florence, South Carolina
> Adults who don’t exercise: 31.8% (US avg: 22.7%)
> Pop. with access to places for physical activity: 52.3% — #373 out of 382 (US avg: 84.2%)
> Adult obesity rate: 38.4% — #30 out of 382 (US avg: 29.7%)
> Pop. over 20 with diabetes: 16.8% — #10 out of 382 (US avg: 10.5%)
> Adults in poor or fair health: 21.5% — #78 out of 382 (US avg: 16.5%)
> Physically unhealthy days a month: 4.4 — #115 out of 382 (US avg: 3.7)
> Median household income: $48,547 — #344 out of 382 (US median: $65,712)
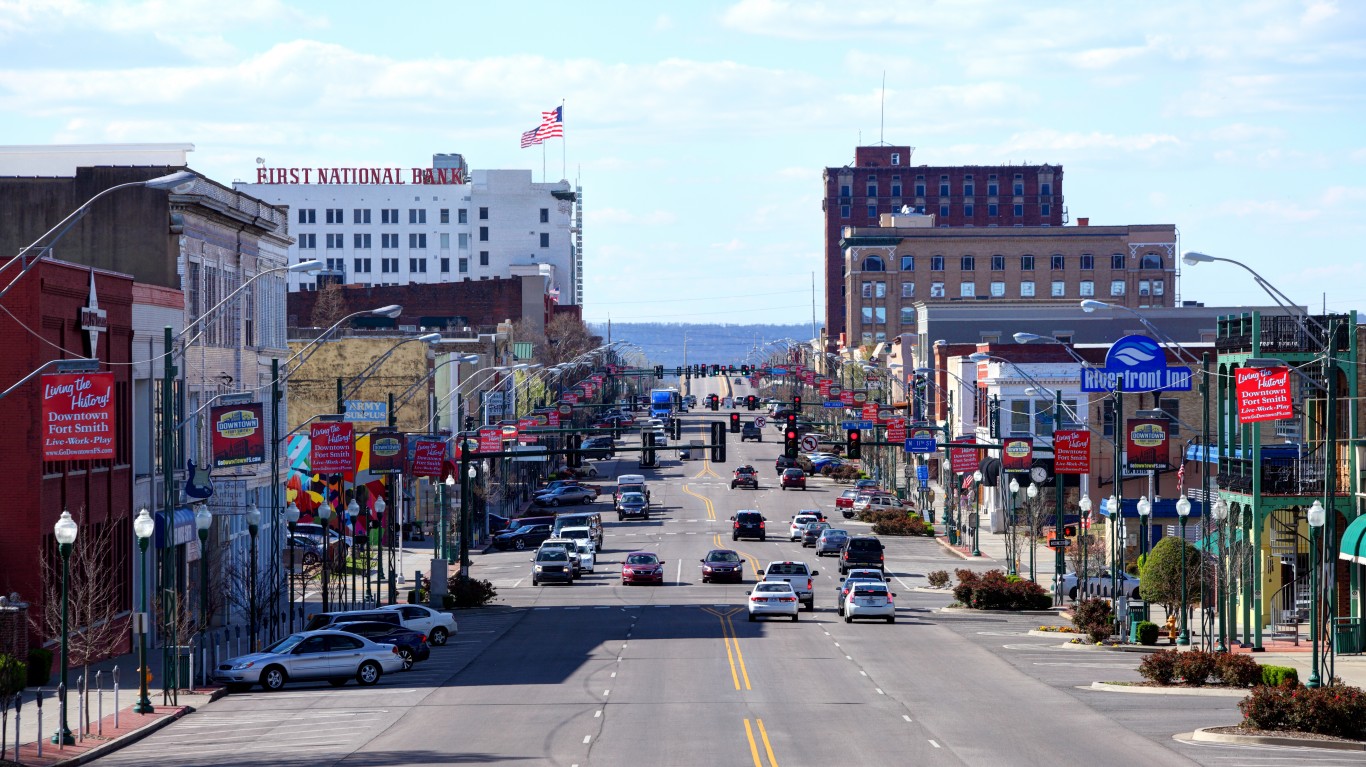
28. Fort Smith, Arkansas
> Adults who don’t exercise: 31.8% (US avg: 22.7%)
> Pop. with access to places for physical activity: 62.8% — #348 out of 382 (US avg: 84.2%)
> Adult obesity rate: 36.4% — #69 out of 382 (US avg: 29.7%)
> Pop. over 20 with diabetes: 14.3% — #47 out of 382 (US avg: 10.5%)
> Adults in poor or fair health: 26.1% — #10 out of 382 (US avg: 16.5%)
> Physically unhealthy days a month: 5.5 — #02 out of 382 (US avg: 3.7)
> Median household income: $45,157 — #366 out of 382 (US median: $65,712)

27. Laredo, Texas
> Adults who don’t exercise: 31.9% (US avg: 22.7%)
> Pop. with access to places for physical activity: 87.5% — #94 out of 382 (US avg: 84.2%)
> Adult obesity rate: 37.4% — #46 out of 382 (US avg: 29.7%)
> Pop. over 20 with diabetes: 9.1% — #301 out of 382 (US avg: 10.5%)
> Adults in poor or fair health: 34.9% — #01 out of 382 (US avg: 16.5%)
> Physically unhealthy days a month: 5.0 — #27 out of 382 (US avg: 3.7)
> Median household income: $56,084 — #243 out of 382 (US median: $65,712)
[in-text-ad-2]

26. Albany, Georgia
> Adults who don’t exercise: 32.0% (US avg: 22.7%)
> Pop. with access to places for physical activity: 69.0% — #310 out of 382 (US avg: 84.2%)
> Adult obesity rate: 39.7% — #11 out of 382 (US avg: 29.7%)
> Pop. over 20 with diabetes: 17.1% — #07 out of 382 (US avg: 10.5%)
> Adults in poor or fair health: 24.2% — #19 out of 382 (US avg: 16.5%)
> Physically unhealthy days a month: 4.8 — #59 out of 382 (US avg: 3.7)
> Median household income: $40,625 — #379 out of 382 (US median: $65,712)

25. Alexandria, Louisiana
> Adults who don’t exercise: 32.0% (US avg: 22.7%)
> Pop. with access to places for physical activity: 78.5% — #220 out of 382 (US avg: 84.2%)
> Adult obesity rate: 40.4% — #06 out of 382 (US avg: 29.7%)
> Pop. over 20 with diabetes: 16.4% — #14 out of 382 (US avg: 10.5%)
> Adults in poor or fair health: 23.1% — #40 out of 382 (US avg: 16.5%)
> Physically unhealthy days a month: 4.8 — #55 out of 382 (US avg: 3.7)
> Median household income: $50,553 — #312 out of 382 (US median: $65,712)
[in-text-ad]
23. Mansfield, Ohio
> Adults who don’t exercise: 32.0% (US avg: 22.7%)
> Pop. with access to places for physical activity: 67.3% — #321 out of 382 (US avg: 84.2%)
> Adult obesity rate: 35.6% — #84 out of 382 (US avg: 29.7%)
> Pop. over 20 with diabetes: 14.2% — #50 out of 382 (US avg: 10.5%)
> Adults in poor or fair health: 20.6% — #105 out of 382 (US avg: 16.5%)
> Physically unhealthy days a month: 4.6 — #88 out of 382 (US avg: 3.7)
> Median household income: $51,783 — #296 out of 382 (US median: $65,712)
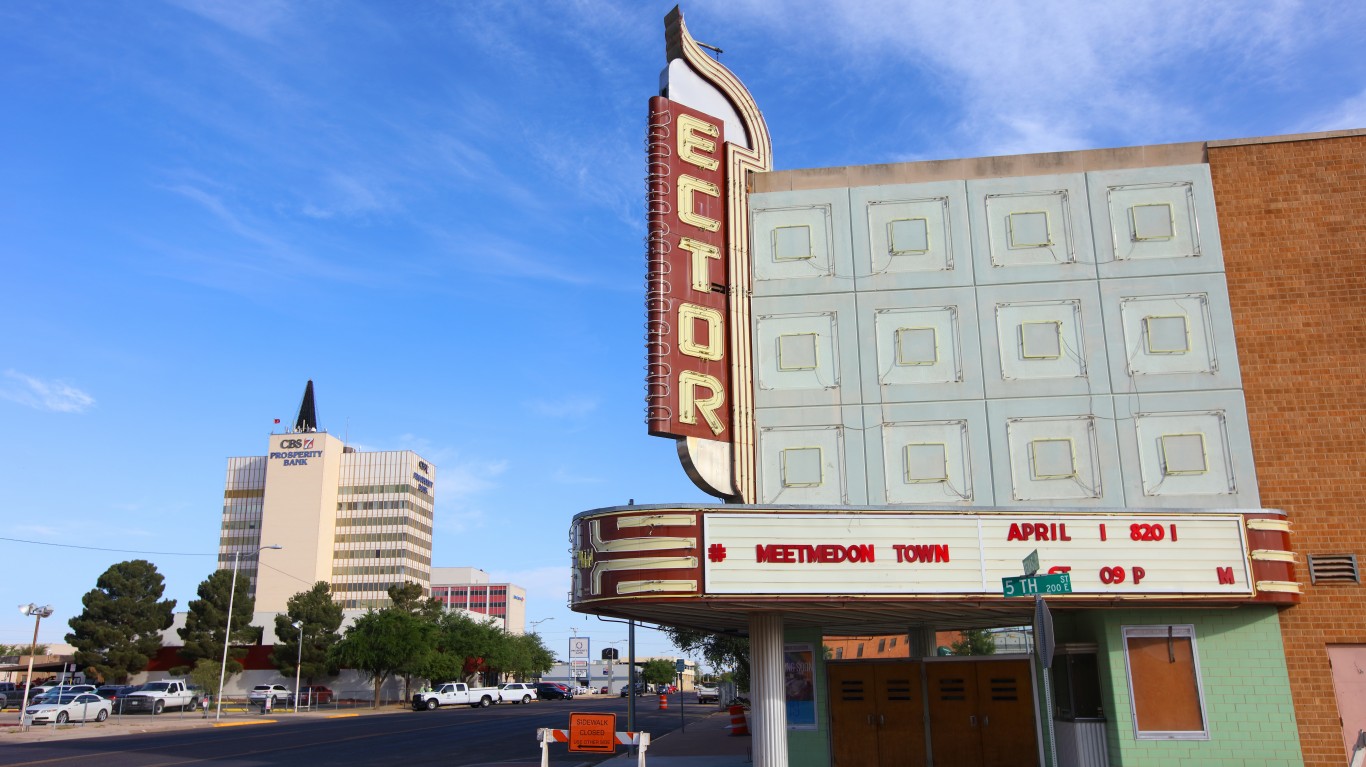
23. Odessa, Texas
> Adults who don’t exercise: 32.0% (US avg: 22.7%)
> Pop. with access to places for physical activity: 71.1% — #293 out of 382 (US avg: 84.2%)
> Adult obesity rate: 37.3% — #49 out of 382 (US avg: 29.7%)
> Pop. over 20 with diabetes: 8.7% — #321 out of 382 (US avg: 10.5%)
> Adults in poor or fair health: 24.0% — #22 out of 382 (US avg: 16.5%)
> Physically unhealthy days a month: 4.3 — #144 out of 382 (US avg: 3.7)
> Median household income: $67,205 — #92 out of 382 (US median: $65,712)

22. Macon-Bibb County, Georgia
> Adults who don’t exercise: 32.0% (US avg: 22.7%)
> Pop. with access to places for physical activity: 66.7% — #326 out of 382 (US avg: 84.2%)
> Adult obesity rate: 38.5% — #28 out of 382 (US avg: 29.7%)
> Pop. over 20 with diabetes: 18.6% — #01 out of 382 (US avg: 10.5%)
> Adults in poor or fair health: 22.2% — #59 out of 382 (US avg: 16.5%)
> Physically unhealthy days a month: 4.5 — #89 out of 382 (US avg: 3.7)
> Median household income: $48,435 — #347 out of 382 (US median: $65,712)
[in-text-ad-2]
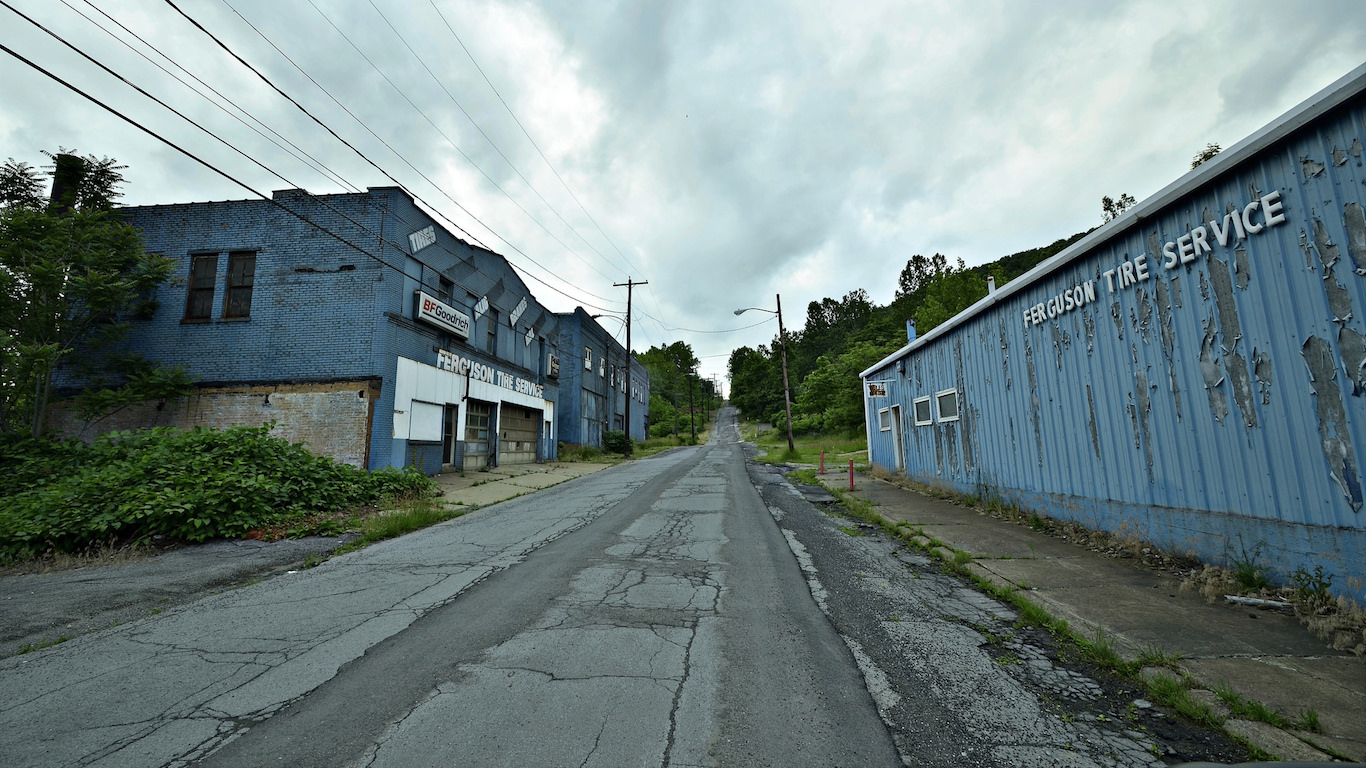
21. Weirton-Steubenville, West Virginia
> Adults who don’t exercise: 32.0% (US avg: 22.7%)
> Pop. with access to places for physical activity: 85.2% — #128 out of 382 (US avg: 84.2%)
> Adult obesity rate: 38.4% — #31 out of 382 (US avg: 29.7%)
> Pop. over 20 with diabetes: 15.3% — #27 out of 382 (US avg: 10.5%)
> Adults in poor or fair health: 20.9% — #96 out of 382 (US avg: 16.5%)
> Physically unhealthy days a month: 4.8 — #41 out of 382 (US avg: 3.7)
> Median household income: $49,510 — #332 out of 382 (US median: $65,712)
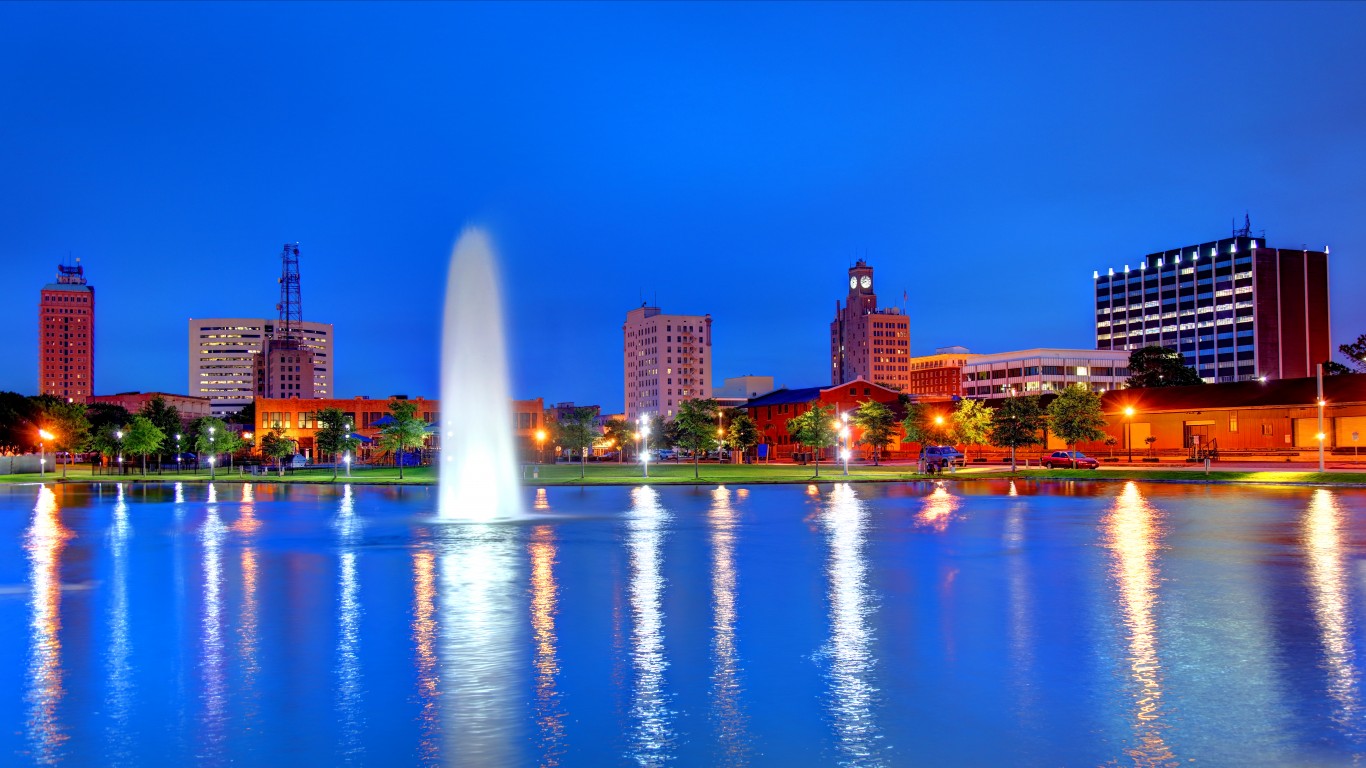
20. Beaumont-Port Arthur, Texas
> Adults who don’t exercise: 32.1% (US avg: 22.7%)
> Pop. with access to places for physical activity: 61.6% — #355 out of 382 (US avg: 84.2%)
> Adult obesity rate: 41.5% — #05 out of 382 (US avg: 29.7%)
> Pop. over 20 with diabetes: 13.6% — #57 out of 382 (US avg: 10.5%)
> Adults in poor or fair health: 22.2% — #56 out of 382 (US avg: 16.5%)
> Physically unhealthy days a month: 4.3 — #157 out of 382 (US avg: 3.7)
> Median household income: $58,818 — #198 out of 382 (US median: $65,712)
[in-text-ad]

19. Lake Havasu City-Kingman, Arizona
> Adults who don’t exercise: 32.2% (US avg: 22.7%)
> Pop. with access to places for physical activity: 58.6% — #365 out of 382 (US avg: 84.2%)
> Adult obesity rate: 30.7% — #237 out of 382 (US avg: 29.7%)
> Pop. over 20 with diabetes: 14.0% — #53 out of 382 (US avg: 10.5%)
> Adults in poor or fair health: 22.5% — #48 out of 382 (US avg: 16.5%)
> Physically unhealthy days a month: 5.0 — #30 out of 382 (US avg: 3.7)
> Median household income: $50,179 — #319 out of 382 (US median: $65,712)

18. Morristown, Tennessee
> Adults who don’t exercise: 32.4% (US avg: 22.7%)
> Pop. with access to places for physical activity: 59.5% — #361 out of 382 (US avg: 84.2%)
> Adult obesity rate: 38.0% — #37 out of 382 (US avg: 29.7%)
> Pop. over 20 with diabetes: 14.9% — #35 out of 382 (US avg: 10.5%)
> Adults in poor or fair health: 24.1% — #20 out of 382 (US avg: 16.5%)
> Physically unhealthy days a month: 5.3 — #06 out of 382 (US avg: 3.7)
> Median household income: $47,326 — #358 out of 382 (US median: $65,712)

17. Atlantic City-Hammonton, New Jersey
> Adults who don’t exercise: 32.4% (US avg: 22.7%)
> Pop. with access to places for physical activity: 91.4% — #52 out of 382 (US avg: 84.2%)
> Adult obesity rate: 32.5% — #172 out of 382 (US avg: 29.7%)
> Pop. over 20 with diabetes: 13.2% — #68 out of 382 (US avg: 10.5%)
> Adults in poor or fair health: 18.7% — #184 out of 382 (US avg: 16.5%)
> Physically unhealthy days a month: 4.3 — #147 out of 382 (US avg: 3.7)
> Median household income: $63,389 — #123 out of 382 (US median: $65,712)
[in-text-ad-2]
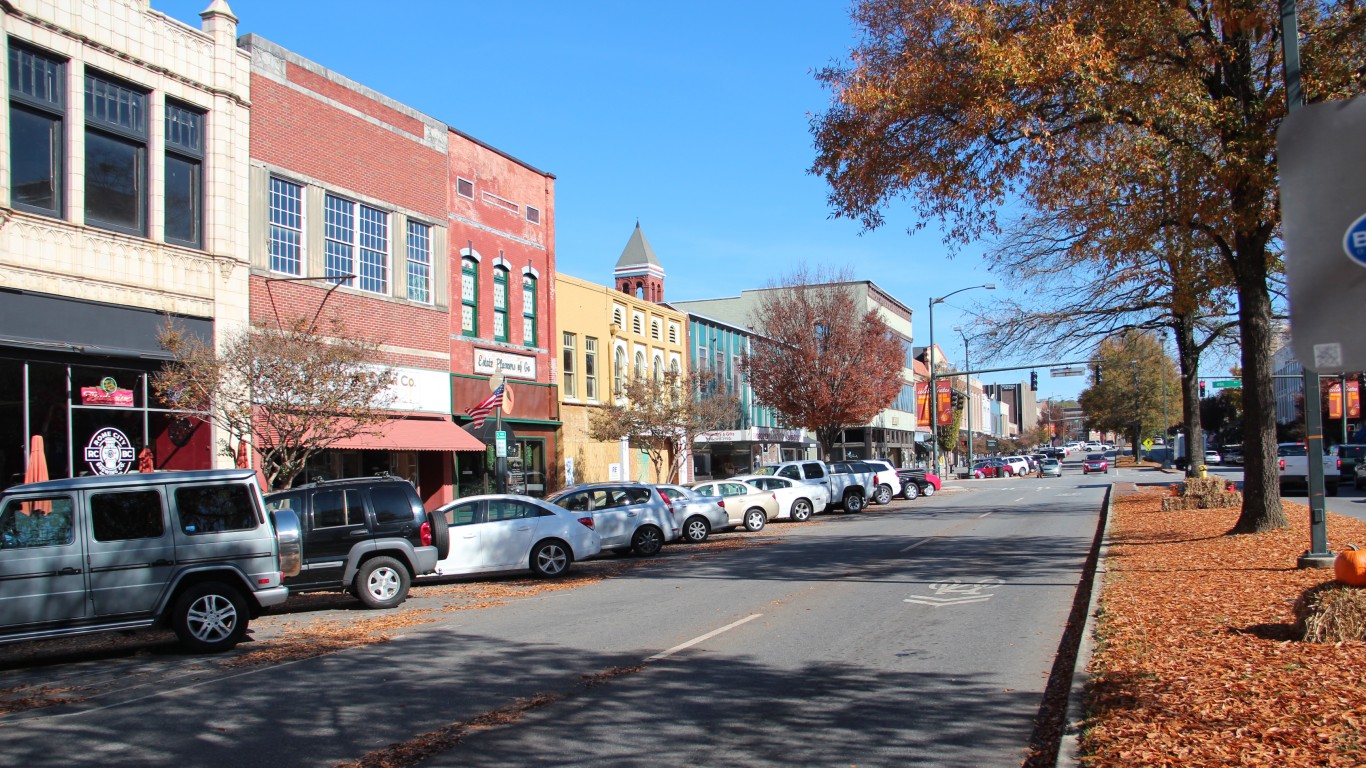
16. Rome, Georgia
> Adults who don’t exercise: 32.8% (US avg: 22.7%)
> Pop. with access to places for physical activity: 58.4% — #366 out of 382 (US avg: 84.2%)
> Adult obesity rate: 34.3% — #120 out of 382 (US avg: 29.7%)
> Pop. over 20 with diabetes: 14.4% — #45 out of 382 (US avg: 10.5%)
> Adults in poor or fair health: 22.0% — #65 out of 382 (US avg: 16.5%)
> Physically unhealthy days a month: 4.6 — #77 out of 382 (US avg: 3.7)
> Median household income: $50,880 — #307 out of 382 (US median: $65,712)
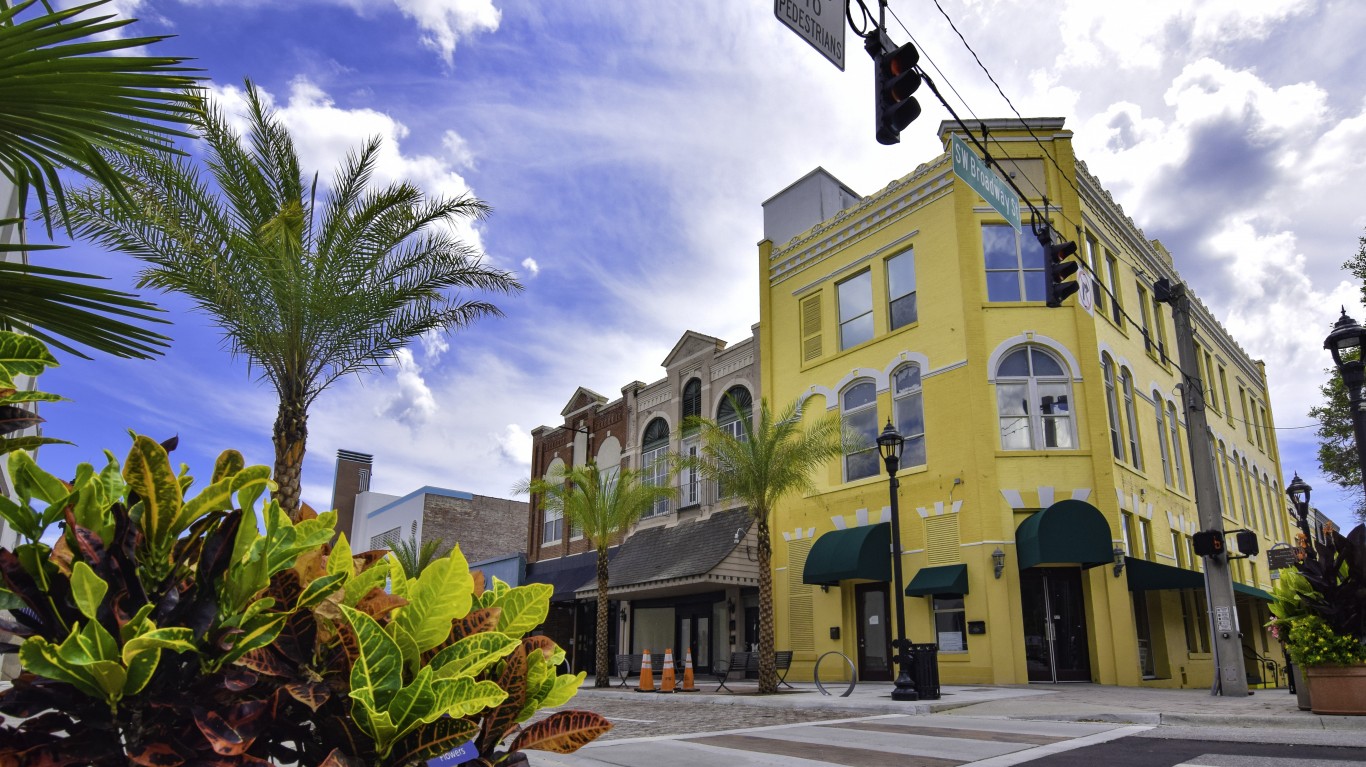
15. Ocala, Florida
> Adults who don’t exercise: 32.9% (US avg: 22.7%)
> Pop. with access to places for physical activity: 75.6% — #253 out of 382 (US avg: 84.2%)
> Adult obesity rate: 32.8% — #164 out of 382 (US avg: 29.7%)
> Pop. over 20 with diabetes: 15.4% — #25 out of 382 (US avg: 10.5%)
> Adults in poor or fair health: 23.2% — #35 out of 382 (US avg: 16.5%)
> Physically unhealthy days a month: 4.8 — #52 out of 382 (US avg: 3.7)
> Median household income: $49,576 — #329 out of 382 (US median: $65,712)
[in-text-ad]
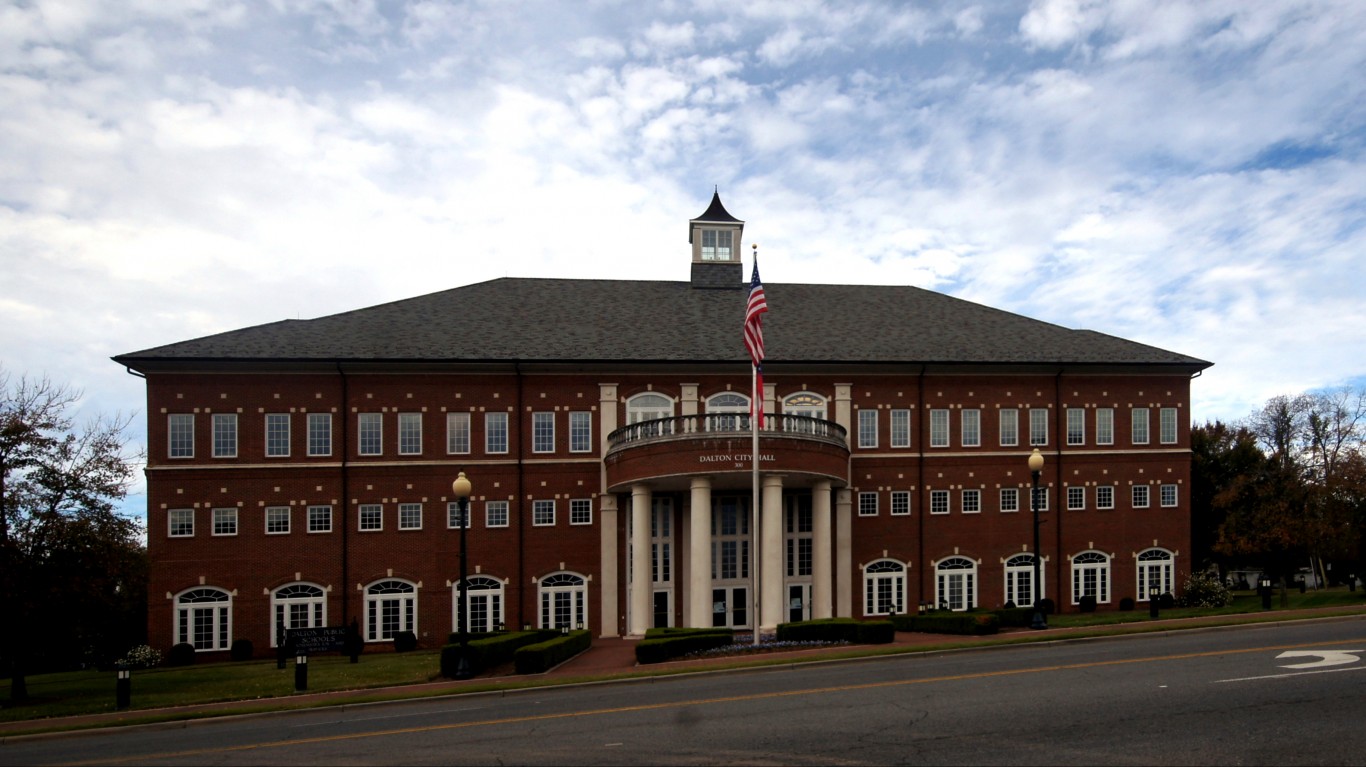
14. Dalton, Georgia
> Adults who don’t exercise: 32.9% (US avg: 22.7%)
> Pop. with access to places for physical activity: 71.8% — #289 out of 382 (US avg: 84.2%)
> Adult obesity rate: 33.9% — #132 out of 382 (US avg: 29.7%)
> Pop. over 20 with diabetes: 15.1% — #30 out of 382 (US avg: 10.5%)
> Adults in poor or fair health: 25.7% — #13 out of 382 (US avg: 16.5%)
> Physically unhealthy days a month: 4.8 — #48 out of 382 (US avg: 3.7)
> Median household income: $51,967 — #293 out of 382 (US median: $65,712)
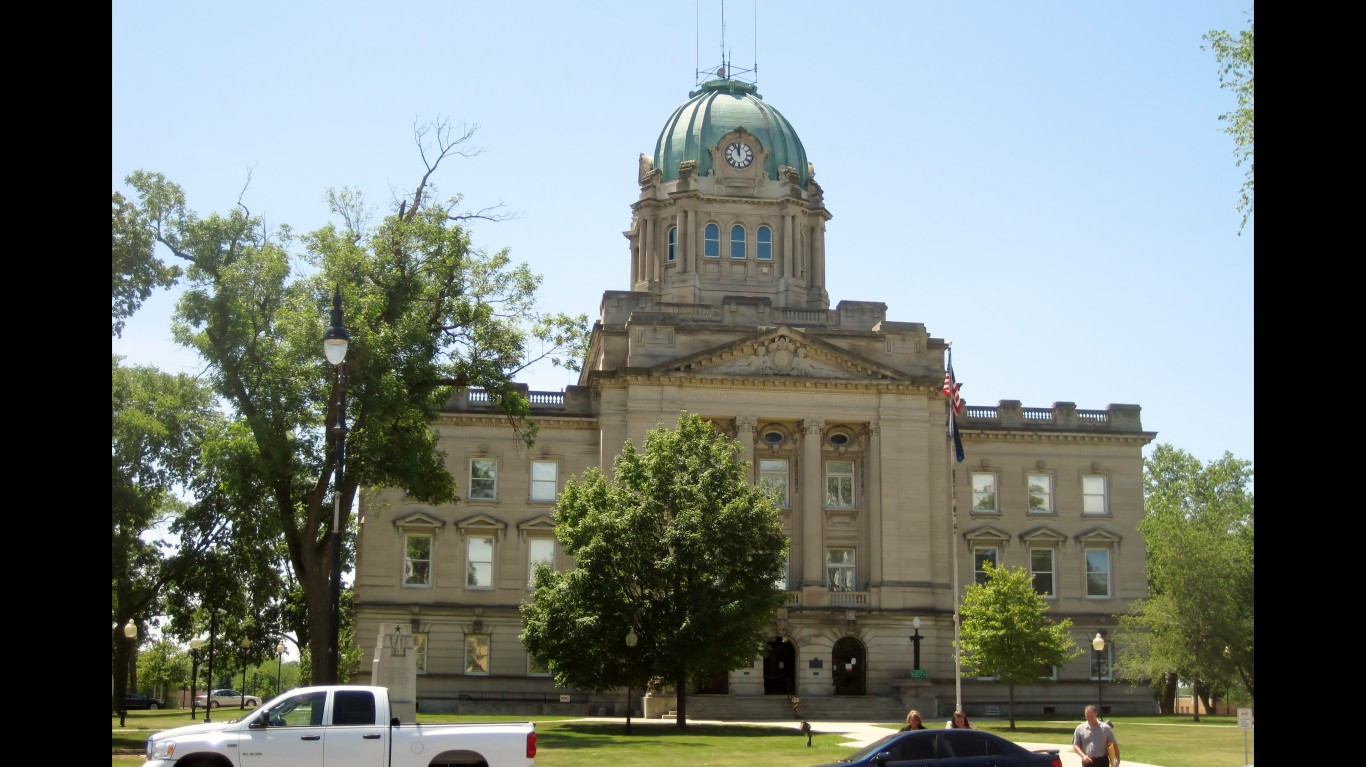
13. Kankakee, Illinois
> Adults who don’t exercise: 33.0% (US avg: 22.7%)
> Pop. with access to places for physical activity: 80.0% — #202 out of 382 (US avg: 84.2%)
> Adult obesity rate: 38.0% — #38 out of 382 (US avg: 29.7%)
> Pop. over 20 with diabetes: 13.2% — #68 out of 382 (US avg: 10.5%)
> Adults in poor or fair health: 19.2% — #165 out of 382 (US avg: 16.5%)
> Physically unhealthy days a month: 4.3 — #145 out of 382 (US avg: 3.7)
> Median household income: $60,923 — #166 out of 382 (US median: $65,712)
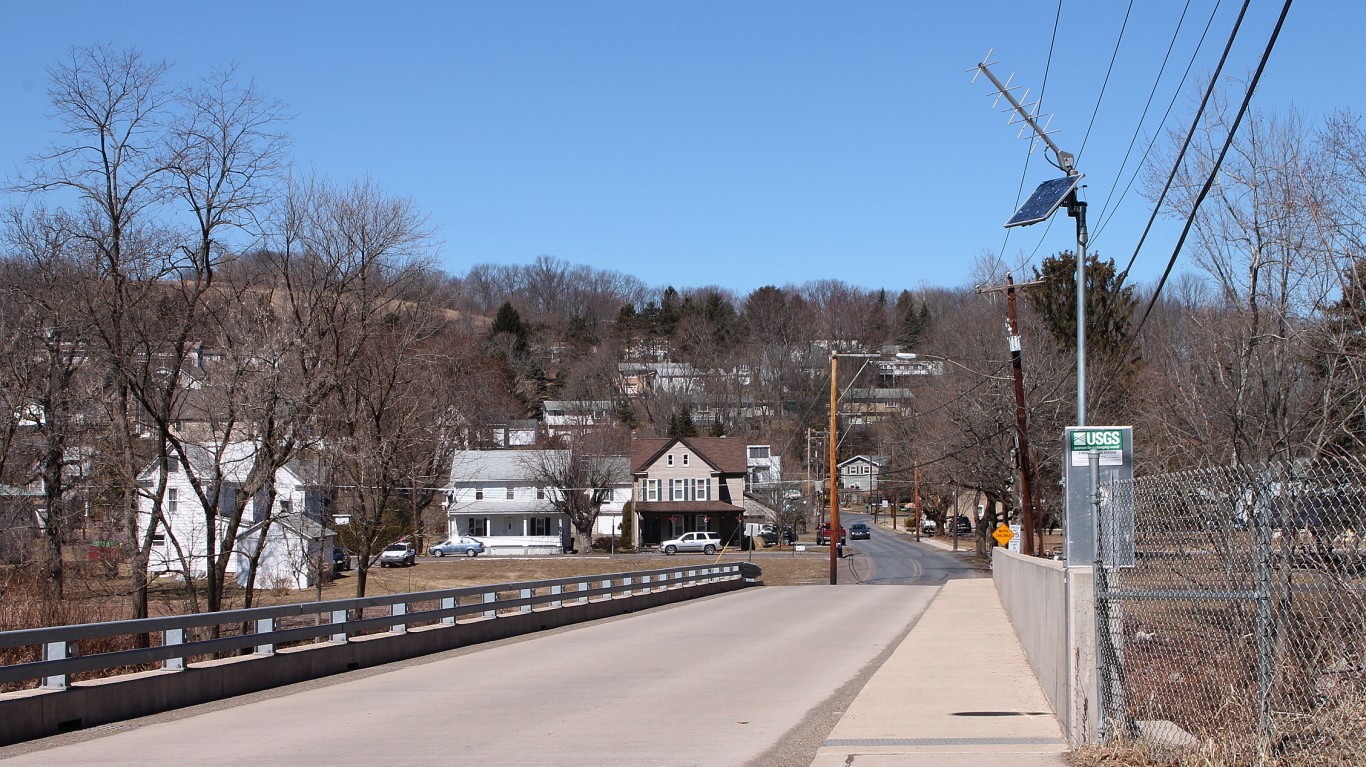
12. Bloomsburg-Berwick, Pennsylvania
> Adults who don’t exercise: 33.0% (US avg: 22.7%)
> Pop. with access to places for physical activity: 73.6% — #274 out of 382 (US avg: 84.2%)
> Adult obesity rate: 35.3% — #91 out of 382 (US avg: 29.7%)
> Pop. over 20 with diabetes: 12.7% — #92 out of 382 (US avg: 10.5%)
> Adults in poor or fair health: 18.0% — #215 out of 382 (US avg: 16.5%)
> Physically unhealthy days a month: 4.2 — #192 out of 382 (US avg: 3.7)
> Median household income: $56,672 — #232 out of 382 (US median: $65,712)
[in-text-ad-2]
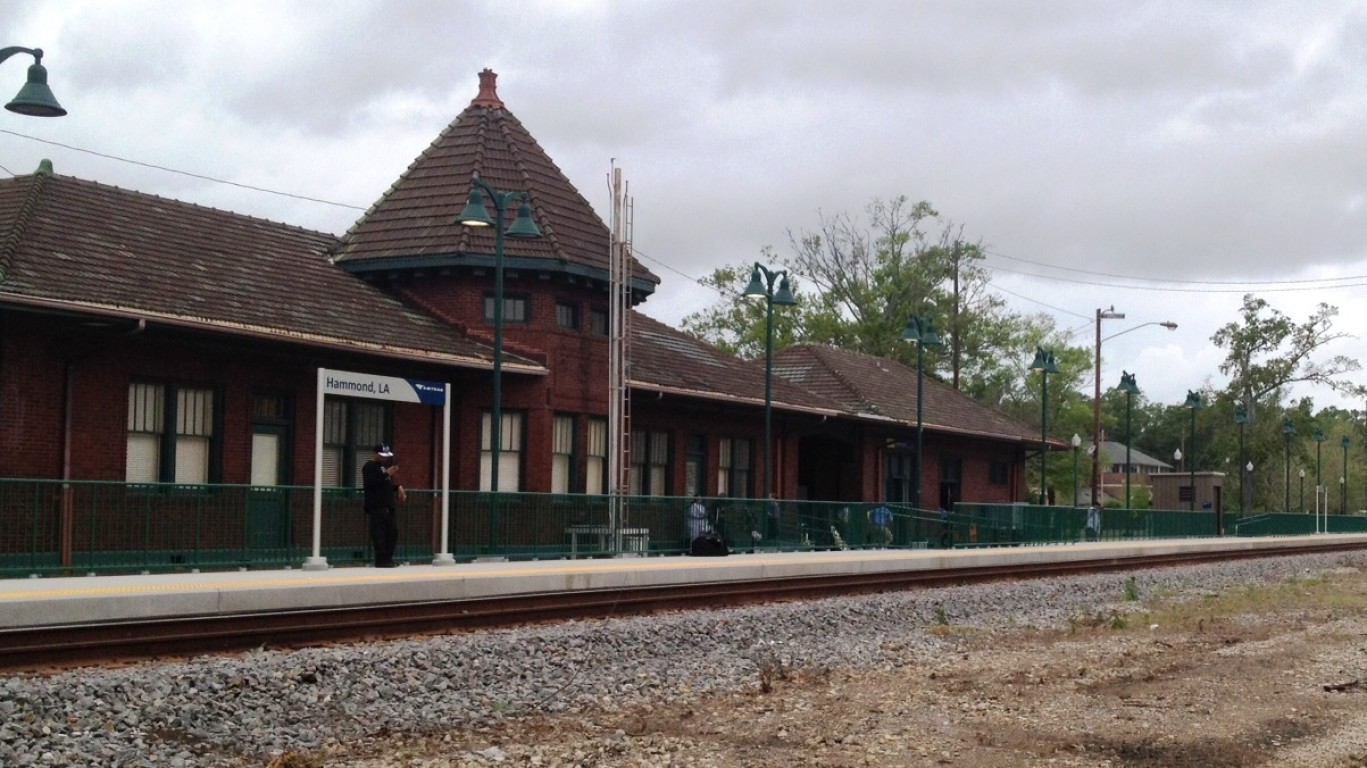
11. Hammond, Louisiana
> Adults who don’t exercise: 33.1% (US avg: 22.7%)
> Pop. with access to places for physical activity: 67.9% — #315 out of 382 (US avg: 84.2%)
> Adult obesity rate: 40.3% — #07 out of 382 (US avg: 29.7%)
> Pop. over 20 with diabetes: 11.7% — #152 out of 382 (US avg: 10.5%)
> Adults in poor or fair health: 23.1% — #38 out of 382 (US avg: 16.5%)
> Physically unhealthy days a month: 4.7 — #65 out of 382 (US avg: 3.7)
> Median household income: $47,825 — #352 out of 382 (US median: $65,712)
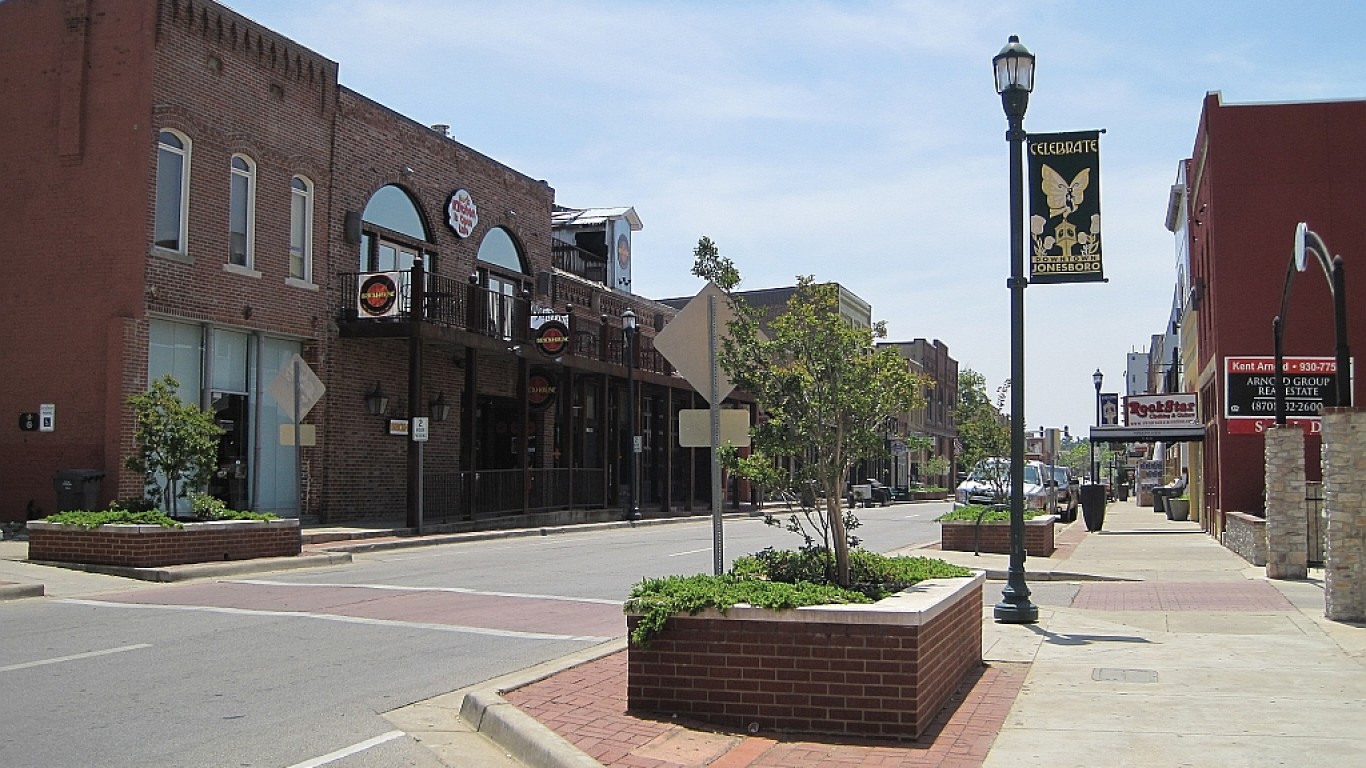
10. Jonesboro, Arkansas
> Adults who don’t exercise: 33.3% (US avg: 22.7%)
> Pop. with access to places for physical activity: 58.3% — #367 out of 382 (US avg: 84.2%)
> Adult obesity rate: 39.7% — #16 out of 382 (US avg: 29.7%)
> Pop. over 20 with diabetes: 15.1% — #31 out of 382 (US avg: 10.5%)
> Adults in poor or fair health: 24.1% — #21 out of 382 (US avg: 16.5%)
> Physically unhealthy days a month: 5.2 — #13 out of 382 (US avg: 3.7)
> Median household income: $44,998 — #368 out of 382 (US median: $65,712)
[in-text-ad]
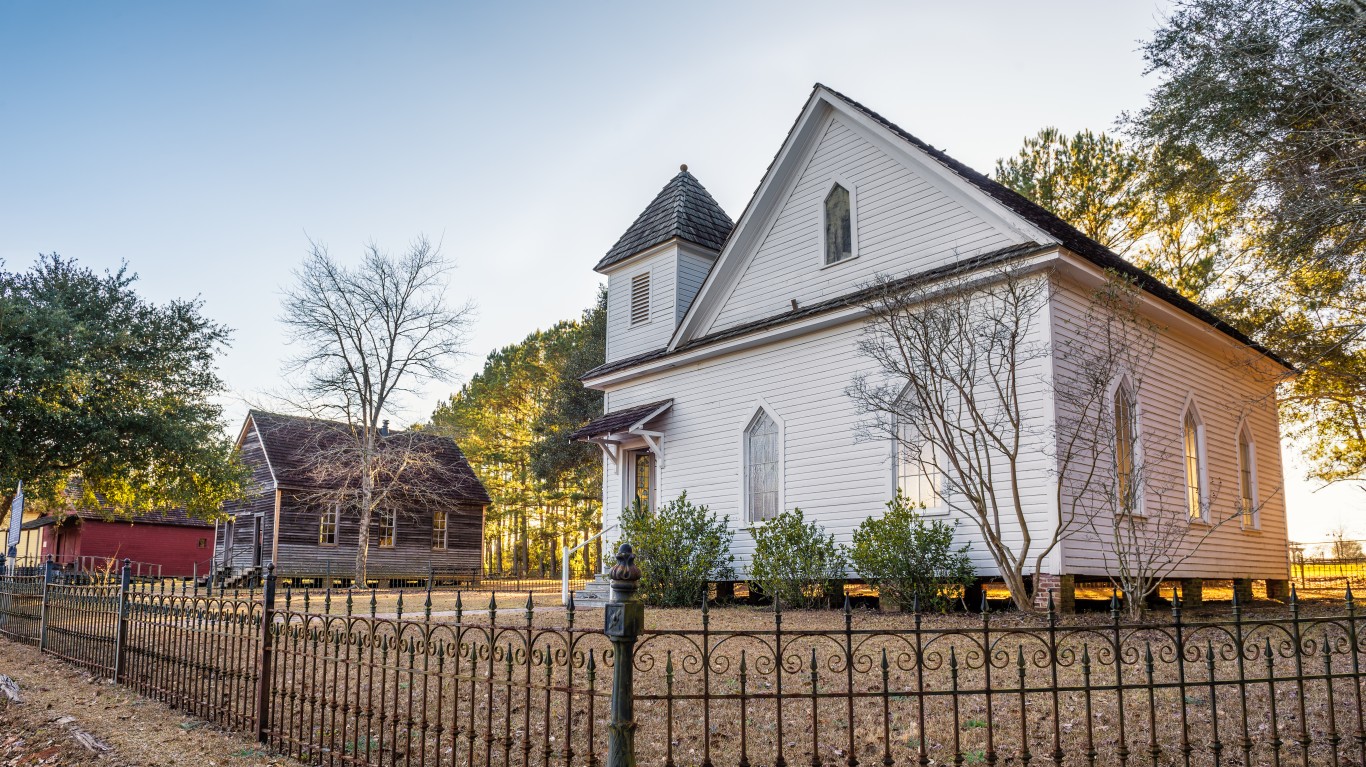
9. Dothan, Alabama
> Adults who don’t exercise: 33.5% (US avg: 22.7%)
> Pop. with access to places for physical activity: 53.1% — #372 out of 382 (US avg: 84.2%)
> Adult obesity rate: 38.6% — #27 out of 382 (US avg: 29.7%)
> Pop. over 20 with diabetes: 16.9% — #09 out of 382 (US avg: 10.5%)
> Adults in poor or fair health: 23.9% — #24 out of 382 (US avg: 16.5%)
> Physically unhealthy days a month: 5.0 — #28 out of 382 (US avg: 3.7)
> Median household income: $50,010 — #323 out of 382 (US median: $65,712)
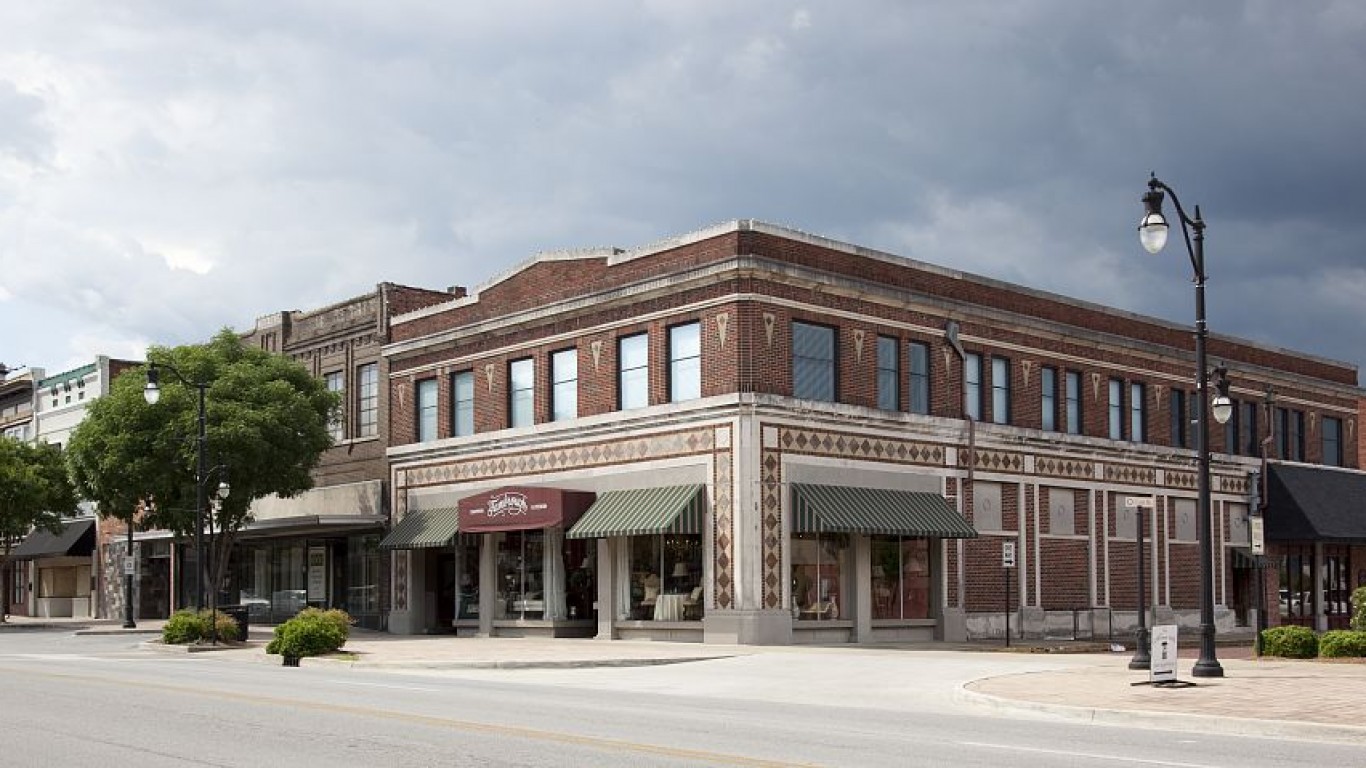
8. Gadsden, Alabama
> Adults who don’t exercise: 33.6% (US avg: 22.7%)
> Pop. with access to places for physical activity: 49.5% — #376 out of 382 (US avg: 84.2%)
> Adult obesity rate: 36.2% — #73 out of 382 (US avg: 29.7%)
> Pop. over 20 with diabetes: 17.3% — #05 out of 382 (US avg: 10.5%)
> Adults in poor or fair health: 22.0% — #64 out of 382 (US avg: 16.5%)
> Physically unhealthy days a month: 4.8 — #51 out of 382 (US avg: 3.7)
> Median household income: $41,447 — #377 out of 382 (US median: $65,712)
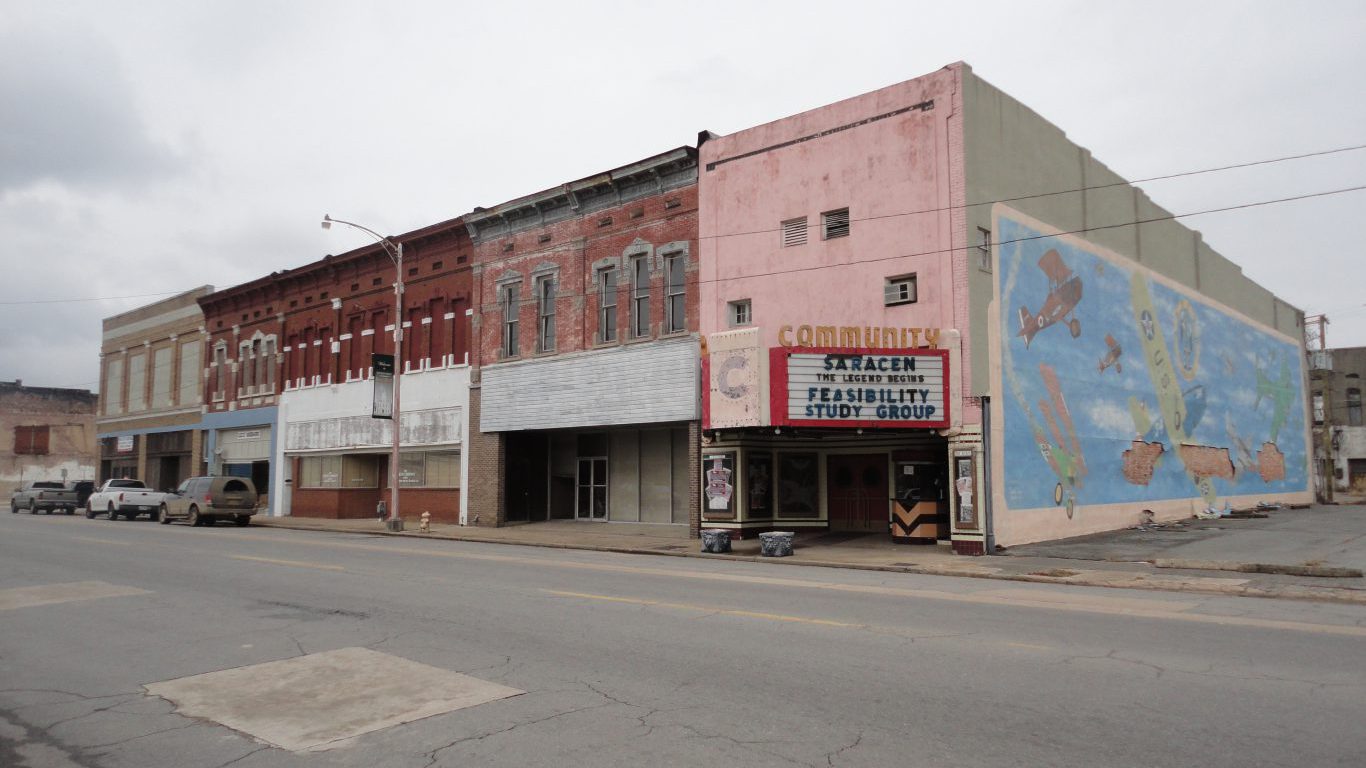
7. Pine Bluff, Arkansas
> Adults who don’t exercise: 33.9% (US avg: 22.7%)
> Pop. with access to places for physical activity: 46.7% — #380 out of 382 (US avg: 84.2%)
> Adult obesity rate: 42.4% — #03 out of 382 (US avg: 29.7%)
> Pop. over 20 with diabetes: 14.7% — #40 out of 382 (US avg: 10.5%)
> Adults in poor or fair health: 28.0% — #07 out of 382 (US avg: 16.5%)
> Physically unhealthy days a month: 5.5 — #03 out of 382 (US avg: 3.7)
> Median household income: $41,541 — #376 out of 382 (US median: $65,712)
[in-text-ad-2]
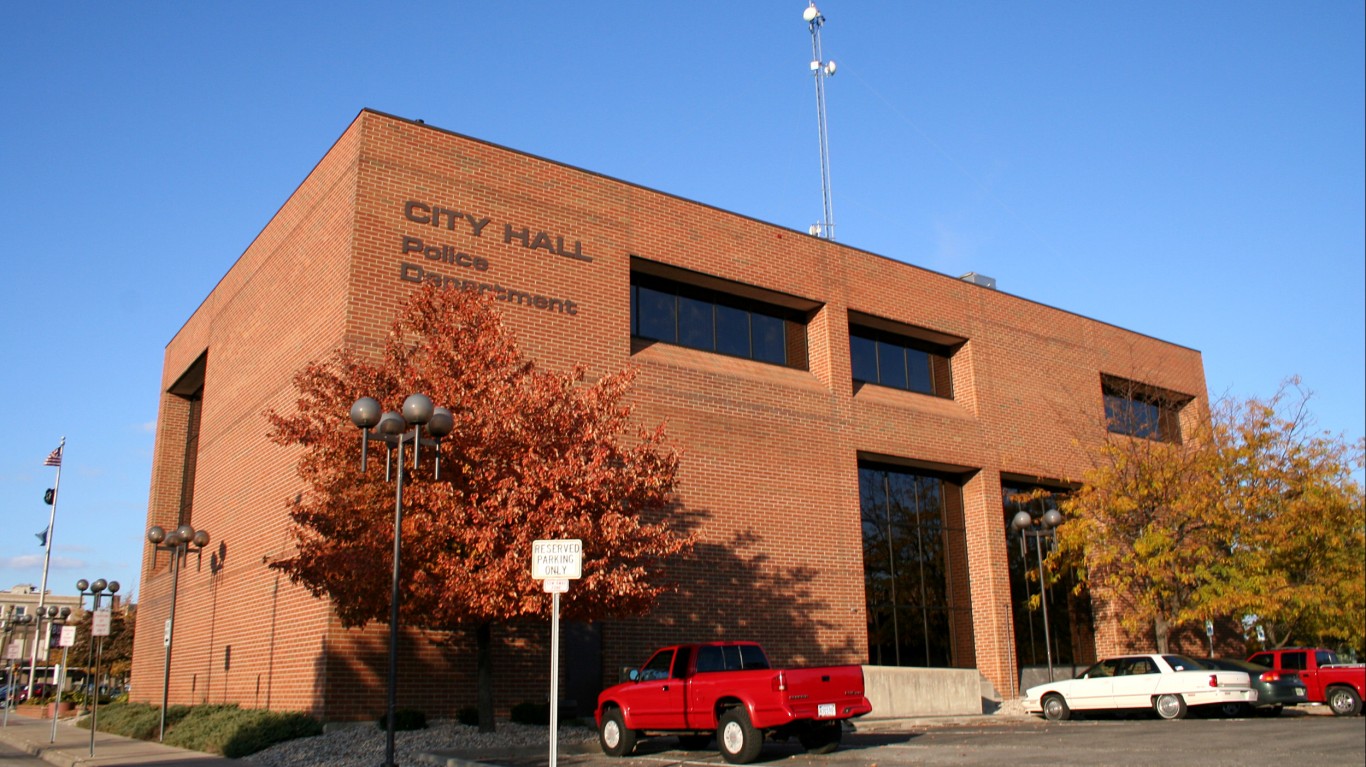
5. Kokomo, Indiana
> Adults who don’t exercise: 34.1% (US avg: 22.7%)
> Pop. with access to places for physical activity: 68.6% — #312 out of 382 (US avg: 84.2%)
> Adult obesity rate: 35.2% — #93 out of 382 (US avg: 29.7%)
> Pop. over 20 with diabetes: 14.8% — #37 out of 382 (US avg: 10.5%)
> Adults in poor or fair health: 20.2% — #120 out of 382 (US avg: 16.5%)
> Physically unhealthy days a month: 4.4 — #132 out of 382 (US avg: 3.7)
> Median household income: $53,440 — #279 out of 382 (US median: $65,712)
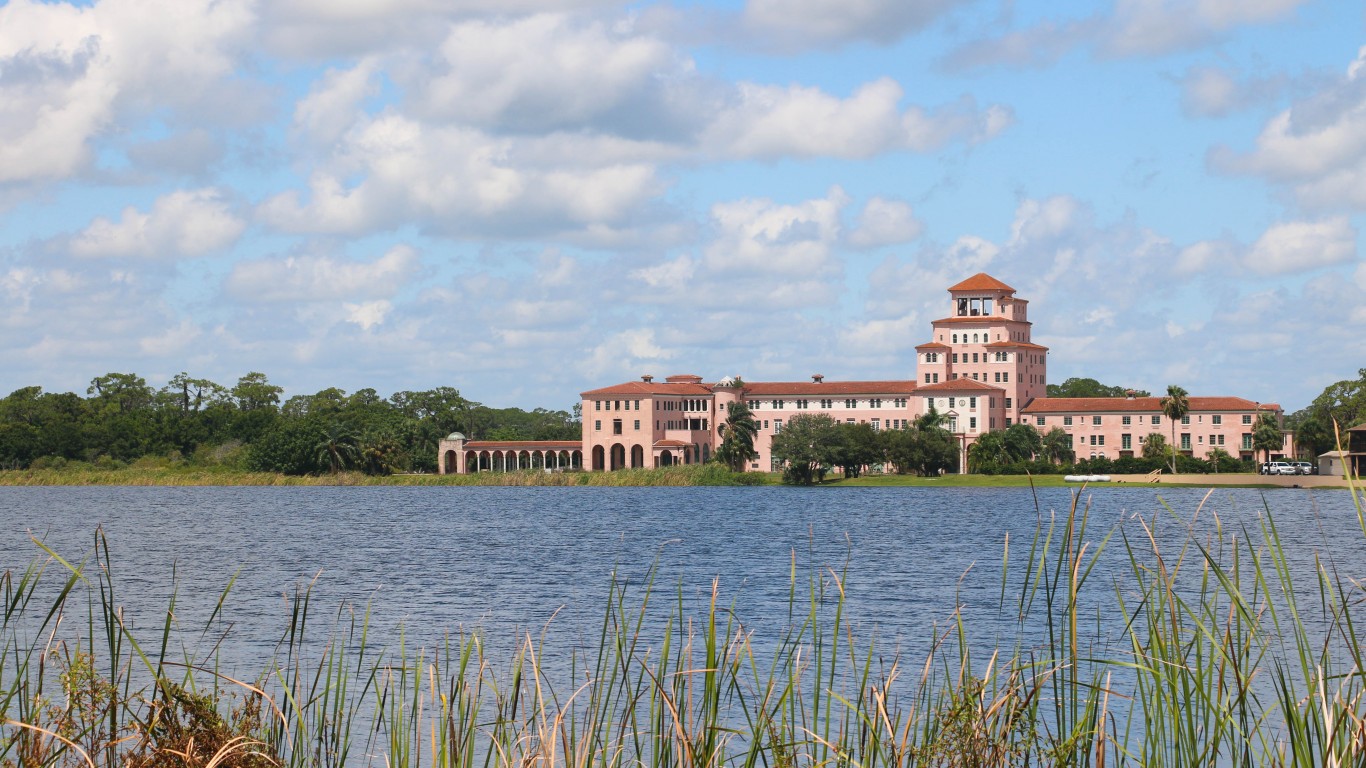
5. Sebring, Florida
> Adults who don’t exercise: 34.1% (US avg: 22.7%)
> Pop. with access to places for physical activity: 81.0% — #188 out of 382 (US avg: 84.2%)
> Adult obesity rate: 30.4% — #242 out of 382 (US avg: 29.7%)
> Pop. over 20 with diabetes: 15.5% — #22 out of 382 (US avg: 10.5%)
> Adults in poor or fair health: 23.2% — #37 out of 382 (US avg: 16.5%)
> Physically unhealthy days a month: 4.8 — #49 out of 382 (US avg: 3.7)
> Median household income: $48,698 — #340 out of 382 (US median: $65,712)
[in-text-ad]
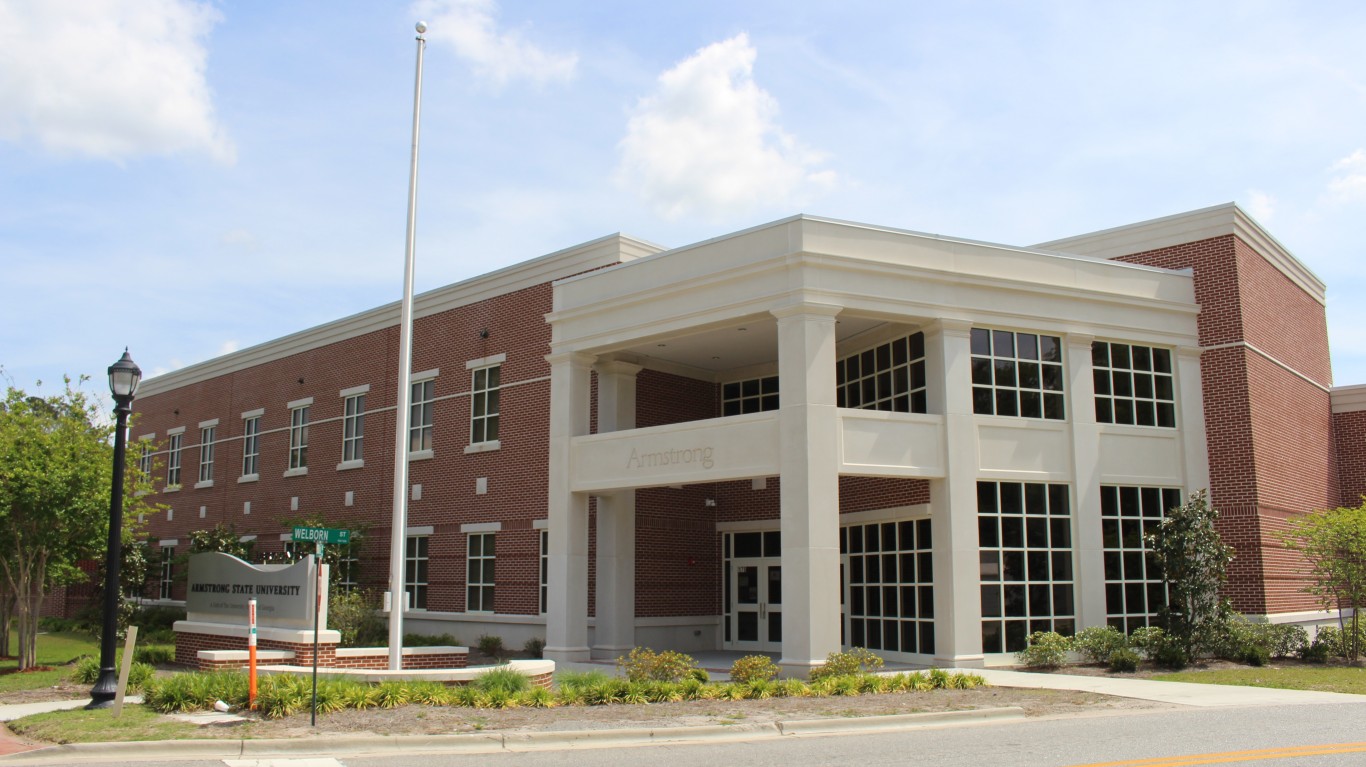
4. Hinesville, Georgia
> Adults who don’t exercise: 34.3% (US avg: 22.7%)
> Pop. with access to places for physical activity: 58.6% — #364 out of 382 (US avg: 84.2%)
> Adult obesity rate: 36.4% — #67 out of 382 (US avg: 29.7%)
> Pop. over 20 with diabetes: 12.3% — #116 out of 382 (US avg: 10.5%)
> Adults in poor or fair health: 22.3% — #54 out of 382 (US avg: 16.5%)
> Physically unhealthy days a month: 4.6 — #82 out of 382 (US avg: 3.7)
> Median household income: $53,060 — #283 out of 382 (US median: $65,712)
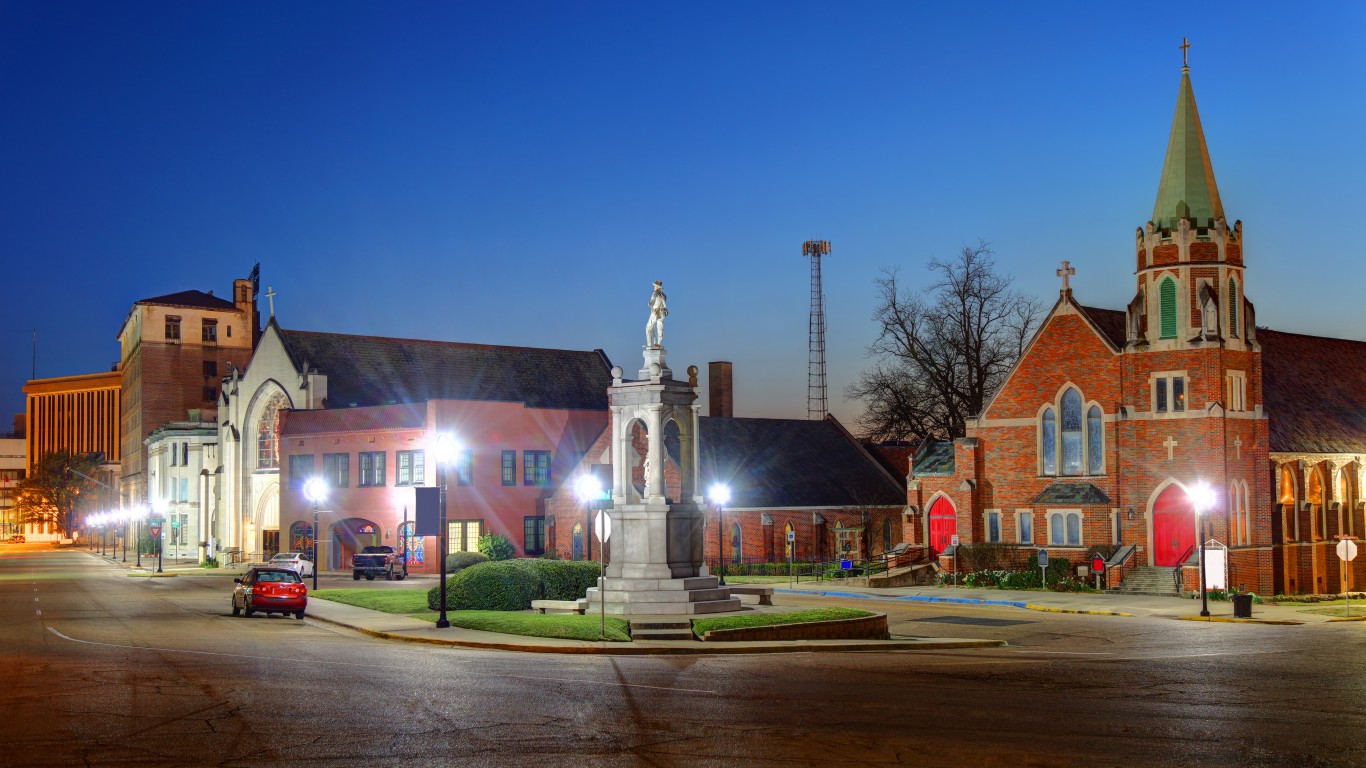
3. Texarkana, Texas
> Adults who don’t exercise: 34.5% (US avg: 22.7%)
> Pop. with access to places for physical activity: 49.7% — #375 out of 382 (US avg: 84.2%)
> Adult obesity rate: 42.8% — #02 out of 382 (US avg: 29.7%)
> Pop. over 20 with diabetes: 15.3% — #28 out of 382 (US avg: 10.5%)
> Adults in poor or fair health: 23.0% — #41 out of 382 (US avg: 16.5%)
> Physically unhealthy days a month: 4.8 — #43 out of 382 (US avg: 3.7)
> Median household income: $51,544 — #300 out of 382 (US median: $65,712)
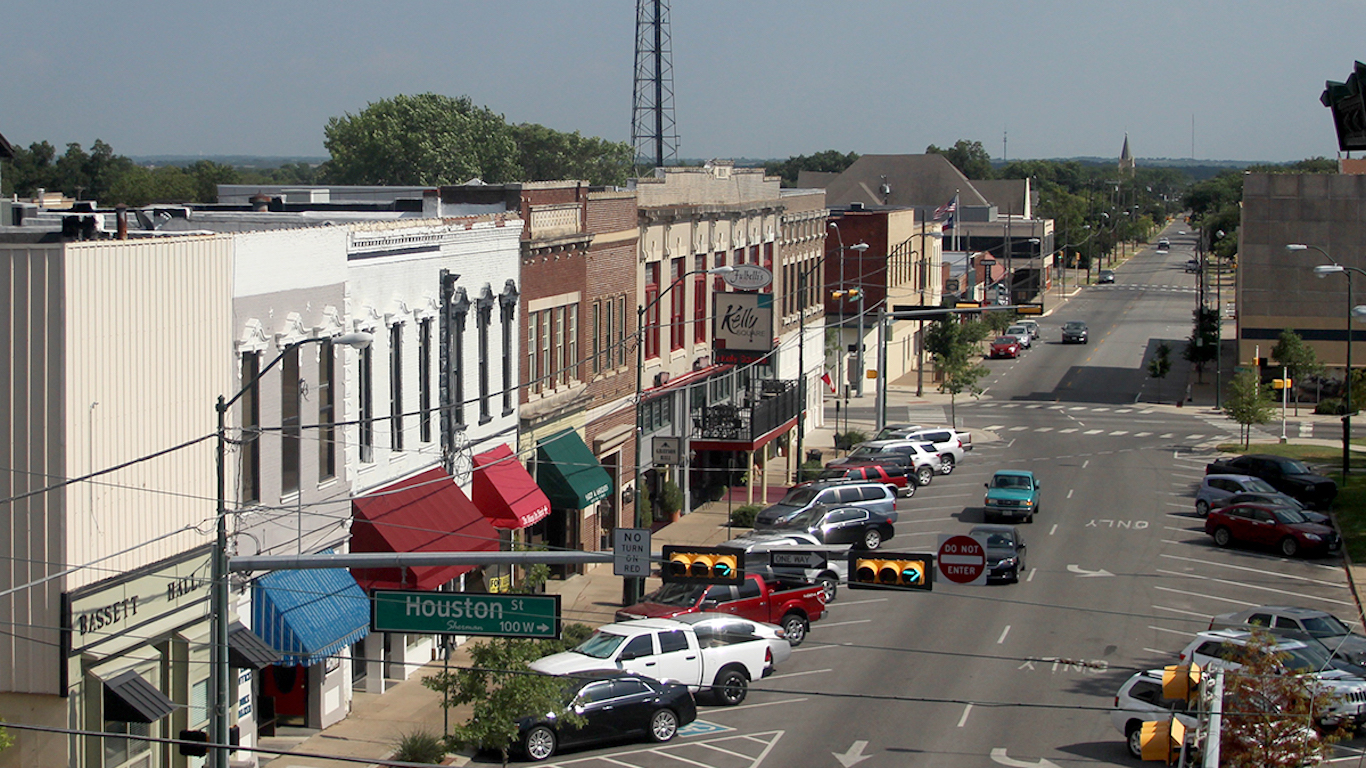
2. Sherman-Denison, Texas
> Adults who don’t exercise: 34.9% (US avg: 22.7%)
> Pop. with access to places for physical activity: 66.6% — #327 out of 382 (US avg: 84.2%)
> Adult obesity rate: 38.1% — #36 out of 382 (US avg: 29.7%)
> Pop. over 20 with diabetes: 11.0% — #187 out of 382 (US avg: 10.5%)
> Adults in poor or fair health: 19.3% — #158 out of 382 (US avg: 16.5%)
> Physically unhealthy days a month: 4.2 — #178 out of 382 (US avg: 3.7)
> Median household income: $57,476 — #217 out of 382 (US median: $65,712)
[in-text-ad-2]

1. Homosassa Springs, Florida
> Adults who don’t exercise: 35.7% (US avg: 22.7%)
> Pop. with access to places for physical activity: 73.3% — #277 out of 382 (US avg: 84.2%)
> Adult obesity rate: 28.7% — #291 out of 382 (US avg: 29.7%)
> Pop. over 20 with diabetes: 13.3% — #66 out of 382 (US avg: 10.5%)
> Adults in poor or fair health: 19.8% — #136 out of 382 (US avg: 16.5%)
> Physically unhealthy days a month: 4.8 — #53 out of 382 (US avg: 3.7)
> Median household income: $50,751 — #309 out of 382 (US median: $65,712)
Are You Ahead, or Behind on Retirement? (sponsor)
If you’re one of the over 4 Million Americans set to retire this year, you may want to pay attention.
Finding a financial advisor who puts your interest first can be the difference between a rich retirement and barely getting by, and today it’s easier than ever. SmartAsset’s free tool matches you with up to three fiduciary financial advisors that serve your area in minutes. Each advisor has been carefully vetted, and must act in your best interests. Start your search now.
Don’t waste another minute; get started right here and help your retirement dreams become a retirement reality.
Thank you for reading! Have some feedback for us?
Contact the 24/7 Wall St. editorial team.
 24/7 Wall St.
 24/7 Wall St.
 24/7 Wall St.
 24/7 Wall St.
 24/7 Wall St.
 24/7 Wall St.
