
Millions of Americans relocate each year, whether to find work, go to college, move to a retirement destination, or for another reason. The year 2020 was no exception. Amid the COVID-19 pandemic, the vast majority of people who relocated moved to an area with lower housing prices, abandoning large cities like New York and Chicago in favor of smaller metro areas where they could better afford to buy a home.
This only continued the yearslong trend of Americans moving from the Northeast and Midwest in favor of the South and West, boosting the populations of a handful of metro areas with thousands of transplants each year. There are 25 metro areas in the U.S. whose populations have grown by more than 17% in the past decade due to net migration alone.
To determine the cities Americans are flocking to, 24/7 Wall St. reviewed data from the U.S. Census Bureau’s Population Estimates Program. Cities were ranked based on the percentage increase in population due to net migration from April 1, 2010, to July 1, 2020.
A total of 13 of the 25 cities with the fastest population growth due to net migration are in Florida. The Sunshine State is known as a top retirement destination due to its low tax burden, relatively inexpensive housing, and year-round warm weather. These factors convinced thousands of Americans — many of them older — to move to Florida. Many of the other states that are growing the fastest due to net migration have similar qualities. These are the best and worst states for a healthy retirement.
South Carolina, North Carolina, and Idaho are the only other states with multiple metro areas on this list. Regionally, 19 cities on the list are in the South and six are in the West. No city in the Midwest or the Northeast ranks anywhere among the top 25 — or even top 50 — cities Americans are flocking to.
Click here see the cities Americans are flocking to.

25. Ocala, FL
> Population change due to migration, 2010-2020: +17.3% (+57,293)
> Overall population change, 2010-2020: +12.7% (+42,217)
> Change in employed population, 2010-2020: +17.2% (+15,500)
> 2020 population estimate: 373,513
[in-text-ad]

24. Charleston-North Charleston, SC
> Population change due to migration, 2010-2020: +17.4% (+115,721)
> Overall population change, 2010-2020: +23.3% (+155,058)
> Change in employed population, 2010-2020: +23.2% (+66,700)
> 2020 population estimate: 819,705

23. Crestview-Fort Walton Beach-Destin, FL
> Population change due to migration, 2010-2020: +17.8% (+41,889)
> Overall population change, 2010-2020: +22.7% (+53,600)
> Change in employed population, 2010-2020: +18.6% (+18,100)
> 2020 population estimate: 289,468

22. Raleigh-Cary, NC
> Population change due to migration, 2010-2020: +18.0% (+203,158)
> Overall population change, 2010-2020: +25.6% (+289,897)
> Change in employed population, 2010-2020: +25.6% (+127,400)
> 2020 population estimate: 1,420,376
[in-text-ad-2]

21. Hilton Head Island-Bluffton, SC
> Population change due to migration, 2010-2020: +18.2% (+34,029)
> Overall population change, 2010-2020: +21.5% (+40,234)
> Change in employed population, 2010-2020: +21.1% (+13,900)
> 2020 population estimate: 227,244

20. Orlando-Kissimmee-Sanford, FL
> Population change due to migration, 2010-2020: +18.3% (+391,639)
> Overall population change, 2010-2020: +23.7% (+504,973)
> Change in employed population, 2010-2020: +20.8% (+206,200)
> 2020 population estimate: 2,639,374
[in-text-ad]

19. Boise City, ID
> Population change due to migration, 2010-2020: +18.6% (+114,539)
> Overall population change, 2010-2020: +24.9% (+153,787)
> Change in employed population, 2010-2020: +35.7% (+90,500)
> 2020 population estimate: 770,353

18. Prescott Valley-Prescott, AZ
> Population change due to migration, 2010-2020: +19.0% (+40,097)
> Overall population change, 2010-2020: +13.8% (+29,218)
> Change in employed population, 2010-2020: +15.4% (+8,500)
> 2020 population estimate: 240,226

17. Homosassa Springs, FL
> Population change due to migration, 2010-2020: +19.2% (+27,055)
> Overall population change, 2010-2020: +8.3% (+11,781)
> Change in employed population, 2010-2020: +-4.2% (+-1,400)
> 2020 population estimate: 153,010
[in-text-ad-2]
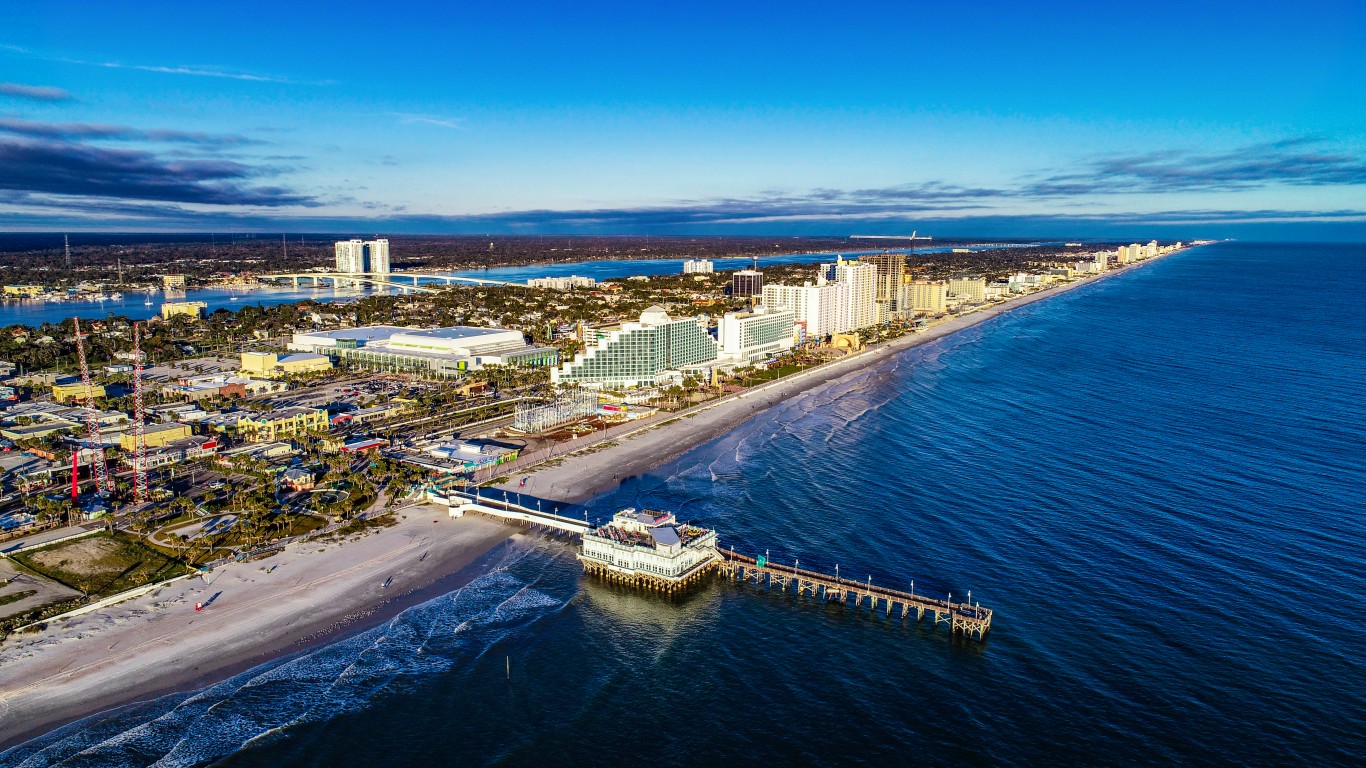
16. Deltona-Daytona Beach-Ormond Beach, FL
> Population change due to migration, 2010-2020: +19.5% (+115,169)
> Overall population change, 2010-2020: +15.2% (+89,665)
> Change in employed population, 2010-2020: +15.3% (+26,300)
> 2020 population estimate: 679,948
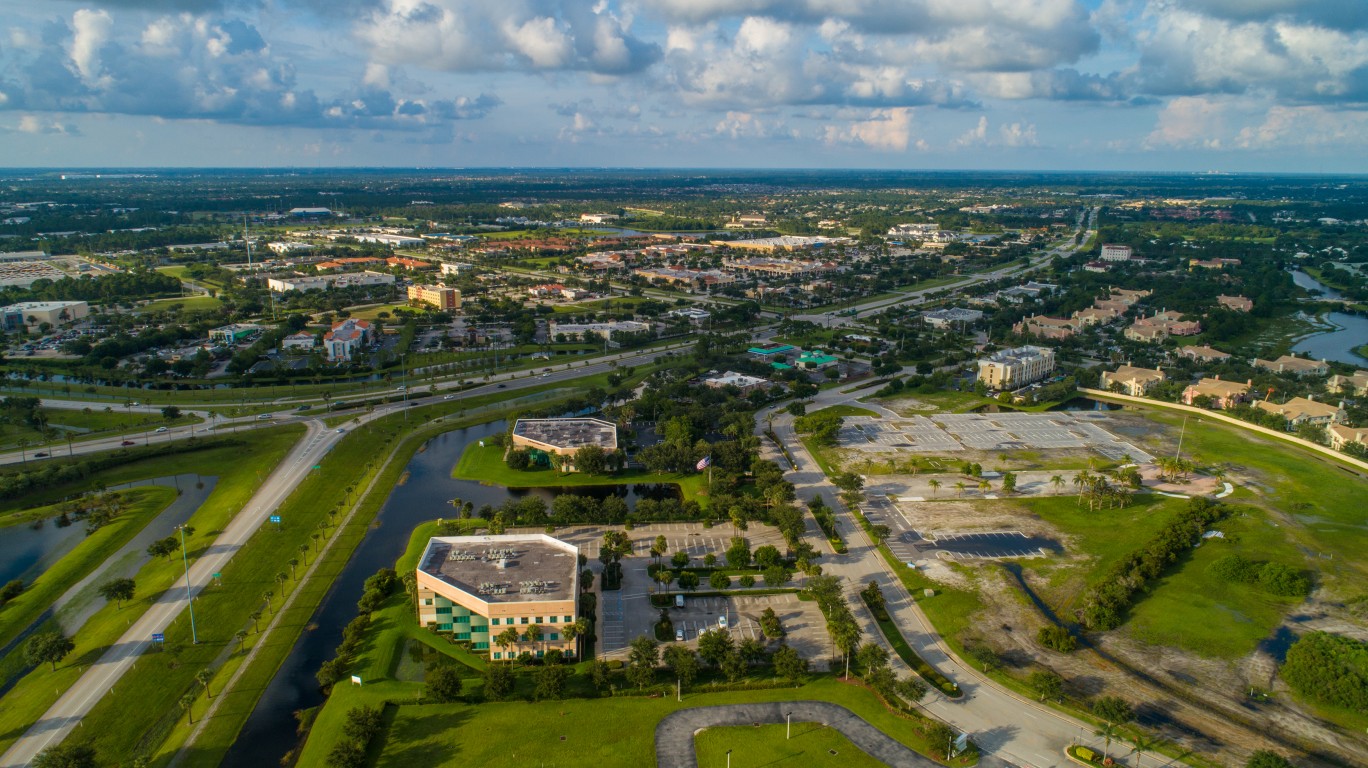
15. Port St. Lucie, FL
> Population change due to migration, 2010-2020: +19.5% (+82,838)
> Overall population change, 2010-2020: +17.7% (+75,166)
> Change in employed population, 2010-2020: +24.2% (+29,400)
> 2020 population estimate: 499,274
[in-text-ad]

14. Coeur d’Alene, ID
> Population change due to migration, 2010-2020: +20.3% (+28,134)
> Overall population change, 2010-2020: +23.2% (+32,162)
> Change in employed population, 2010-2020: +27.0% (+14,300)
> 2020 population estimate: 170,628
 24/7 Wall St.
13. Lakeland-Winter Haven, FL
> Population change due to migration, 2010-2020: +22.0% (+132,537)
> Overall population change, 2010-2020: +23.7% (+142,484)
> Change in employed population, 2010-2020: +24.2% (+46,200)
> 2020 population estimate: 744,552

12. Greeley, CO
> Population change due to migration, 2010-2020: +22.3% (+56,262)
> Overall population change, 2010-2020: +32.1% (+81,147)
> Change in employed population, 2010-2020: +34.6% (+27,100)
> 2020 population estimate: 333,983
[in-text-ad-2]

11. Naples-Marco Island, FL
> Population change due to migration, 2010-2020: +22.4% (+72,076)
> Overall population change, 2010-2020: +22.2% (+71,459)
> Change in employed population, 2010-2020: +33.5% (+37,200)
> 2020 population estimate: 392,973

10. Sebastian-Vero Beach, FL
> Population change due to migration, 2010-2020: +23.0% (+31,790)
> Overall population change, 2010-2020: +17.7% (+24,490)
> Change in employed population, 2010-2020: +17.9% (+7,900)
> 2020 population estimate: 162,518
[in-text-ad]

9. Austin-Round Rock-Georgetown, TX
> Population change due to migration, 2010-2020: +23.9% (+410,335)
> Overall population change, 2010-2020: +33.7% (+578,996)
> Change in employed population, 2010-2020: +38.3% (+300,600)
> 2020 population estimate: 2,295,303

8. Daphne-Fairhope-Foley, AL
> Population change due to migration, 2010-2020: +24.9% (+45,301)
> Overall population change, 2010-2020: +25.8% (+47,024)
> Change in employed population, 2010-2020: +25.0% (+15,300)
> 2020 population estimate: 229,287

7. Bend, OR
> Population change due to migration, 2010-2020: +25.5% (+40,225)
> Overall population change, 2010-2020: +27.9% (+44,041)
> Change in employed population, 2010-2020: +35.4% (+21,700)
> 2020 population estimate: 201,769
[in-text-ad-2]

6. North Port-Sarasota-Bradenton, FL
> Population change due to migration, 2010-2020: +26.1% (+183,136)
> Overall population change, 2010-2020: +21.7% (+152,378)
> Change in employed population, 2010-2020: +26.1% (+61,900)
> 2020 population estimate: 854,684

5. St. George, UT
> Population change due to migration, 2010-2020: +26.7% (+36,905)
> Overall population change, 2010-2020: +33.9% (+46,798)
> Change in employed population, 2010-2020: +54.7% (+25,100)
> 2020 population estimate: 184,913
[in-text-ad]
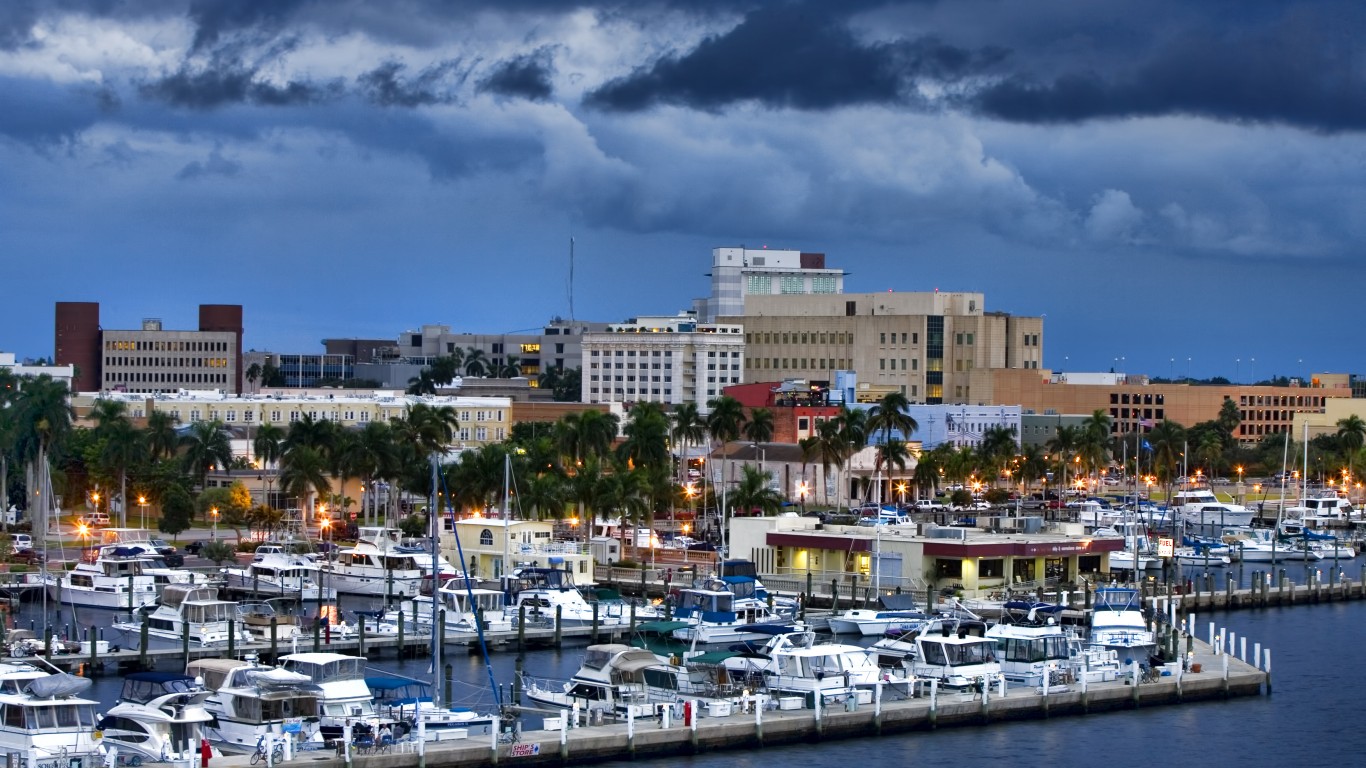
4. Cape Coral-Fort Myers, FL
> Population change due to migration, 2010-2020: +28.1% (+174,050)
> Overall population change, 2010-2020: +27.8% (+172,006)
> Change in employed population, 2010-2020: +34.9% (+69,200)
> 2020 population estimate: 790,767
 24/7 Wall St.
3. Punta Gorda, FL
> Population change due to migration, 2010-2020: +31.3% (+50,133)
> Overall population change, 2010-2020: +21.7% (+34,737)
> Change in employed population, 2010-2020: +16.4% (+6,800)
> 2020 population estimate: 194,711

2. Myrtle Beach-Conway-North Myrtle Beach, SC-NC
> Population change due to migration, 2010-2020: +37.8% (+142,172)
> Overall population change, 2010-2020: +36.6% (+137,923)
> Change in employed population, 2010-2020: +15.0% (+21,100)
> 2020 population estimate: 514,488
[in-text-ad-2]
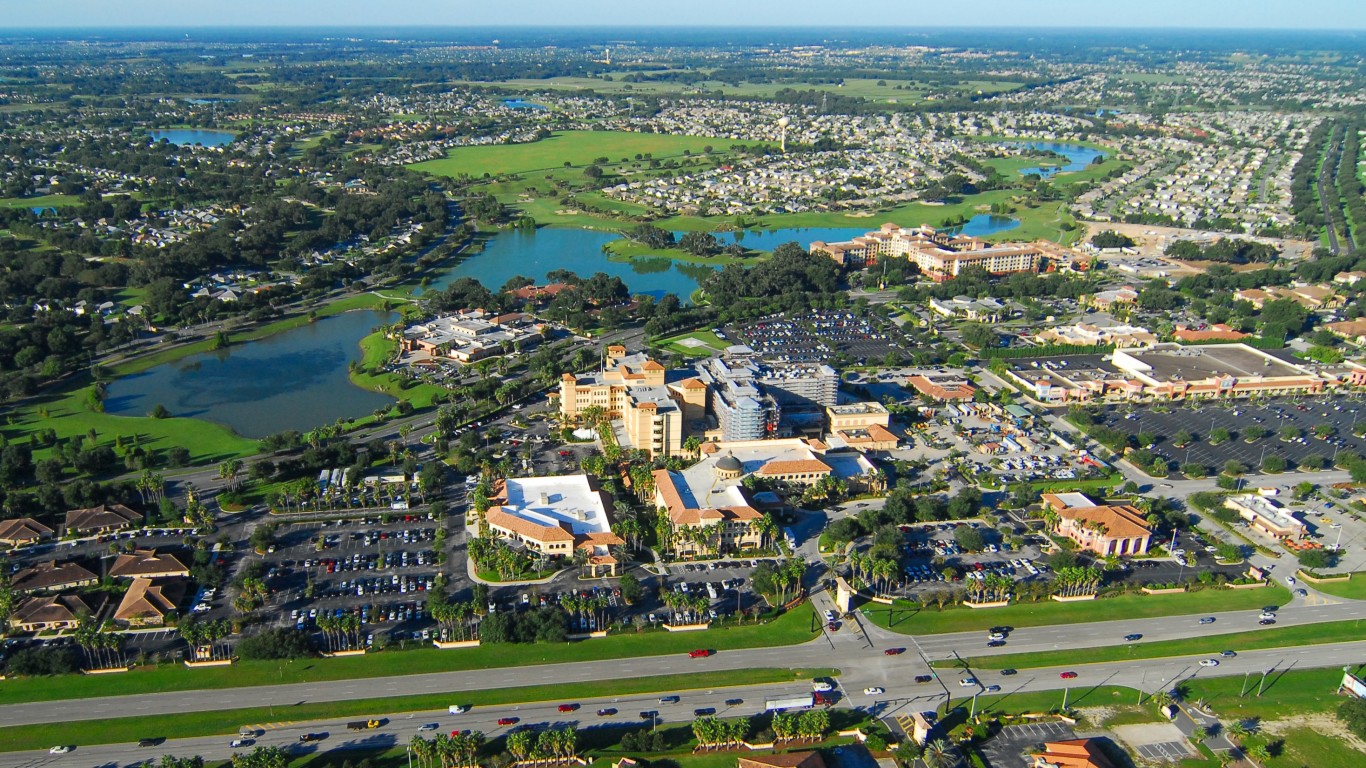
1. The Villages, FL
> Population change due to migration, 2010-2020: +61.5% (+57,449)
> Overall population change, 2010-2020: +48.8% (+45,598)
> Change in employed population, 2010-2020: +50.0% (+10,500)
> 2020 population estimate: 139,018
Methodology
To determine the cities Americans are flocking to, 24/7 Wall St. reviewed data from the U.S. Census Bureau’s Population Estimates Program. Cities were ranked based on the percentage increase in population due to net migration from April 1, 2010 to July 1, 2020. Supplemental data on total employment used to calculate employment growth from 2010 to 2020 came from the Bureau of Labor Statistics’ Current Employment Statistics program.
Take Charge of Your Retirement: Find the Right Financial Advisor For You in Minutes (Sponsor)
Retirement planning doesn’t have to feel overwhelming. The key is finding professional guidance—and we’ve made it easier than ever for you to connect with the right financial advisor for your unique needs.
Here’s how it works:
1️ Answer a Few Simple Questions
Tell us a bit about your goals and preferences—it only takes a few minutes!
2️ Get Your Top Advisor Matches
This tool matches you with qualified advisors who specialize in helping people like you achieve financial success.
3️ Choose Your Best Fit
Review their profiles, schedule an introductory meeting, and select the advisor who feels right for you.
Why wait? Start building the retirement you’ve always dreamed of. Click here to get started today!
Thank you for reading! Have some feedback for us?
Contact the 24/7 Wall St. editorial team.
Latest from 24/7


Our expert who first called NVIDIA in 2009 is predicting 2025 will see a historic AI breakthrough.
You can follow him investing $500,000 of his own money on our top AI stocks for free.