
Obesity is a public health problem in the U.S. and for years one of the most frequently mentioned recommendations to address the country’s growing weight problem has been for people to exercise more. And most of them seem to have listened.
In 2018, 53.3% of adult Americans met the U.S. government’s weekly exercise recommendation, the highest on record and up from 41.4% in 2006, according to the National Center for Health Statistics’ National Health Interview Survey.
The Department of Health and Human Services recommends adults do at least 150 minutes a week of moderate to intense exercise — about 20 minutes a day.
About 22.7% of Americans don’t engage in regular physical activity during their leisure time. Of course, exercise habits vary widely from state to state, and even more so from city to city.
To identify the cities where residents are getting the least amount of exercise, 24/7 Tempo reviewed the percentage of adults who are not physically active in all 382 metro areas in the United States. The measure came from the 2021 County Health Rankings & Roadmaps, a collaboration between the Robert Wood Johnson Foundation and the University of Wisconsin Population Health Institute.
For the most part, even the laziest cities are representative of their state. The laziest cities in states with the highest rates of physical inactivity tend to rank among the least active cities nationwide. And while most cities on this list have a higher inactivity rate than their respective state, four cities have a lower share of adults who do not exercise in their leisure time than their respective state.
Exercise habits are related to a variety of factors. One of them appears to be income. Metro areas where residents have lower incomes frequently have lower levels of physical activity and worse health outcomes overall, including higher rates of adult obesity and diabetes.
Regular physical activity has been shown to be an important factor in maintaining a healthy weight as it helps the body lose fat and build muscle tissue. Of the 50 metro areas on the list, only seven have an adult obesity rate that is lower than the adult obesity rate of their state. Ten cities have a lower diabetes rate than their respective states.
All but eight cities on this list have a higher share of the adult population who report being in poor or fair health compared to their home state.
In addition to living longer, regular physical activity is also linked to better quality of life. Some research shows that even just 15 minutes a day provide benefits, including lower risk of heart disease, diabetes, and some common types of cancer. These are the states where life expectancy was declining even before the pandemic.
Click here to see the couch potato capital of every state
To identify the cities where residents are getting the least amount of exercise, 24/7 Tempo reviewed data about the share of adults who are not physically active in all 382 metro areas in the United States. The measure came from the 2021 County Health Rankings & Roadmaps, a collaboration between the Robert Wood Johnson Foundation and the University of Wisconsin Population Health Institute.
Obesity rates — the share of adult residents who report a body mass index of 30 or greater — as well as the share of adults who have access to exercise facilities and the share of the population reporting to be in fair or poor health also came from the 2021 CHR.
Population figures, median household income, and poverty rate came from the American Community Survey 2019 5-Year Estimates.

Alabama: Gadsden
> Adults who don’t exercise: 33.6% (state: 29.3%)
> Pop. with access to places for physical activity: 49.5% (state: 61.1%)
> Adult obesity rate: 36.2% (state: 36.1%)
> Pop. over 20 with diabetes: 17.3% (state: 14.5%)
> Adults in poor or fair health: 22.0% (state: 21.4%)
> Physically unhealthy days: 4.8 per month (state: 4.4 per month)
> Median household income: $41,447 (state: $51,734)
> Population: 102,268
[in-text-ad]

Alaska: Fairbanks
> Adults who don’t exercise: 18.2% (state: 19.3%)
> Pop. with access to places for physical activity: 100.0% (state: 100.0%)
> Adult obesity rate: 31.0% (state: 31.9%)
> Pop. over 20 with diabetes: 7.1% (state: 8.3%)
> Adults in poor or fair health: 14.0% (state: 15.6%)
> Physically unhealthy days: 4.0 per month (state: 4.1 per month)
> Median household income: $72,065 (state: $75,463)
> Population: 96,849
 24/7 Wall St.
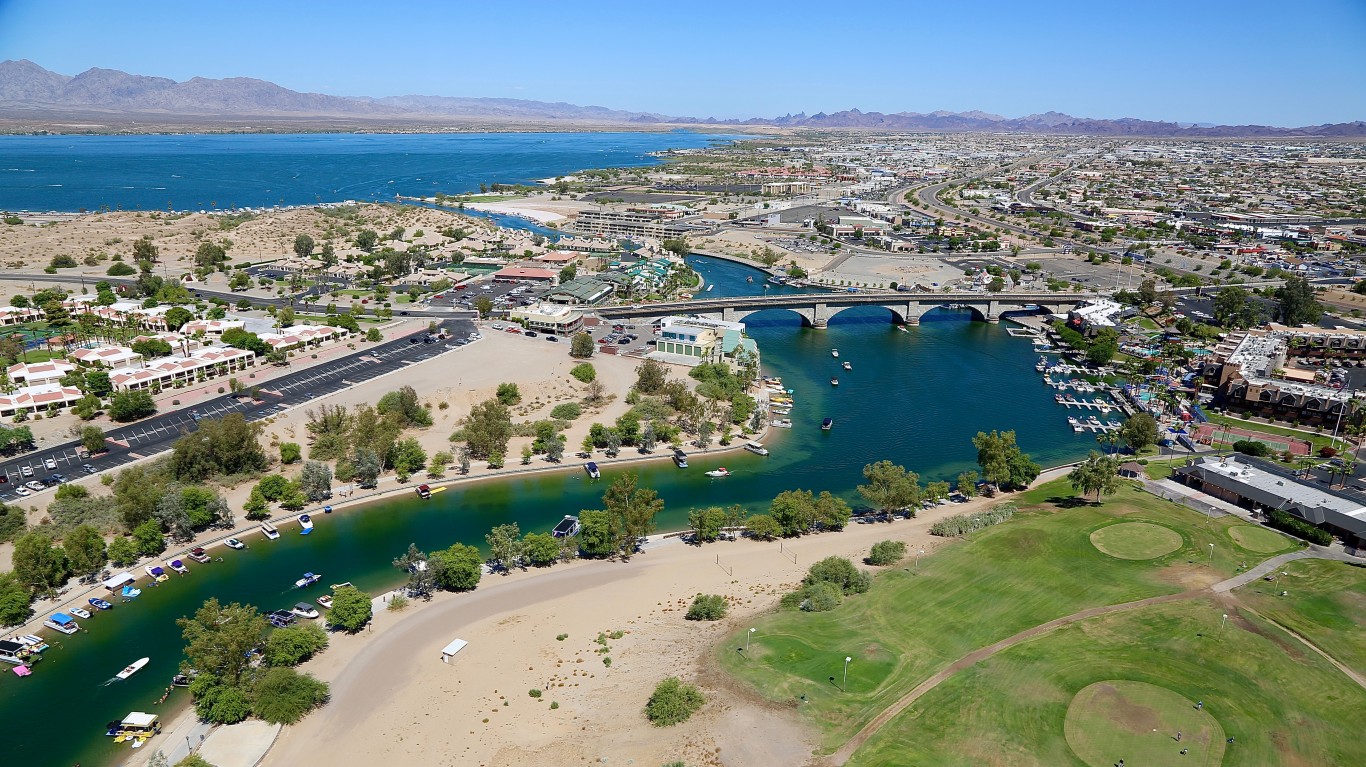
Arizona: Lake Havasu City-Kingman
> Adults who don’t exercise: 32.2% (state: 21.2%)
> Pop. with access to places for physical activity: 58.6% (state: 85.1%)
> Adult obesity rate: 30.7% (state: 27.9%)
> Pop. over 20 with diabetes: 14.0% (state: 9.6%)
> Adults in poor or fair health: 22.5% (state: 18.6%)
> Physically unhealthy days: 5.0 per month (state: 4.2 per month)
> Median household income: $50,179 (state: $62,055)
> Population: 212,181
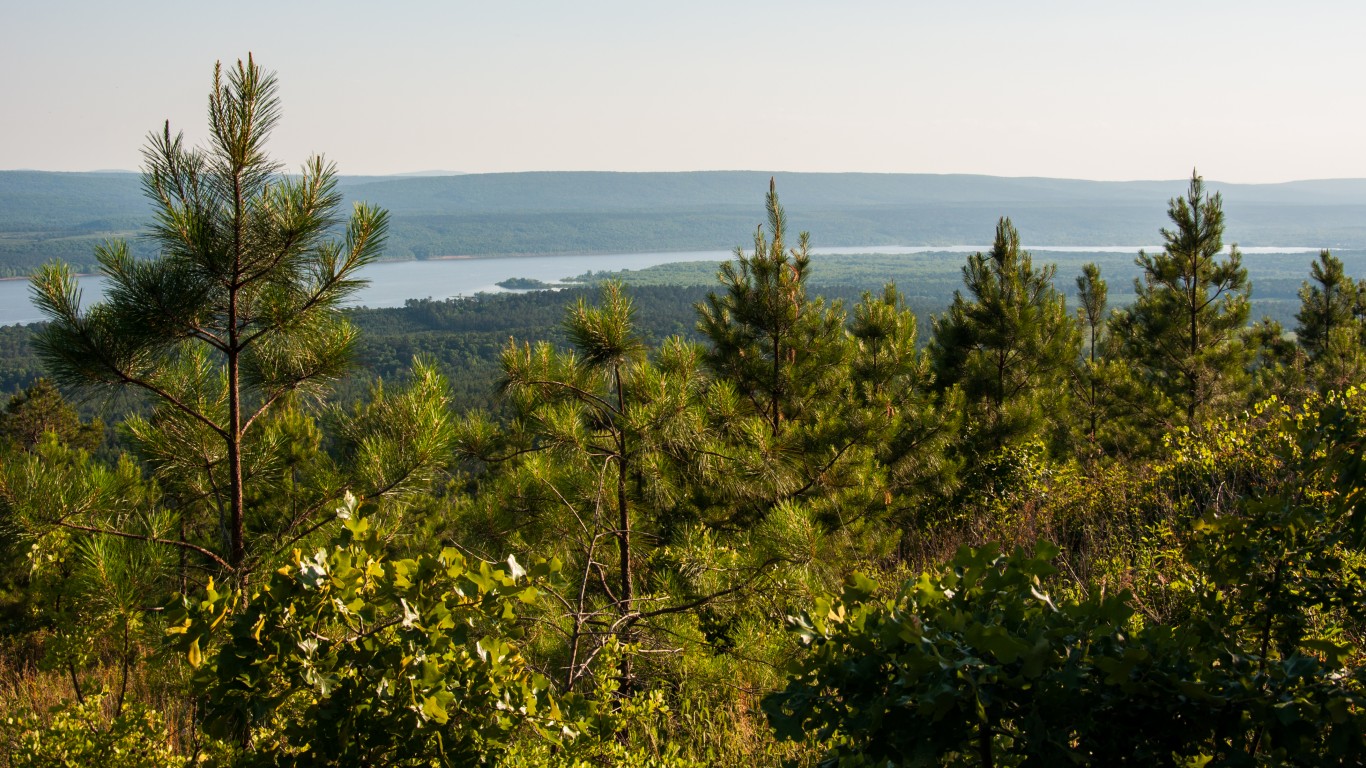
Arkansas: Pine Bluff
> Adults who don’t exercise: 33.9% (state: 30.4%)
> Pop. with access to places for physical activity: 46.7% (state: 63.5%)
> Adult obesity rate: 42.4% (state: 35.0%)
> Pop. over 20 with diabetes: 14.7% (state: 13.5%)
> Adults in poor or fair health: 28.0% (state: 23.3%)
> Physically unhealthy days: 5.5 per month (state: 4.8 per month)
> Median household income: $41,541 (state: $48,952)
> Population: 89,437
[in-text-ad-2]

California: Yuba City
> Adults who don’t exercise: 30.5% (state: 17.7%)
> Pop. with access to places for physical activity: 76.1% (state: 93.1%)
> Adult obesity rate: 29.6% (state: 24.3%)
> Pop. over 20 with diabetes: 12.9% (state: 8.8%)
> Adults in poor or fair health: 21.7% (state: 17.6%)
> Physically unhealthy days: 4.9 per month (state: 3.9 per month)
> Median household income: $61,307 (state: $80,440)
> Population: 175,639

Colorado: Pueblo
> Adults who don’t exercise: 23.2% (state: 14.8%)
> Pop. with access to places for physical activity: 64.5% (state: 90.5%)
> Adult obesity rate: 31.0% (state: 22.4%)
> Pop. over 20 with diabetes: 10.0% (state: 6.6%)
> Adults in poor or fair health: 20.1% (state: 13.8%)
> Physically unhealthy days: 4.2 per month (state: 3.3 per month)
> Median household income: $51,276 (state: $77,127)
> Population: 168,424
[in-text-ad]

Connecticut: New Haven
> Adults who don’t exercise: 21.6% (state: 19.9%)
> Pop. with access to places for physical activity: 95.4% (state: 94.0%)
> Adult obesity rate: 28.8% (state: 26.3%)
> Pop. over 20 with diabetes: 10.2% (state: 9.2%)
> Adults in poor or fair health: 15.3% (state: 13.0%)
> Physically unhealthy days: 3.8 per month (state: 3.3 per month)
> Median household income: $69,751 (state: $78,833)
> Population: 854,757

Delaware: Dover
> Adults who don’t exercise: 30.9% (state: 27.3%)
> Pop. with access to places for physical activity: 66.8% (state: 86.5%)
> Adult obesity rate: 38.4% (state: 32.4%)
> Pop. over 20 with diabetes: 13.9% (state: 11.8%)
> Adults in poor or fair health: 21.0% (state: 16.3%)
> Physically unhealthy days: 4.5 per month (state: 3.7 per month)
> Median household income: $58,001 (state: $70,176)
> Population: 180,786

Florida: Homosassa Springs
> Adults who don’t exercise: 35.7% (state: 25.8%)
> Pop. with access to places for physical activity: 73.3% (state: 88.7%)
> Adult obesity rate: 28.7% (state: 27.2%)
> Pop. over 20 with diabetes: 13.3% (state: 10.8%)
> Adults in poor or fair health: 19.8% (state: 19.5%)
> Physically unhealthy days: 4.8 per month (state: 4.0 per month)
> Median household income: $50,751 (state: $59,227)
> Population: 149,657
[in-text-ad-2]

Georgia: Hinesville
> Adults who don’t exercise: 34.3% (state: 26.4%)
> Pop. with access to places for physical activity: 58.6% (state: 75.5%)
> Adult obesity rate: 36.4% (state: 32.3%)
> Pop. over 20 with diabetes: 12.3% (state: 12.0%)
> Adults in poor or fair health: 22.3% (state: 18.4%)
> Physically unhealthy days: 4.6 per month (state: 3.9 per month)
> Median household income: $53,060 (state: $61,980)
> Population: 81,344

Hawaii: Urban Honolulu
> Adults who don’t exercise: 20.0% (state: 19.6%)
> Pop. with access to places for physical activity: 96.7% (state: 92.5%)
> Adult obesity rate: 24.4% (state: 24.6%)
> Pop. over 20 with diabetes: 11.3% (state: 11.1%)
> Adults in poor or fair health: 17.0% (state: 15.4%)
> Physically unhealthy days: 3.6 per month (state: 3.2 per month)
> Median household income: $87,470 (state: $83,102)
> Population: 974,563
[in-text-ad]

Idaho: Pocatello
> Adults who don’t exercise: 21.7% (state: 20.4%)
> Pop. with access to places for physical activity: 74.7% (state: 78.9%)
> Adult obesity rate: 31.2% (state: 29.0%)
> Pop. over 20 with diabetes: 10.9% (state: 9.3%)
> Adults in poor or fair health: 17.0% (state: 15.1%)
> Physically unhealthy days: 4.1 per month (state: 3.7 per month)
> Median household income: $51,612 (state: $60,999)
> Population: 94,588
 24/7 Wall St.
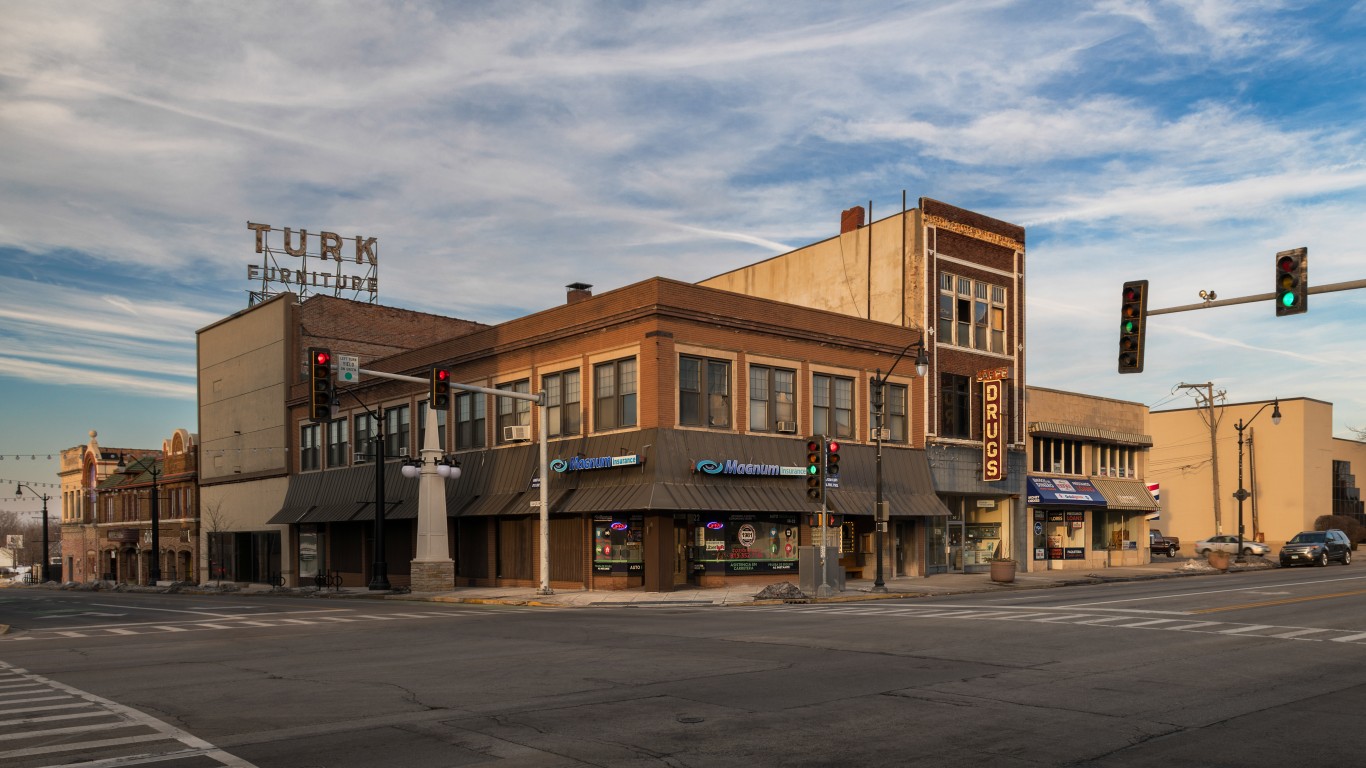
Illinois: Kankakee
> Adults who don’t exercise: 33.0% (state: 21.6%)
> Pop. with access to places for physical activity: 80.0% (state: 90.8%)
> Adult obesity rate: 38.0% (state: 29.7%)
> Pop. over 20 with diabetes: 13.2% (state: 9.9%)
> Adults in poor or fair health: 19.2% (state: 15.9%)
> Physically unhealthy days: 4.3 per month (state: 3.6 per month)
> Median household income: $60,923 (state: $69,187)
> Population: 109,862
Indiana: Kokomo
> Adults who don’t exercise: 34.1% (state: 26.7%)
> Pop. with access to places for physical activity: 68.6% (state: 75.2%)
> Adult obesity rate: 35.2% (state: 33.9%)
> Pop. over 20 with diabetes: 14.8% (state: 12.1%)
> Adults in poor or fair health: 20.2% (state: 18.2%)
> Physically unhealthy days: 4.4 per month (state: 4.0 per month)
> Median household income: $53,440 (state: $57,603)
> Population: 82,544
[in-text-ad-2]

Iowa: Sioux City
> Adults who don’t exercise: 28.4% (state: 22.6%)
> Pop. with access to places for physical activity: 88.0% (state: 82.9%)
> Adult obesity rate: 35.1% (state: 34.3%)
> Pop. over 20 with diabetes: 10.9% (state: 9.9%)
> Adults in poor or fair health: 16.7% (state: 13.5%)
> Physically unhealthy days: 3.4 per month (state: 3.1 per month)
> Median household income: $60,132 (state: $61,691)
> Population: 144,670

Kansas: Wichita
> Adults who don’t exercise: 25.2% (state: 23.9%)
> Pop. with access to places for physical activity: 81.8% (state: 80.1%)
> Adult obesity rate: 33.4% (state: 33.0%)
> Pop. over 20 with diabetes: 11.3% (state: 10.5%)
> Adults in poor or fair health: 17.3% (state: 16.3%)
> Physically unhealthy days: 4.0 per month (state: 3.6 per month)
> Median household income: $59,779 (state: $62,087)
> Population: 640,218
[in-text-ad]

Kentucky: Elizabethtown-Fort Knox
> Adults who don’t exercise: 30.2% (state: 28.7%)
> Pop. with access to places for physical activity: 53.3% (state: 71.1%)
> Adult obesity rate: 38.9% (state: 34.6%)
> Pop. over 20 with diabetes: 12.1% (state: 12.7%)
> Adults in poor or fair health: 21.7% (state: 21.8%)
> Physically unhealthy days: 5.0 per month (state: 4.6 per month)
> Median household income: $55,246 (state: $52,295)
> Population: 154,713
 24/7 Wall St.
Louisiana: Hammond
> Adults who don’t exercise: 33.1% (state: 28.0%)
> Pop. with access to places for physical activity: 67.9% (state: 75.0%)
> Adult obesity rate: 40.3% (state: 36.3%)
> Pop. over 20 with diabetes: 11.7% (state: 13.0%)
> Adults in poor or fair health: 23.1% (state: 21.4%)
> Physically unhealthy days: 4.7 per month (state: 4.3 per month)
> Median household income: $47,825 (state: $51,073)
> Population: 134,758

Maine: Bangor
> Adults who don’t exercise: 23.5% (state: 20.8%)
> Pop. with access to places for physical activity: 63.4% (state: 70.0%)
> Adult obesity rate: 34.2% (state: 29.8%)
> Pop. over 20 with diabetes: 12.3% (state: 10.4%)
> Adults in poor or fair health: 19.1% (state: 17.1%)
> Physically unhealthy days: 4.5 per month (state: 4.2 per month)
> Median household income: $50,449 (state: $58,924)
> Population: 152,148
[in-text-ad-2]

Maryland: Salisbury
> Adults who don’t exercise: 29.1% (state: 21.9%)
> Pop. with access to places for physical activity: 76.1% (state: 92.6%)
> Adult obesity rate: 34.9% (state: 31.6%)
> Pop. over 20 with diabetes: 13.1% (state: 11.1%)
> Adults in poor or fair health: 18.6% (state: 15.2%)
> Physically unhealthy days: 4.2 per month (state: 3.4 per month)
> Median household income: $61,283 (state: $86,738)
> Population: 415,726

Massachusetts: Springfield
> Adults who don’t exercise: 23.7% (state: 20.0%)
> Pop. with access to places for physical activity: 92.6% (state: 94.5%)
> Adult obesity rate: 28.2% (state: 25.0%)
> Pop. over 20 with diabetes: 9.2% (state: 8.7%)
> Adults in poor or fair health: 17.7% (state: 13.5%)
> Physically unhealthy days: 4.3 per month (state: 3.5 per month)
> Median household income: $62,346 (state: $85,843)
> Population: 697,382
[in-text-ad]

Michigan: Battle Creek
> Adults who don’t exercise: 27.2% (state: 23.1%)
> Pop. with access to places for physical activity: 76.7% (state: 85.5%)
> Adult obesity rate: 36.8% (state: 32.4%)
> Pop. over 20 with diabetes: 14.7% (state: 11.0%)
> Adults in poor or fair health: 18.9% (state: 18.3%)
> Physically unhealthy days: 4.4 per month (state: 4.3 per month)
> Median household income: $49,055 (state: $59,584)
> Population: 134,159

Minnesota: Mankato-North Mankato
> Adults who don’t exercise: 21.3% (state: 19.6%)
> Pop. with access to places for physical activity: 83.0% (state: 86.9%)
> Adult obesity rate: 32.6% (state: 29.0%)
> Pop. over 20 with diabetes: 8.2% (state: 8.5%)
> Adults in poor or fair health: 14.1% (state: 12.9%)
> Physically unhealthy days: 3.4 per month (state: 3.1 per month)
> Median household income: $63,126 (state: $74,593)
> Population: 101,927

Mississippi: Jackson
> Adults who don’t exercise: 29.1% (state: 30.4%)
> Pop. with access to places for physical activity: 65.1% (state: 54.5%)
> Adult obesity rate: 40.1% (state: 39.1%)
> Pop. over 20 with diabetes: 12.5% (state: 14.6%)
> Adults in poor or fair health: 21.4% (state: 22.1%)
> Physically unhealthy days: 4.1 per month (state: 4.5 per month)
> Median household income: $52,426 (state: $45,792)
> Population: 594,800
[in-text-ad-2]

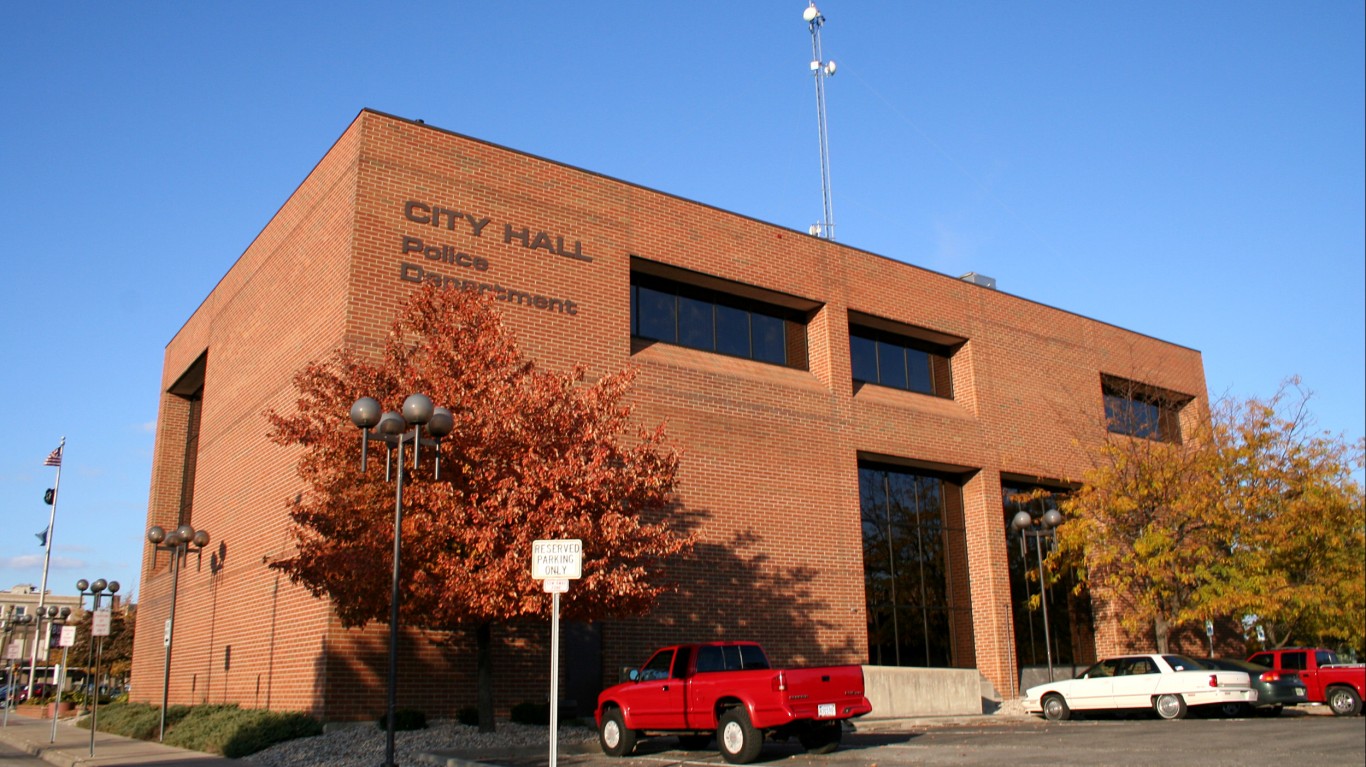
Missouri: St. Joseph
> Adults who don’t exercise: 31.4% (state: 25.5%)
> Pop. with access to places for physical activity: 74.9% (state: 76.7%)
> Adult obesity rate: 37.0% (state: 32.5%)
> Pop. over 20 with diabetes: 12.4% (state: 11.4%)
> Adults in poor or fair health: 20.9% (state: 19.5%)
> Physically unhealthy days: 4.7 per month (state: 4.2 per month)
> Median household income: $50,425 (state: $57,409)
> Population: 125,411

Montana: Great Falls
> Adults who don’t exercise: 24.0% (state: 21.7%)
> Pop. with access to places for physical activity: 83.5% (state: 75.2%)
> Adult obesity rate: 31.1% (state: 27.1%)
> Pop. over 20 with diabetes: 9.8% (state: 8.9%)
> Adults in poor or fair health: 16.8% (state: 14.1%)
> Physically unhealthy days: 4.1 per month (state: 3.6 per month)
> Median household income: $51,227 (state: $57,153)
> Population: 81,366
[in-text-ad]

Nebraska: Grand Island
> Adults who don’t exercise: 27.6% (state: 22.7%)
> Pop. with access to places for physical activity: 79.4% (state: 83.5%)
> Adult obesity rate: 37.3% (state: 33.4%)
> Pop. over 20 with diabetes: 11.5% (state: 10.0%)
> Adults in poor or fair health: 16.0% (state: 13.8%)
> Physically unhealthy days: 3.4 per month (state: 3.2 per month)
> Median household income: $55,907 (state: $63,229)
> Population: 75,553
 24/7 Wall St.
Nevada: Las Vegas-Henderson-Paradise
> Adults who don’t exercise: 23.4% (state: 22.5%)
> Pop. with access to places for physical activity: 97.1% (state: 93.0%)
> Adult obesity rate: 27.3% (state: 27.1%)
> Pop. over 20 with diabetes: 10.9% (state: 10.5%)
> Adults in poor or fair health: 21.6% (state: 19.1%)
> Physically unhealthy days: 4.4 per month (state: 4.2 per month)
> Median household income: $62,107 (state: $63,276)
> Population: 2,266,715

New Hampshire: Manchester
> Adults who don’t exercise: 21.7% (state: 20.8%)
> Pop. with access to places for physical activity: 91.7% (state: 88.2%)
> Adult obesity rate: 28.5% (state: 28.6%)
> Pop. over 20 with diabetes: 9.7% (state: 9.6%)
> Adults in poor or fair health: 12.2% (state: 12.8%)
> Physically unhealthy days: 3.4 per month (state: 3.5 per month)
> Median household income: $83,626 (state: $77,933)
> Population: 417,025
[in-text-ad-2]

New Jersey: Atlantic City-Hammonton
> Adults who don’t exercise: 32.4% (state: 26.6%)
> Pop. with access to places for physical activity: 91.4% (state: 94.7%)
> Adult obesity rate: 32.5% (state: 27.0%)
> Pop. over 20 with diabetes: 13.2% (state: 9.9%)
> Adults in poor or fair health: 18.7% (state: 15.5%)
> Physically unhealthy days: 4.3 per month (state: 3.7 per month)
> Median household income: $63,389 (state: $85,751)
> Population: 263,670

New Mexico: Farmington
> Adults who don’t exercise: 22.6% (state: 19.0%)
> Pop. with access to places for physical activity: 55.6% (state: 76.9%)
> Adult obesity rate: 34.6% (state: 27.3%)
> Pop. over 20 with diabetes: 13.5% (state: 9.5%)
> Adults in poor or fair health: 23.5% (state: 20.3%)
> Physically unhealthy days: 5.0 per month (state: 4.3 per month)
> Median household income: $44,321 (state: $51,945)
> Population: 123,958
[in-text-ad]

New York: Elmira
> Adults who don’t exercise: 29.6% (state: 23.4%)
> Pop. with access to places for physical activity: 82.6% (state: 93.2%)
> Adult obesity rate: 35.1% (state: 26.4%)
> Pop. over 20 with diabetes: 12.7% (state: 10.1%)
> Adults in poor or fair health: 17.6% (state: 16.3%)
> Physically unhealthy days: 4.3 per month (state: 3.6 per month)
> Median household income: $60,782 (state: $72,108)
> Population: 83,456
 24/7 Wall St.
North Carolina: Goldsboro
> Adults who don’t exercise: 28.6% (state: 23.3%)
> Pop. with access to places for physical activity: 45.2% (state: 73.5%)
> Adult obesity rate: 39.7% (state: 32.3%)
> Pop. over 20 with diabetes: 16.0% (state: 11.5%)
> Adults in poor or fair health: 23.6% (state: 18.0%)
> Physically unhealthy days: 4.5 per month (state: 3.6 per month)
> Median household income: $44,596 (state: $57,341)
> Population: 123,131

North Dakota: Grand Forks
> Adults who don’t exercise: 23.7% (state: 23.1%)
> Pop. with access to places for physical activity: 77.5% (state: 74.0%)
> Adult obesity rate: 33.6% (state: 33.9%)
> Pop. over 20 with diabetes: 9.2% (state: 9.4%)
> Adults in poor or fair health: 15.7% (state: 13.6%)
> Physically unhealthy days: 3.5 per month (state: 3.2 per month)
> Median household income: $57,301 (state: $64,577)
> Population: 100,815
[in-text-ad-2]

Ohio: Mansfield
> Adults who don’t exercise: 32.0% (state: 26.1%)
> Pop. with access to places for physical activity: 67.3% (state: 83.9%)
> Adult obesity rate: 35.6% (state: 33.5%)
> Pop. over 20 with diabetes: 14.2% (state: 12.2%)
> Adults in poor or fair health: 20.6% (state: 17.8%)
> Physically unhealthy days: 4.6 per month (state: 4.1 per month)
> Median household income: $51,783 (state: $58,642)
> Population: 121,154

Oklahoma: Enid
> Adults who don’t exercise: 29.2% (state: 27.8%)
> Pop. with access to places for physical activity: 66.8% (state: 71.3%)
> Adult obesity rate: 35.1% (state: 34.5%)
> Pop. over 20 with diabetes: 10.1% (state: 12.3%)
> Adults in poor or fair health: 20.5% (state: 20.9%)
> Physically unhealthy days: 4.7 per month (state: 4.5 per month)
> Median household income: $64,929 (state: $54,449)
> Population: 61,056
[in-text-ad]

Oregon: Grants Pass
> Adults who don’t exercise: 22.5% (state: 17.3%)
> Pop. with access to places for physical activity: 81.9% (state: 87.9%)
> Adult obesity rate: 32.0% (state: 29.3%)
> Pop. over 20 with diabetes: 12.5% (state: 9.7%)
> Adults in poor or fair health: 21.9% (state: 18.2%)
> Physically unhealthy days: 5.2 per month (state: 4.7 per month)
> Median household income: $47,573 (state: $67,058)
> Population: 87,487
 24/7 Wall St.
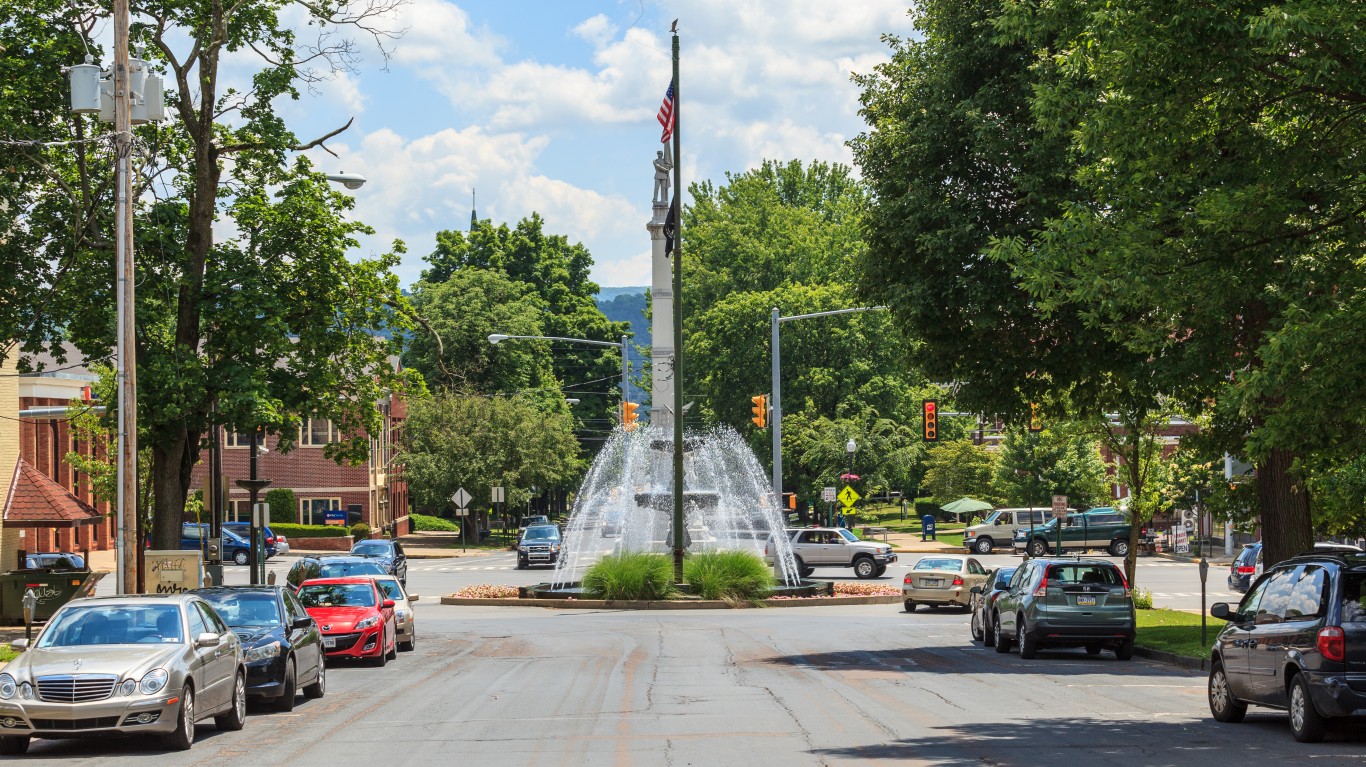
Pennsylvania: Bloomsburg-Berwick
> Adults who don’t exercise: 33.0% (state: 22.0%)
> Pop. with access to places for physical activity: 73.6% (state: 84.4%)
> Adult obesity rate: 35.3% (state: 30.8%)
> Pop. over 20 with diabetes: 12.7% (state: 11.0%)
> Adults in poor or fair health: 18.0% (state: 17.6%)
> Physically unhealthy days: 4.2 per month (state: 4.0 per month)
> Median household income: $56,672 (state: $63,463)
> Population: 83,194

Rhode Island: Providence-Warwick
> Adults who don’t exercise: 23.8% (state: 23.5%)
> Pop. with access to places for physical activity: 95.1% (state: 94.9%)
> Adult obesity rate: 28.6% (state: 28.5%)
> Pop. over 20 with diabetes: 10.1% (state: 10.1%)
> Adults in poor or fair health: 16.8% (state: 16.5%)
> Physically unhealthy days: 4.2 per month (state: 3.9 per month)
> Median household income: $70,967 (state: $71,169)
> Population: 1,624,578
[in-text-ad-2]
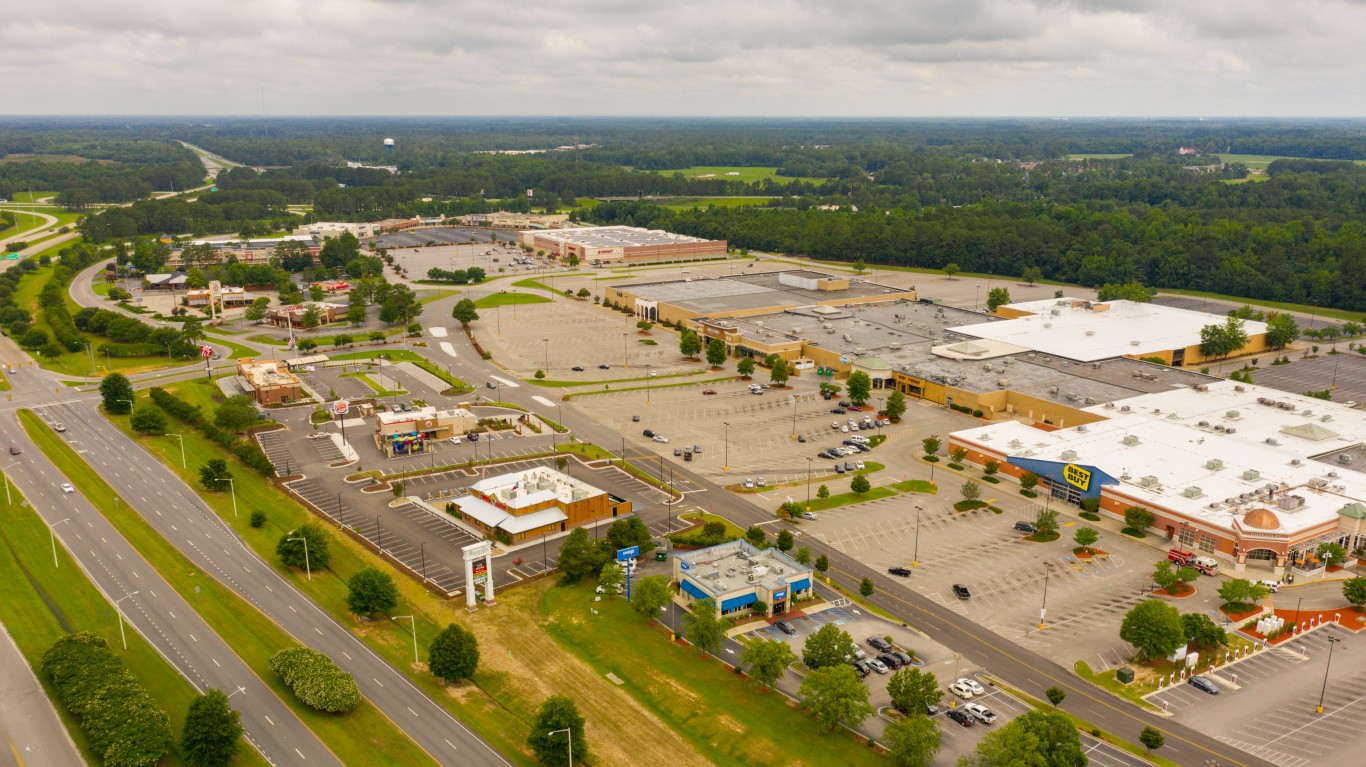
South Carolina: Florence
> Adults who don’t exercise: 31.8% (state: 26.0%)
> Pop. with access to places for physical activity: 52.3% (state: 68.3%)
> Adult obesity rate: 38.4% (state: 34.0%)
> Pop. over 20 with diabetes: 16.8% (state: 13.3%)
> Adults in poor or fair health: 21.5% (state: 17.8%)
> Physically unhealthy days: 4.4 per month (state: 4.0 per month)
> Median household income: $48,547 (state: $56,227)
> Population: 204,911

South Dakota: Rapid City
> Adults who don’t exercise: 21.8% (state: 22.0%)
> Pop. with access to places for physical activity: 88.4% (state: 73.5%)
> Adult obesity rate: 29.3% (state: 32.4%)
> Pop. over 20 with diabetes: 9.7% (state: 10.1%)
> Adults in poor or fair health: 14.3% (state: 13.4%)
> Physically unhealthy days: 3.2 per month (state: 3.0 per month)
> Median household income: $58,361 (state: $59,533)
> Population: 142,191
[in-text-ad]

Tennessee: Morristown
> Adults who don’t exercise: 32.4% (state: 27.2%)
> Pop. with access to places for physical activity: 59.5% (state: 70.2%)
> Adult obesity rate: 38.0% (state: 33.3%)
> Pop. over 20 with diabetes: 14.9% (state: 12.5%)
> Adults in poor or fair health: 24.1% (state: 21.2%)
> Physically unhealthy days: 5.3 per month (state: 4.7 per month)
> Median household income: $47,326 (state: $56,071)
> Population: 142,749
 24/7 Wall St.
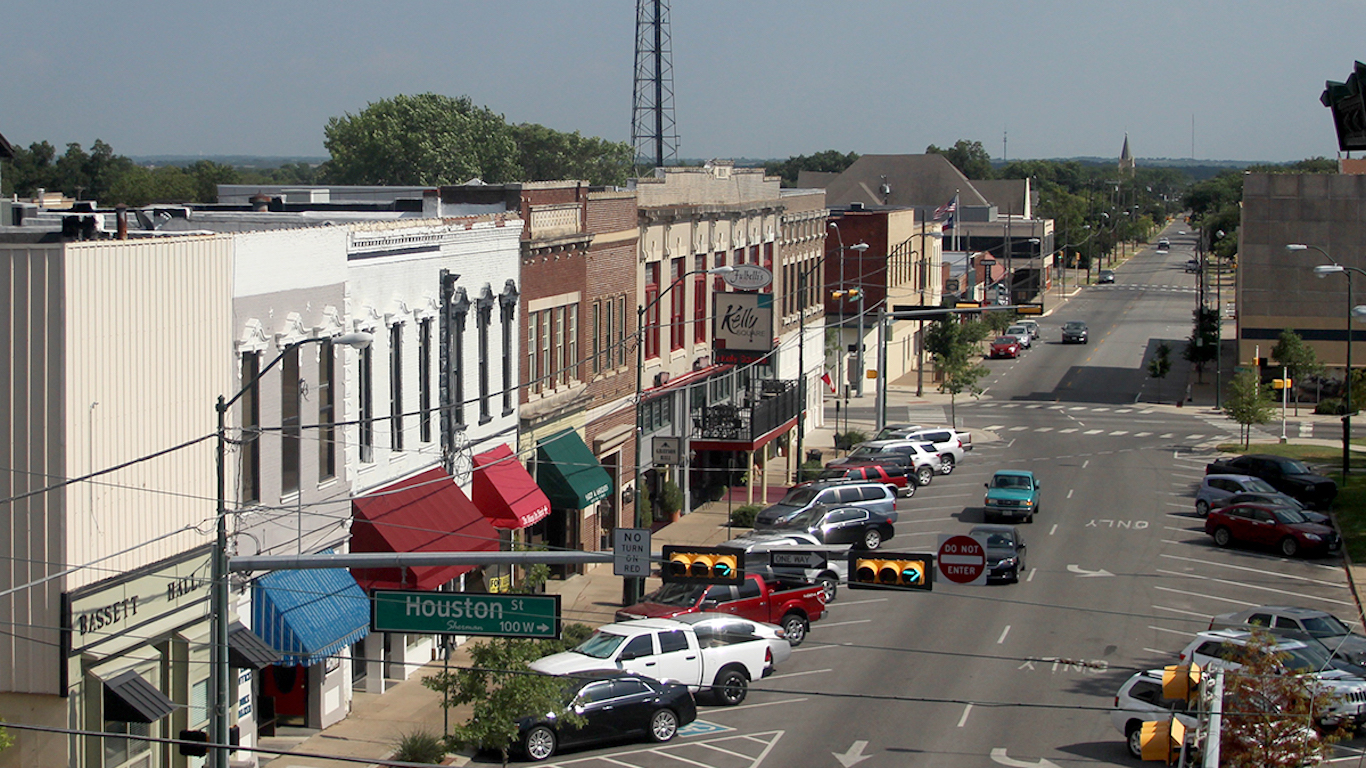
Texas: Sherman-Denison
> Adults who don’t exercise: 34.9% (state: 23.2%)
> Pop. with access to places for physical activity: 66.6% (state: 80.5%)
> Adult obesity rate: 38.1% (state: 31.4%)
> Pop. over 20 with diabetes: 11.0% (state: 10.2%)
> Adults in poor or fair health: 19.3% (state: 18.7%)
> Physically unhealthy days: 4.2 per month (state: 3.8 per month)
> Median household income: $57,476 (state: $64,034)
> Population: 136,212
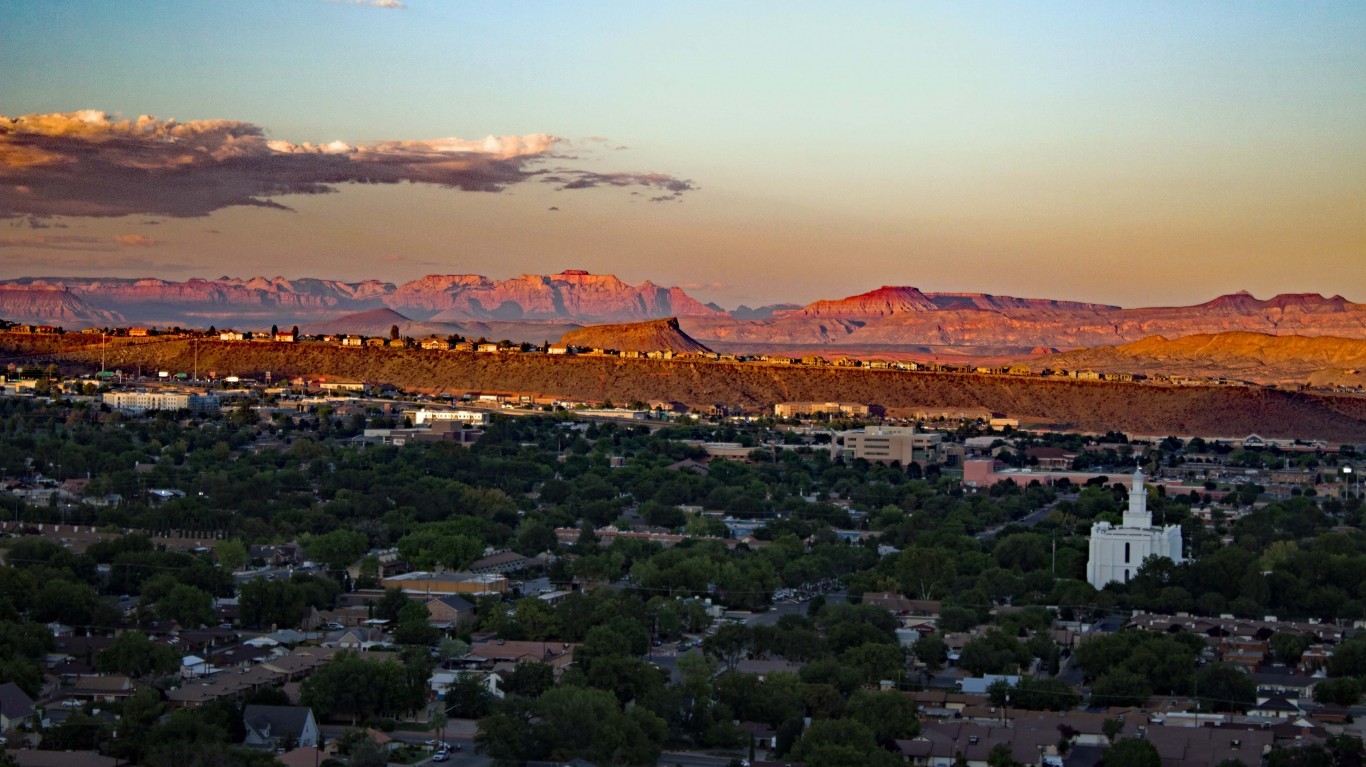
Utah: St. George
> Adults who don’t exercise: 17.4% (state: 16.7%)
> Pop. with access to places for physical activity: 81.4% (state: 85.7%)
> Adult obesity rate: 24.0% (state: 27.0%)
> Pop. over 20 with diabetes: 8.6% (state: 7.5%)
> Adults in poor or fair health: 15.9% (state: 14.8%)
> Physically unhealthy days: 4.0 per month (state: 3.5 per month)
> Median household income: $63,595 (state: $75,780)
> Population: 177,556
[in-text-ad-2]

Vermont: Burlington-South Burlington
> Adults who don’t exercise: 16.7% (state: 18.4%)
> Pop. with access to places for physical activity: 77.9% (state: 75.8%)
> Adult obesity rate: 25.5% (state: 27.0%)
> Pop. over 20 with diabetes: 7.7% (state: 8.8%)
> Adults in poor or fair health: 11.9% (state: 12.8%)
> Physically unhealthy days: 3.7 per month (state: 3.7 per month)
> Median household income: $74,909 (state: $63,001)
> Population: 219,433

Virginia: Roanoke
> Adults who don’t exercise: 27.1% (state: 22.2%)
> Pop. with access to places for physical activity: 79.5% (state: 82.4%)
> Adult obesity rate: 33.5% (state: 30.5%)
> Pop. over 20 with diabetes: 12.7% (state: 10.7%)
> Adults in poor or fair health: 18.4% (state: 16.6%)
> Physically unhealthy days: 4.2 per month (state: 3.5 per month)
> Median household income: $60,471 (state: $76,456)
> Population: 312,796
[in-text-ad]

Washington: Longview
> Adults who don’t exercise: 21.7% (state: 16.4%)
> Pop. with access to places for physical activity: 73.5% (state: 86.2%)
> Adult obesity rate: 37.7% (state: 28.6%)
> Pop. over 20 with diabetes: 13.2% (state: 9.3%)
> Adults in poor or fair health: 19.5% (state: 15.0%)
> Physically unhealthy days: 4.9 per month (state: 3.7 per month)
> Median household income: $55,497 (state: $78,687)
> Population: 110,593
 24/7 Wall St.
West Virginia: Weirton-Steubenville
> Adults who don’t exercise: 32.0% (state: 28.0%)
> Pop. with access to places for physical activity: 85.2% (state: 59.4%)
> Adult obesity rate: 38.4% (state: 37.8%)
> Pop. over 20 with diabetes: 15.3% (state: 15.1%)
> Adults in poor or fair health: 20.9% (state: 23.6%)
> Physically unhealthy days: 4.8 per month (state: 5.3 per month)
> Median household income: $49,510 (state: $48,850)
> Population: 115,816
Wisconsin: Fond du Lac
> Adults who don’t exercise: 23.0% (state: 20.3%)
> Pop. with access to places for physical activity: 84.9% (state: 85.2%)
> Adult obesity rate: 32.0% (state: 31.7%)
> Pop. over 20 with diabetes: 8.7% (state: 9.5%)
> Adults in poor or fair health: 14.6% (state: 14.8%)
> Physically unhealthy days: 3.6 per month (state: 3.7 per month)
> Median household income: $65,329 (state: $64,168)
> Population: 103,403
[in-text-ad-2]
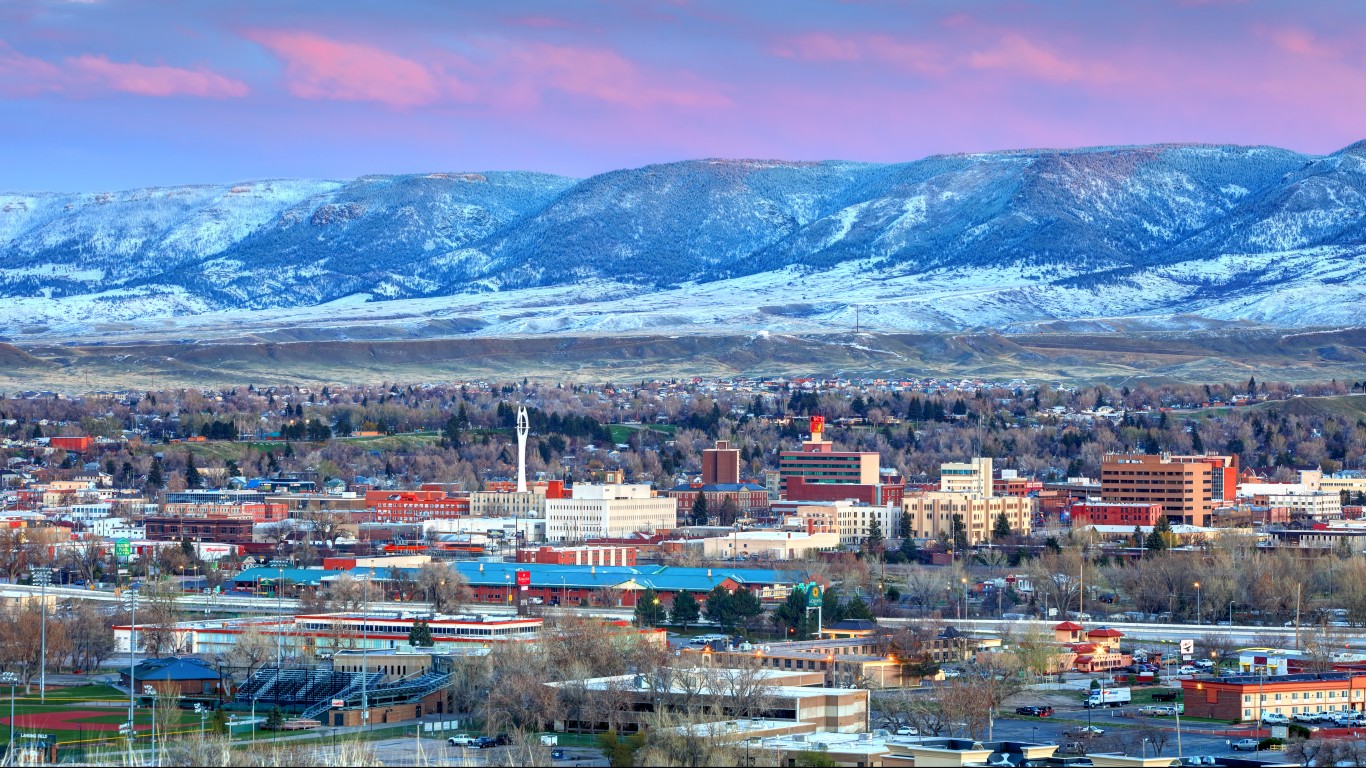
Wyoming: Casper
> Adults who don’t exercise: 23.6% (state: 23.1%)
> Pop. with access to places for physical activity: 85.6% (state: 76.5%)
> Adult obesity rate: 31.2% (state: 29.2%)
> Pop. over 20 with diabetes: 9.1% (state: 9.0%)
> Adults in poor or fair health: 15.6% (state: 15.3%)
> Physically unhealthy days: 3.8 per month (state: 3.5 per month)
> Median household income: $65,034 (state: $65,003)
> Population: 79,858
Are You Ahead, or Behind on Retirement?
If you’re one of the over 4 Million Americans set to retire this year, you may want to pay attention. Many people have worked their whole lives preparing to retire without ever knowing the answer to the most important question: am I ahead, or behind on my goals?
Don’t make the same mistake. It’s an easy question to answer. A quick conversation with a financial advisor can help you unpack your savings, spending, and goals for your money. With Zoe Financial’s free matching tool, you can connect with trusted financial advisors in minutes.
Why wait? Click here to get started today!
Thank you for reading! Have some feedback for us?
Contact the 24/7 Wall St. editorial team.
Latest from 24/7


Our expert who first called NVIDIA in 2009 is predicting 2025 will see a historic AI breakthrough.
You can follow him investing $500,000 of his own money on our top AI stocks for free.