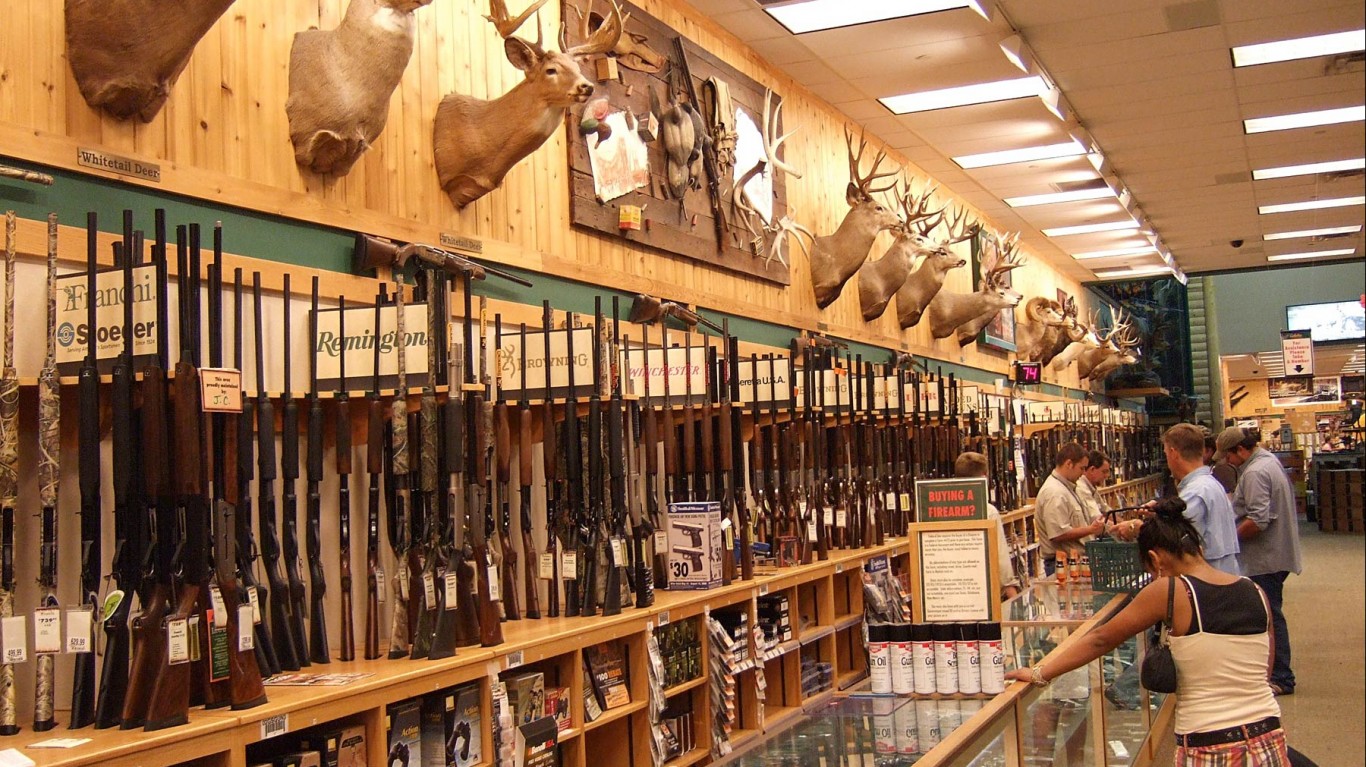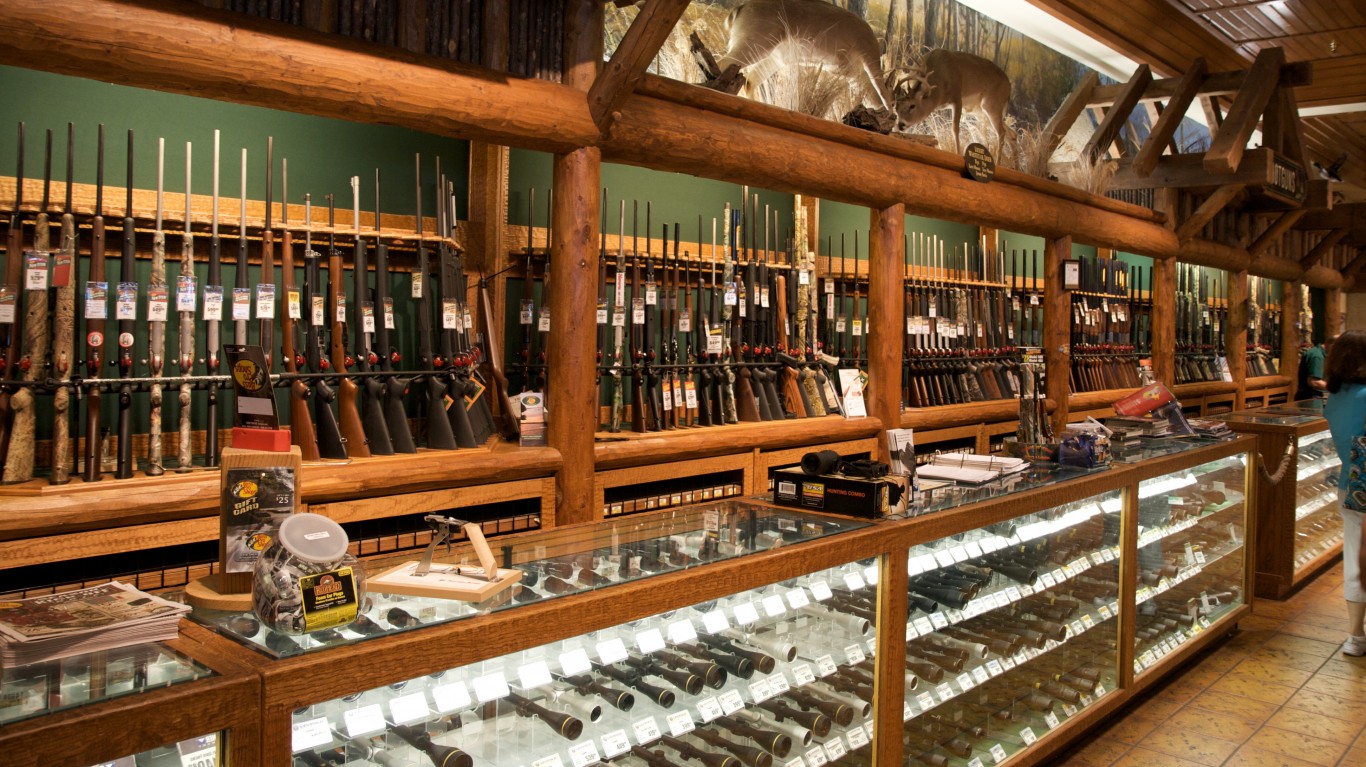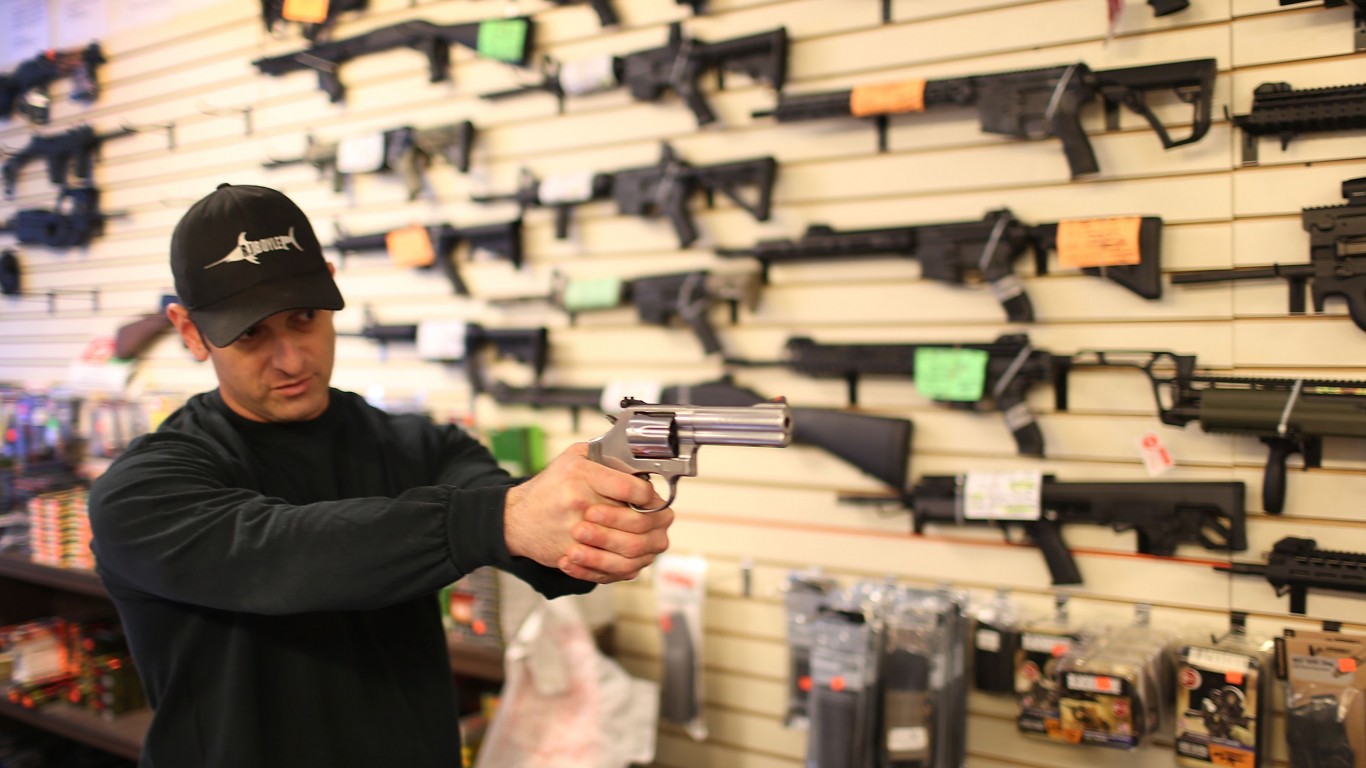
Fueled in part by the pandemic and national unrest in the wake of incidents of police brutality, gun sales hit an all-time high in the United States in 2020 — a trend that shows no sign of slowing so far in 2021. Gun control advocates are concerned that the growing number of firearms in circulation, many of which are in the hands of first-time owners, will result in increasing rates of gun violence — an all too familiar problem in the United States.
Even in 2019, before the most recent surge in firearm sales, there were an estimated 39,707 people killed by guns in the United States, or 12.1 deaths for every 100,000 people. Gun violence varies considerably by state, however, and some parts of the country are far safer than others.
Using data from the Centers for Disease Control and Prevention, 24/7 Wall St. identified the states with the most gun violence.
Perhaps not surprisingly, the states with lower levels of gun violence tend to be those with stronger gun control laws. These states tend to have regulations on gun ownership that include universal background checks, waiting periods, limits on magazine capacity, restrictions on both open and concealed carry, and ownership bans for those with certain mental health issues. Meanwhile, states with the highest rates of gun violence typically have very few, if any, of these regulations. Here is a look at the states with the best and worst gun laws.
In the United States, mass shootings are the most publicized and often most horrific form of gun violence. So far this year, there have been nearly 300 recorded mass shootings nationwide. However, the deadliest form of gun violence is suicide. Nearly 24,000 Americans took their own lives with a firearm in 2019, compared to about 14,400 homicides that were carried out with a gun.
Click here to see the states with the most gun violence.
To determine the states with the most gun violence, 24/7 Wall St. examined 2019 firearm-related deaths data from the Centers for Disease Control and Prevention. We also considered violent crime rates from the FBI’s 2019 Uniform Crime Report. Data on annual background checks is from the FBI’s National instant Criminal Background Check system

50. Massachusetts
> Annual firearm death rate: 3.4 per 100,000 people
> Total annual firearm: 237 (suicides: 142, homicides: 95)
> Background checks in 2020: 262,583 (3,810 per 100,000 people — 4th lowest)
> 1-yr. change in background checks: +23.7% (2nd lowest)
> Annual violent crime rate: 328 per 100,000 people (24th lowest)
[in-text-ad]
49. Hawaii
> Annual firearm death rate: 3.9 per 100,000 people
> Total annual firearm: 55 (suicides: 41, homicides: 14)
> Background checks in 2020: 20,102 (1,420 per 100,000 people — the lowest)
> 1-yr. change in background checks: +58.7% (15th highest)
> Annual violent crime rate: 285 per 100,000 people (17th lowest)
48. New York
> Annual firearm death rate: 4.1 per 100,000 people
> Total annual firearm: 794 (suicides: 455, homicides: 326)
> Background checks in 2020: 507,940 (2,611 per 100,000 people — 3rd lowest)
> 1-yr. change in background checks: +42.9% (16th lowest)
> Annual violent crime rate: 359 per 100,000 people (25th highest)

47. New Jersey
> Annual firearm death rate: 4.1 per 100,000 people
> Total annual firearm: 366 (suicides: 173, homicides: 193)
> Background checks in 2020: 177,901 (2,003 per 100,000 people — 2nd lowest)
> 1-yr. change in background checks: +94.9% (4th highest)
> Annual violent crime rate: 207 per 100,000 people (5th lowest)
[in-text-ad-2]

46. Rhode Island
> Annual firearm death rate: 4.2 per 100,000 people
> Total annual firearm: 45 (suicides: 33, homicides: 12)
> Background checks in 2020: 51,369 (4,849 per 100,000 people — 6th lowest)
> 1-yr. change in background checks: +111.1% (2nd highest)
> Annual violent crime rate: 221 per 100,000 people (9th lowest)
45. Connecticut
> Annual firearm death rate: 5.1 per 100,000 people
> Total annual firearm: 183 (suicides: 118, homicides: 65)
> Background checks in 2020: 219,227 (6,149 per 100,000 people — 9th lowest)
> 1-yr. change in background checks: +26.8% (3rd lowest)
> Annual violent crime rate: 184 per 100,000 people (3rd lowest)
[in-text-ad]
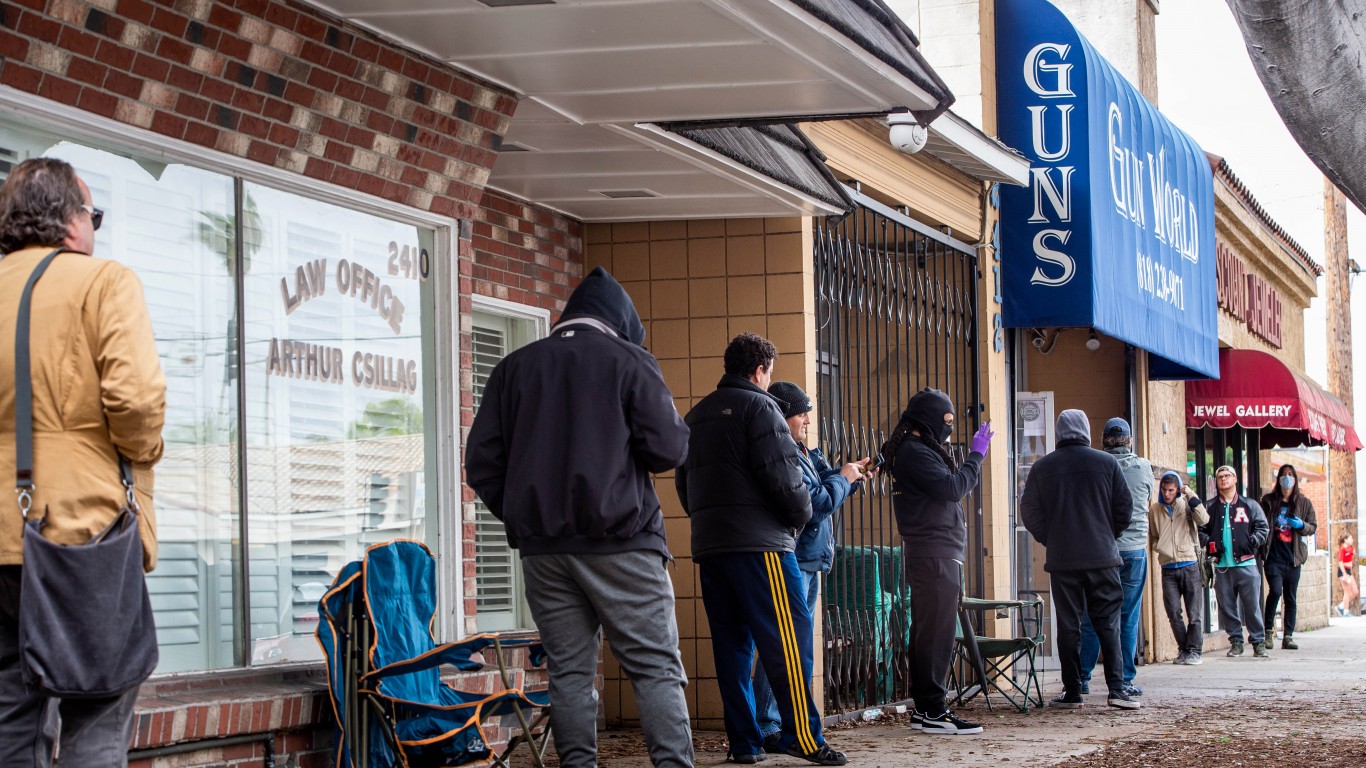
44. California
> Annual firearm death rate: 7.5 per 100,000 people
> Total annual firearm: 2,945 (suicides: 1,586, homicides: 1,246)
> Background checks in 2020: 1,601,054 (4,052 per 100,000 people — 5th lowest)
> 1-yr. change in background checks: +29.1% (7th lowest)
> Annual violent crime rate: 441 per 100,000 people (12th highest)
43. Minnesota
> Annual firearm death rate: 8.2 per 100,000 people
> Total annual firearm: 463 (suicides: 350, homicides: 102)
> Background checks in 2020: 958,391 (16,994 per 100,000 people — 6th highest)
> 1-yr. change in background checks: +40.5% (13th lowest)
> Annual violent crime rate: 236 per 100,000 people (12th lowest)
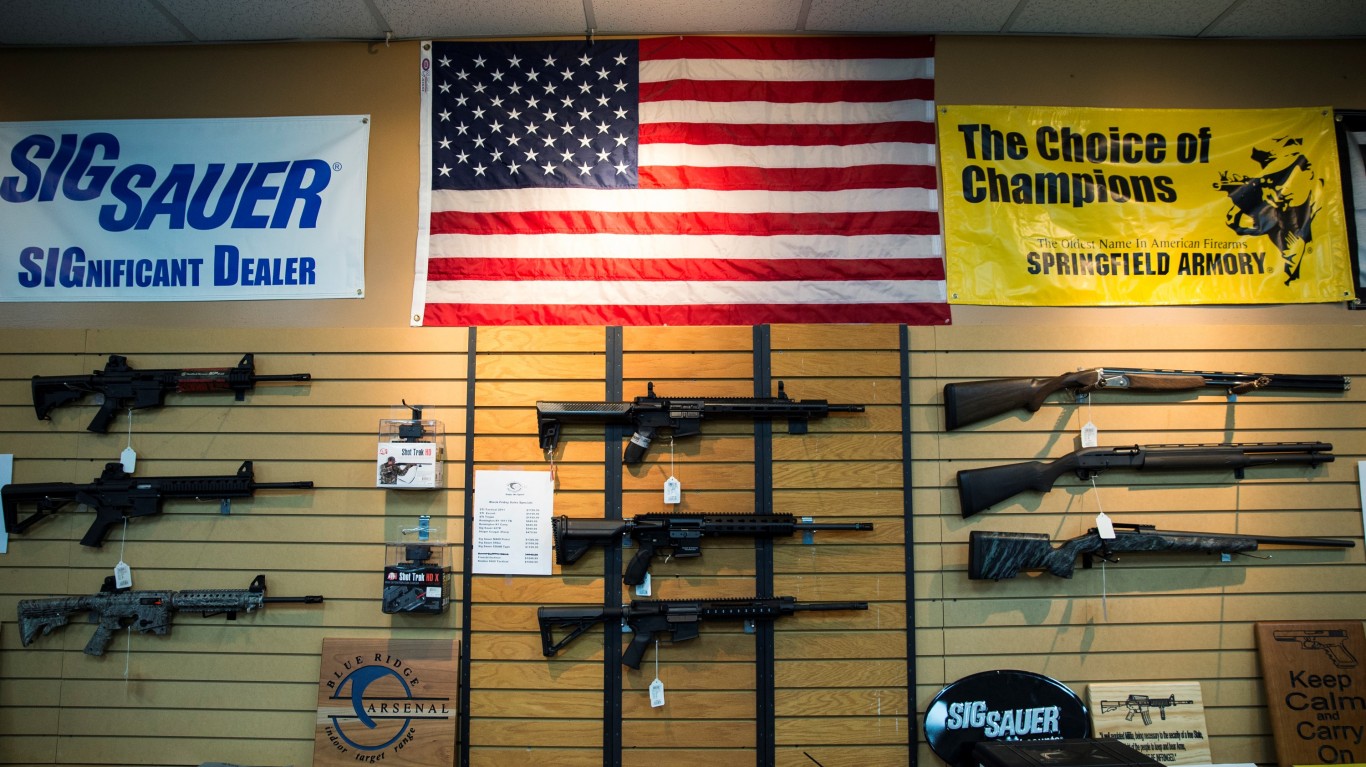
42. Iowa
> Annual firearm death rate: 8.9 per 100,000 people
> Total annual firearm: 282 (suicides: 233, homicides: 49)
> Background checks in 2020: 270,614 (8,577 per 100,000 people — 17th lowest)
> 1-yr. change in background checks: +48.0% (22nd lowest)
> Annual violent crime rate: 267 per 100,000 people (13th lowest)
[in-text-ad-2]
41. Delaware
> Annual firearm death rate: 9.2 per 100,000 people
> Total annual firearm: 90 (suicides: 45, homicides: 45)
> Background checks in 2020: 77,057 (7,913 per 100,000 people — 11th lowest)
> 1-yr. change in background checks: +66.0% (10th highest)
> Annual violent crime rate: 423 per 100,000 people (15th highest)
40. Vermont
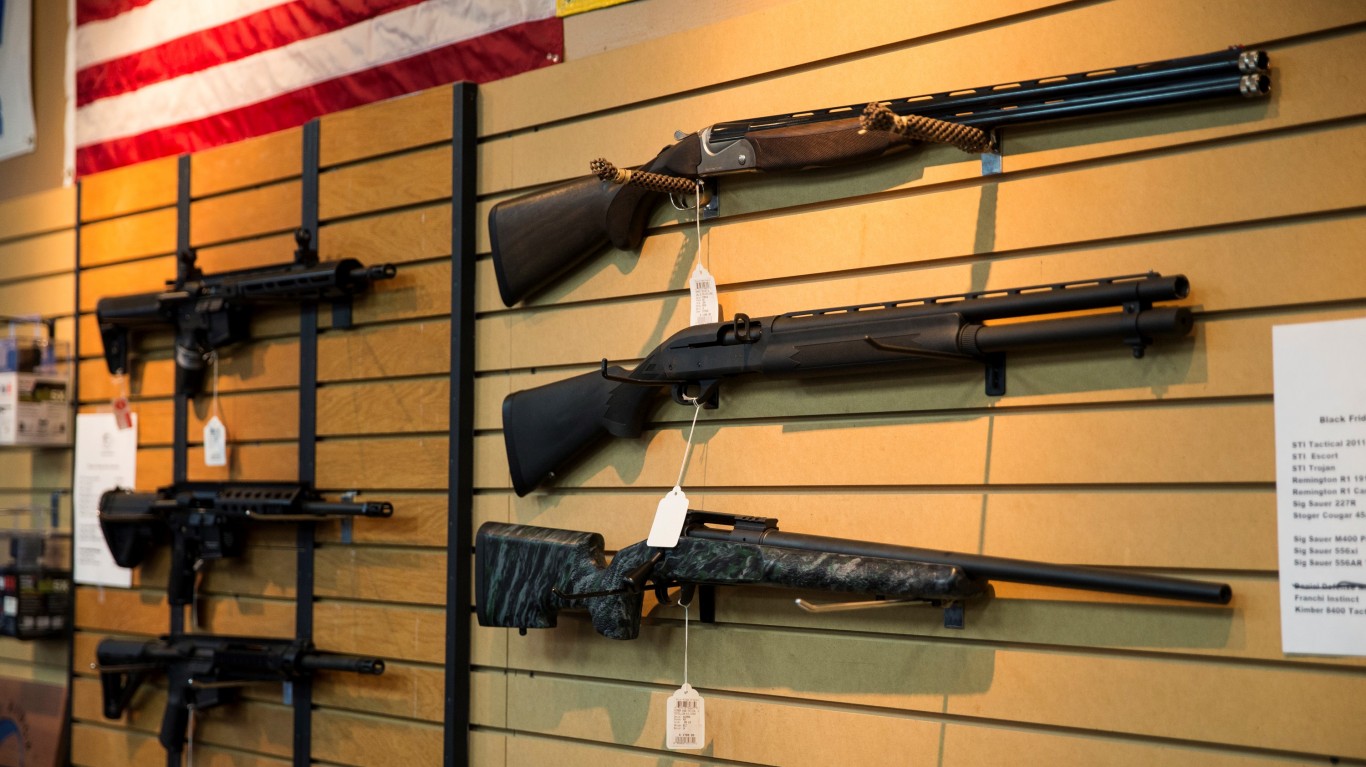
> Annual firearm death rate: 9.5 per 100,000 people
> Total annual firearm: 59 (suicides: 59, homicides: 00)
> Background checks in 2020: 57,965 (9,289 per 100,000 people — 21st lowest)
> 1-yr. change in background checks: +61.7% (12th highest)
> Annual violent crime rate: 202 per 100,000 people (4th lowest)
[in-text-ad]

39. Nebraska
> Annual firearm death rate: 10.0 per 100,000 people
> Total annual firearm: 194 (suicides: 154, homicides: 40)
> Background checks in 2020: 104,511 (5,403 per 100,000 people — 8th lowest)
> 1-yr. change in background checks: +53.2% (21st highest)
> Annual violent crime rate: 301 per 100,000 people (21st lowest)

38. Wisconsin
> Annual firearm death rate: 10.2 per 100,000 people
> Total annual firearm: 595 (suicides: 427, homicides: 153)
> Background checks in 2020: 731,618 (12,566 per 100,000 people — 15th highest)
> 1-yr. change in background checks: +67.9% (7th highest)
> Annual violent crime rate: 293 per 100,000 people (19th lowest)
37. Illinois
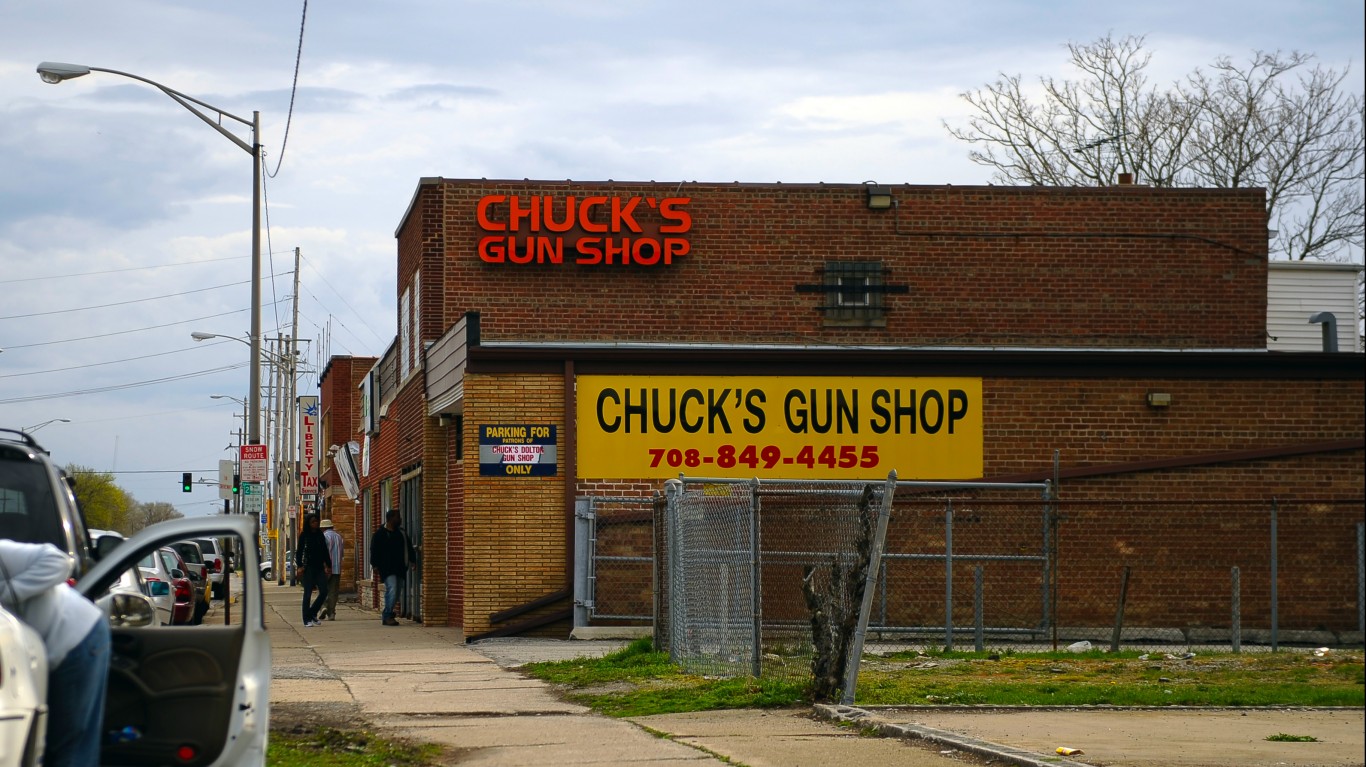
> Annual firearm death rate: 10.7 per 100,000 people
> Total annual firearm: 1,362 (suicides: 540, homicides: 791)
> Background checks in 2020: 7,455,065 (58,832 per 100,000 people — 2nd highest)
> 1-yr. change in background checks: +50.6% (25th highest)
> Annual violent crime rate: 407 per 100,000 people (18th highest)
[in-text-ad-2]
36. Washington
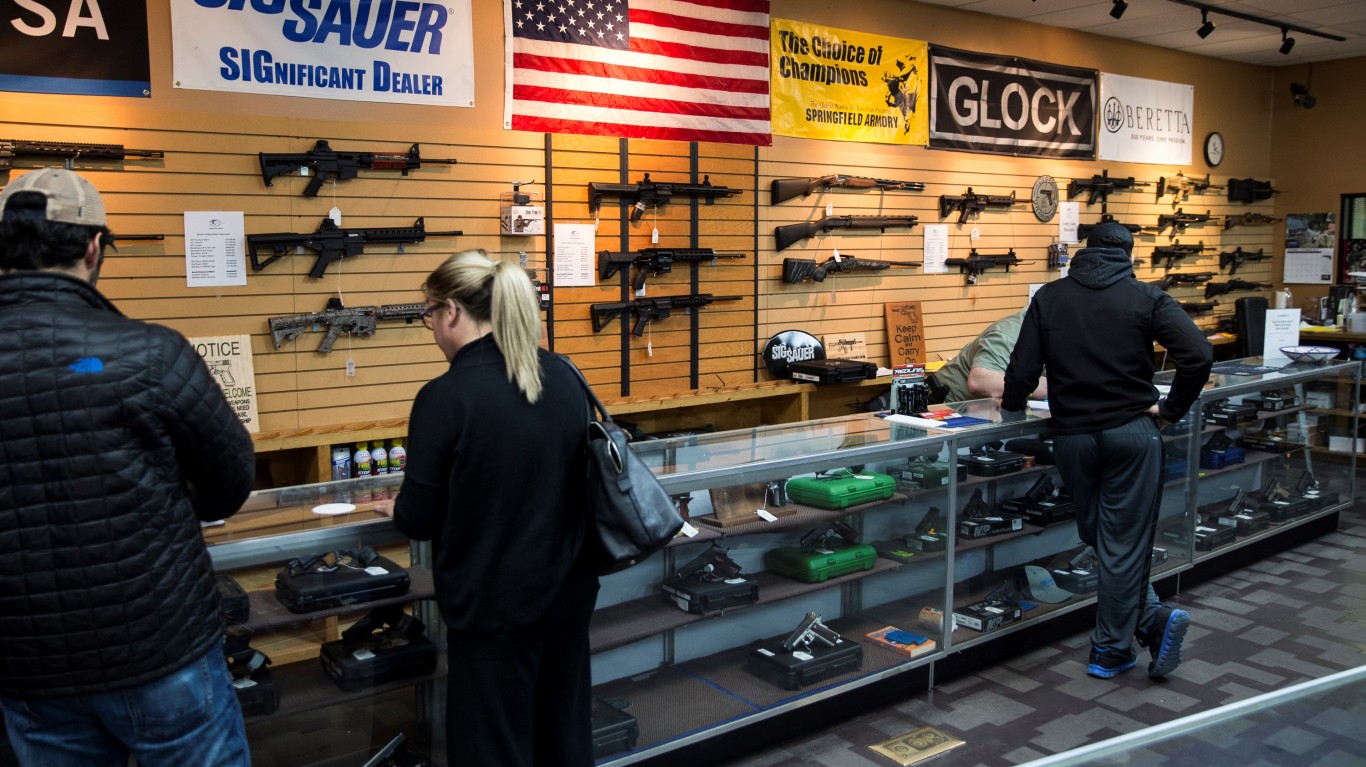
> Annual firearm death rate: 10.9 per 100,000 people
> Total annual firearm: 830 (suicides: 637, homicides: 165)
> Background checks in 2020: 781,471 (10,262 per 100,000 people — 25th lowest)
> 1-yr. change in background checks: +28.7% (5th lowest)
> Annual violent crime rate: 294 per 100,000 people (20th lowest)

35. New Hampshire
> Annual firearm death rate: 11.2 per 100,000 people
> Total annual firearm: 152 (suicides: 132, homicides: 20)
> Background checks in 2020: 174,662 (12,846 per 100,000 people — 14th highest)
> 1-yr. change in background checks: +55.7% (18th highest)
> Annual violent crime rate: 153 per 100,000 people (2nd lowest)
[in-text-ad]

34. North Dakota
> Annual firearm death rate: 11.7 per 100,000 people
> Total annual firearm: 89 (suicides: 79, homicides: 10)
> Background checks in 2020: 85,465 (11,215 per 100,000 people — 22nd highest)
> 1-yr. change in background checks: +41.5% (14th lowest)
> Annual violent crime rate: 285 per 100,000 people (16th lowest)

33. Maine
> Annual firearm death rate: 11.7 per 100,000 people
> Total annual firearm: 157 (suicides: 144, homicides: 13)
> Background checks in 2020: 137,149 (10,203 per 100,000 people — 24th lowest)
> 1-yr. change in background checks: +51.3% (24th highest)
> Annual violent crime rate: 115 per 100,000 people (the lowest)
32. Utah
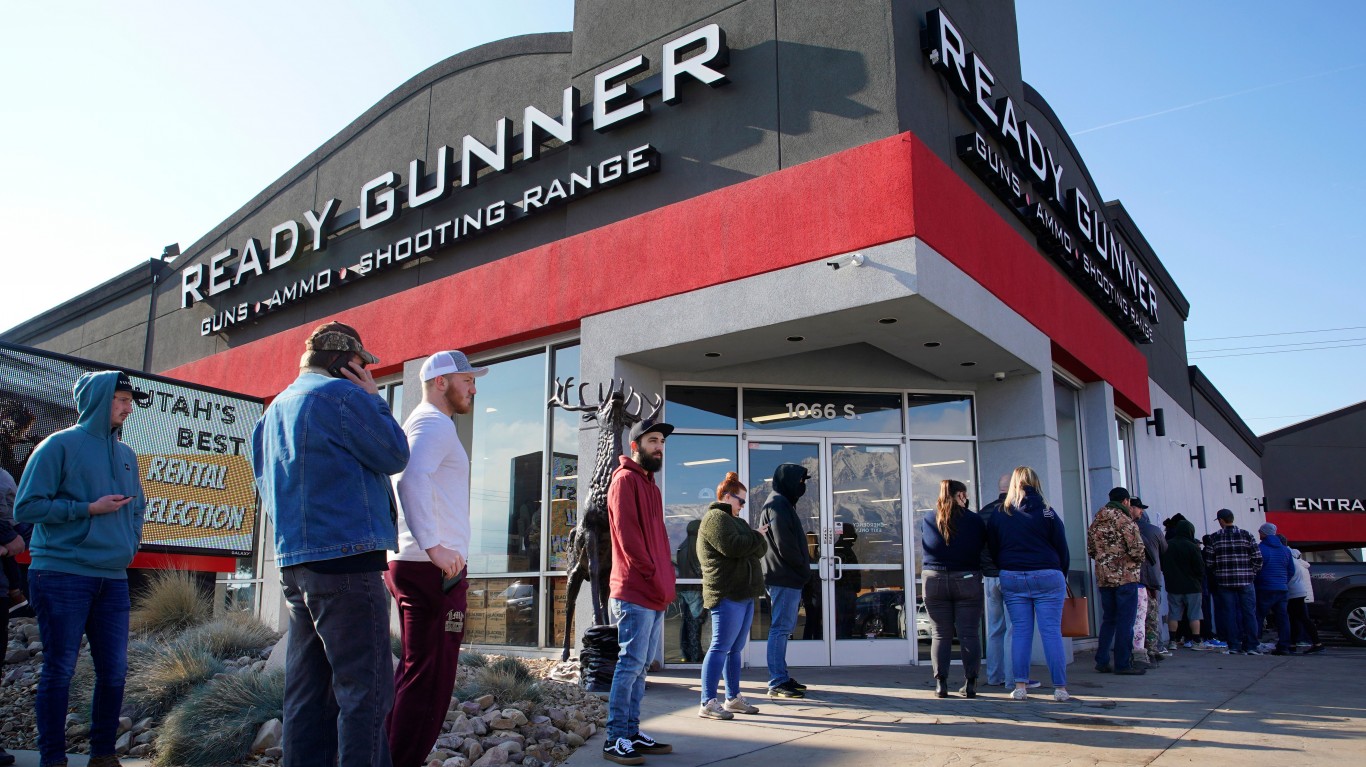
> Annual firearm death rate: 11.9 per 100,000 people
> Total annual firearm: 380 (suicides: 329, homicides: 51)
> Background checks in 2020: 1,216,773 (37,953 per 100,000 people — 3rd highest)
> 1-yr. change in background checks: +47.8% (21st lowest)
> Annual violent crime rate: 236 per 100,000 people (11th lowest)
[in-text-ad-2]
31. Virginia
> Annual firearm death rate: 11.9 per 100,000 people
> Total annual firearm: 1,014 (suicides: 661, homicides: 342)
> Background checks in 2020: 823,513 (9,648 per 100,000 people — 22nd lowest)
> 1-yr. change in background checks: +60.6% (13th highest)
> Annual violent crime rate: 208 per 100,000 people (6th lowest)

30. Pennsylvania
> Annual firearm death rate: 11.9 per 100,000 people
> Total annual firearm: 1,528 (suicides: 964, homicides: 548)
> Background checks in 2020: 1,452,921 (11,349 per 100,000 people — 21st highest)
> 1-yr. change in background checks: +47.1% (20th lowest)
> Annual violent crime rate: 306 per 100,000 people (22nd lowest)
[in-text-ad]

29. Michigan
> Annual firearm death rate: 12.0 per 100,000 people
> Total annual firearm: 1,200 (suicides: 742, homicides: 458)
> Background checks in 2020: 1,068,511 (10,699 per 100,000 people — 24th highest)
> 1-yr. change in background checks: +117.1% (the highest)
> Annual violent crime rate: 437 per 100,000 people (13th highest)

28. South Dakota
> Annual firearm death rate: 12.3 per 100,000 people
> Total annual firearm: 109 (suicides: 98, homicides: 11)
> Background checks in 2020: 115,448 (13,050 per 100,000 people — 13th highest)
> 1-yr. change in background checks: +35.1% (12th lowest)
> Annual violent crime rate: 399 per 100,000 people (20th highest)
27. Maryland
> Annual firearm death rate: 12.5 per 100,000 people
> Total annual firearm: 753 (suicides: 268, homicides: 468)
> Background checks in 2020: 302,563 (5,005 per 100,000 people — 7th lowest)
> 1-yr. change in background checks: +103.3% (3rd highest)
> Annual violent crime rate: 454 per 100,000 people (11th highest)
[in-text-ad-2]
26. Texas
> Annual firearm death rate: 12.7 per 100,000 people
> Total annual firearm: 3,683 (suicides: 2,237, homicides: 1,299)
> Background checks in 2020: 2,325,281 (8,019 per 100,000 people — 12th lowest)
> 1-yr. change in background checks: +56.4% (17th highest)
> Annual violent crime rate: 419 per 100,000 people (16th highest)

25. Oregon
> Annual firearm death rate: 13.2 per 100,000 people
> Total annual firearm: 556 (suicides: 466, homicides: 78)
> Background checks in 2020: 516,096 (12,236 per 100,000 people — 17th highest)
> 1-yr. change in background checks: +44.3% (17th lowest)
> Annual violent crime rate: 284 per 100,000 people (15th lowest)
[in-text-ad]

24. North Carolina
> Annual firearm death rate: 13.3 per 100,000 people
> Total annual firearm: 1,397 (suicides: 781, homicides: 541)
> Background checks in 2020: 890,284 (8,489 per 100,000 people — 14th lowest)
> 1-yr. change in background checks: +67.9% (8th highest)
> Annual violent crime rate: 372 per 100,000 people (23rd highest)

23. Florida
> Annual firearm death rate: 13.4 per 100,000 people
> Total annual firearm: 2,872 (suicides: 1,808, homicides: 1,013)
> Background checks in 2020: 1,912,204 (8,903 per 100,000 people — 18th lowest)
> 1-yr. change in background checks: +59.9% (14th highest)
> Annual violent crime rate: 378 per 100,000 people (22nd highest)
22. Kansas
> Annual firearm death rate: 13.4 per 100,000 people
> Total annual firearm: 390 (suicides: 291, homicides: 99)
> Background checks in 2020: 249,589 (8,567 per 100,000 people — 16th lowest)
> 1-yr. change in background checks: +49.4% (25th lowest)
> Annual violent crime rate: 411 per 100,000 people (17th highest)
[in-text-ad-2]
21. Idaho
> Annual firearm death rate: 13.5 per 100,000 people
> Total annual firearm: 241 (suicides: 223, homicides: 18)
> Background checks in 2020: 281,284 (15,740 per 100,000 people — 9th highest)
> 1-yr. change in background checks: +34.4% (11th lowest)
> Annual violent crime rate: 224 per 100,000 people (10th lowest)
20. Ohio
> Annual firearm death rate: 13.5 per 100,000 people
> Total annual firearm: 1,578 (suicides: 980, homicides: 565)
> Background checks in 2020: 976,751 (8,356 per 100,000 people — 13th lowest)
> 1-yr. change in background checks: +53.0% (22nd highest)
> Annual violent crime rate: 293 per 100,000 people (18th lowest)
[in-text-ad]
19. Indiana
> Annual firearm death rate: 14.1 per 100,000 people
> Total annual firearm: 952 (suicides: 570, homicides: 355)
> Background checks in 2020: 1,935,587 (28,751 per 100,000 people — 4th highest)
> 1-yr. change in background checks: +33.4% (10th lowest)
> Annual violent crime rate: 371 per 100,000 people (24th highest)
18. Colorado
> Annual firearm death rate: 14.4 per 100,000 people
> Total annual firearm: 832 (suicides: 647, homicides: 164)
> Background checks in 2020: 680,507 (11,817 per 100,000 people — 19th highest)
> 1-yr. change in background checks: +44.9% (18th lowest)
> Annual violent crime rate: 381 per 100,000 people (21st highest)

17. Kentucky
> Annual firearm death rate: 14.9 per 100,000 people
> Total annual firearm: 667 (suicides: 445, homicides: 201)
> Background checks in 2020: 3,330,462 (74,546 per 100,000 people — the highest)
> 1-yr. change in background checks: -19.2% (the lowest)
> Annual violent crime rate: 217 per 100,000 people (7th lowest)
[in-text-ad-2]

16. Arizona
> Annual firearm death rate: 15.6 per 100,000 people
> Total annual firearm: 1,136 (suicides: 809, homicides: 285)
> Background checks in 2020: 665,458 (9,143 per 100,000 people — 19th lowest)
> 1-yr. change in background checks: +78.4% (5th highest)
> Annual violent crime rate: 455 per 100,000 people (10th highest)

15. Nevada
> Annual firearm death rate: 15.7 per 100,000 people
> Total annual firearm: 483 (suicides: 354, homicides: 118)
> Background checks in 2020: 219,349 (7,121 per 100,000 people — 10th lowest)
> 1-yr. change in background checks: +70.9% (6th highest)
> Annual violent crime rate: 494 per 100,000 people (9th highest)
[in-text-ad]
14. West Virginia
> Annual firearm death rate: 16.0 per 100,000 people
> Total annual firearm: 286 (suicides: 196, homicides: 76)
> Background checks in 2020: 265,705 (14,826 per 100,000 people — 10th highest)
> 1-yr. change in background checks: +28.9% (6th lowest)
> Annual violent crime rate: 317 per 100,000 people (23rd lowest)

13. Georgia
> Annual firearm death rate: 16.0 per 100,000 people
> Total annual firearm: 1,695 (suicides: 955, homicides: 691)
> Background checks in 2020: 904,035 (8,515 per 100,000 people — 15th lowest)
> 1-yr. change in background checks: +67.7% (9th highest)
> Annual violent crime rate: 341 per 100,000 people (25th lowest)

12. Oklahoma
> Annual firearm death rate: 18.2 per 100,000 people
> Total annual firearm: 719 (suicides: 473, homicides: 246)
> Background checks in 2020: 470,286 (11,885 per 100,000 people — 18th highest)
> 1-yr. change in background checks: +30.6% (8th lowest)
> Annual violent crime rate: 432 per 100,000 people (14th highest)
[in-text-ad-2]
11. Montana
> Annual firearm death rate: 18.3 per 100,000 people
> Total annual firearm: 196 (suicides: 172, homicides: 24)
> Background checks in 2020: 172,695 (16,158 per 100,000 people — 7th highest)
> 1-yr. change in background checks: +49.1% (24th lowest)
> Annual violent crime rate: 405 per 100,000 people (19th highest)
10. Tennessee
> Annual firearm death rate: 18.6 per 100,000 people
> Total annual firearm: 1,270 (suicides: 746, homicides: 474)
> Background checks in 2020: 984,760 (14,420 per 100,000 people — 11th highest)
> 1-yr. change in background checks: +55.0% (19th highest)
> Annual violent crime rate: 595 per 100,000 people (3rd highest)
[in-text-ad]
9. Arkansas
> Annual firearm death rate: 18.7 per 100,000 people
> Total annual firearm: 563 (suicides: 341, homicides: 208)
> Background checks in 2020: 324,741 (10,761 per 100,000 people — 23rd highest)
> 1-yr. change in background checks: +46.7% (19th lowest)
> Annual violent crime rate: 585 per 100,000 people (4th highest)
8. South Carolina
> Annual firearm death rate: 19.4 per 100,000 people
> Total annual firearm: 1,001 (suicides: 532, homicides: 453)
> Background checks in 2020: 530,930 (10,312 per 100,000 people — 25th highest)
> 1-yr. change in background checks: +61.8% (11th highest)
> Annual violent crime rate: 511 per 100,000 people (6th highest)
7. Missouri
> Annual firearm death rate: 20.2 per 100,000 people
> Total annual firearm: 1,239 (suicides: 681, homicides: 537)
> Background checks in 2020: 708,184 (11,539 per 100,000 people — 20th highest)
> 1-yr. change in background checks: +42.2% (15th lowest)
> Annual violent crime rate: 495 per 100,000 people (8th highest)
[in-text-ad-2]

6. Louisiana
> Annual firearm death rate: 21.5 per 100,000 people
> Total annual firearm: 999 (suicides: 446, homicides: 542)
> Background checks in 2020: 430,537 (9,261 per 100,000 people — 20th lowest)
> 1-yr. change in background checks: +52.5% (23rd highest)
> Annual violent crime rate: 549 per 100,000 people (5th highest)

5. New Mexico
> Annual firearm death rate: 21.8 per 100,000 people
> Total annual firearm: 457 (suicides: 284, homicides: 158)
> Background checks in 2020: 206,252 (9,836 per 100,000 people — 23rd lowest)
> 1-yr. change in background checks: +31.5% (9th lowest)
> Annual violent crime rate: 832 per 100,000 people (2nd highest)
[in-text-ad]

4. Alabama
> Annual firearm death rate: 21.8 per 100,000 people
> Total annual firearm: 1,071 (suicides: 543, homicides: 486)
> Background checks in 2020: 1,085,475 (22,138 per 100,000 people — 5th highest)
> 1-yr. change in background checks: +57.3% (16th highest)
> Annual violent crime rate: 511 per 100,000 people (7th highest)

3. Wyoming
> Annual firearm death rate: 22.5 per 100,000 people
> Total annual firearm: 130 (suicides: 114, homicides: 16)
> Background checks in 2020: 91,384 (15,790 per 100,000 people — 8th highest)
> 1-yr. change in background checks: +49.1% (23rd lowest)
> Annual violent crime rate: 217 per 100,000 people (8th lowest)
2. Alaska
> Annual firearm death rate: 23.0 per 100,000 people
> Total annual firearm: 168 (suicides: 117, homicides: 51)
> Background checks in 2020: 98,952 (13,526 per 100,000 people — 12th highest)
> 1-yr. change in background checks: +28.6% (4th lowest)
> Annual violent crime rate: 867 per 100,000 people (the highest)
[in-text-ad-2]
1. Mississippi
> Annual firearm death rate: 23.7 per 100,000 people
> Total annual firearm: 705 (suicides: 308, homicides: 366)
> Background checks in 2020: 366,829 (12,326 per 100,000 people — 16th highest)
> 1-yr. change in background checks: +53.9% (20th highest)
> Annual violent crime rate: 278 per 100,000 people (14th lowest)
Thank you for reading! Have some feedback for us?
Contact the 24/7 Wall St. editorial team.
 24/7 Wall St.