Special Report
Cities Where Law Enforcement Makes the Most Arrests

Published:
Last Updated:

In 2019, the last year for which comprehensive statistics are available, the FBI’s Uniform Crime Reporting Program reported 10,085,207 arrests nationwide. That works out to 3,011 arrests per 100,000 residents. Of that number, 495,871 were for violent crimes (murder and nonnegligent manslaughter, rape, robbery, and aggravated assault) and 1,074,367 were for property-related crimes (burglary, larceny-theft, motor vehicle theft, and arson).
The good news is that arrests for violent crimes dropped 0.9% in 2019 compared to 2018, while property crime arrests decreased 3.4%. In addition, the FBI issued a preliminary report in September of 2020 showing that in the first six months of 2020, arrests for rape declined by 17.8% and those for property crimes by 7.1% compared to the first six months of 2019. However, murders and nonnegligent manslaughter arrests rose by 14.8% and aggravated assault arrests by 4.6%. (See the American cities where crime is soaring.)
24/7 Wall St. has compiled a list of the major American cities (those with populations over 200,000) that have seen the highest average number of arrests per capita from 2013 through 2019. Data is drawn from the FBI’s Uniform Crime Reporting Program, and reflects the number of arrests, not the number of people arrested (i.e., one person may be arrested several times). It does not reflect the number of prosecutions or convictions. (Population data comes from the U.S. Census Bureau.)
Click here to see the cities where people get arrested the most.
On June 23, the White House announced a comprehensive plan to combat gun violence and other violent crime. The initiative includes increased funding for local law enforcement, investment in community violence intervention programs, an expansion of employment opportunities for teens and young adults, and increased efforts to stem the flow of illegal firearms.
Tampa, Florida, should be the first place to take advantage of this initiative: It has the dubious honor of being the American city with the highest number of arrests per 100,000 residents. (These, on the other hand, are the 25 cities where crime is falling.)
25. Pittsburgh, Pennsylvania
> Arrest rate, 2013-2019: 4,312 per 100,000 residents
> Avg. total annual arrests, 2013-2019: 13,089
> Violent crime rate, 2013-2019: 680.2 per 100,000 residents
[in-text-ad]
24. Colorado Springs, Colorado
> Arrest rate, 2013-2019: 4,381 per 100,000 residents
> Avg. total annual arrests, 2013-2019: 20,041
> Violent crime rate, 2013-2019: 503.6 per 100,000 residents

23. St. Petersburg, Florida
> Arrest rate, 2013-2019: 4,460 per 100,000 residents
> Avg. total annual arrests, 2013-2019: 11,553
> Violent crime rate, 2013-2019: 732.1 per 100,000 residents

22. Fresno, California
> Arrest rate, 2013-2019: 4,518 per 100,000 residents
> Avg. total annual arrests, 2013-2019: 23,599
> Violent crime rate, 2013-2019: 530.5 per 100,000 residents
[in-text-ad-2]

21. Mesa, Arizona
> Arrest rate, 2013-2019: 4,519 per 100,000 residents
> Avg. total annual arrests, 2013-2019: 22,196
> Violent crime rate, 2013-2019: 400.9 per 100,000 residents
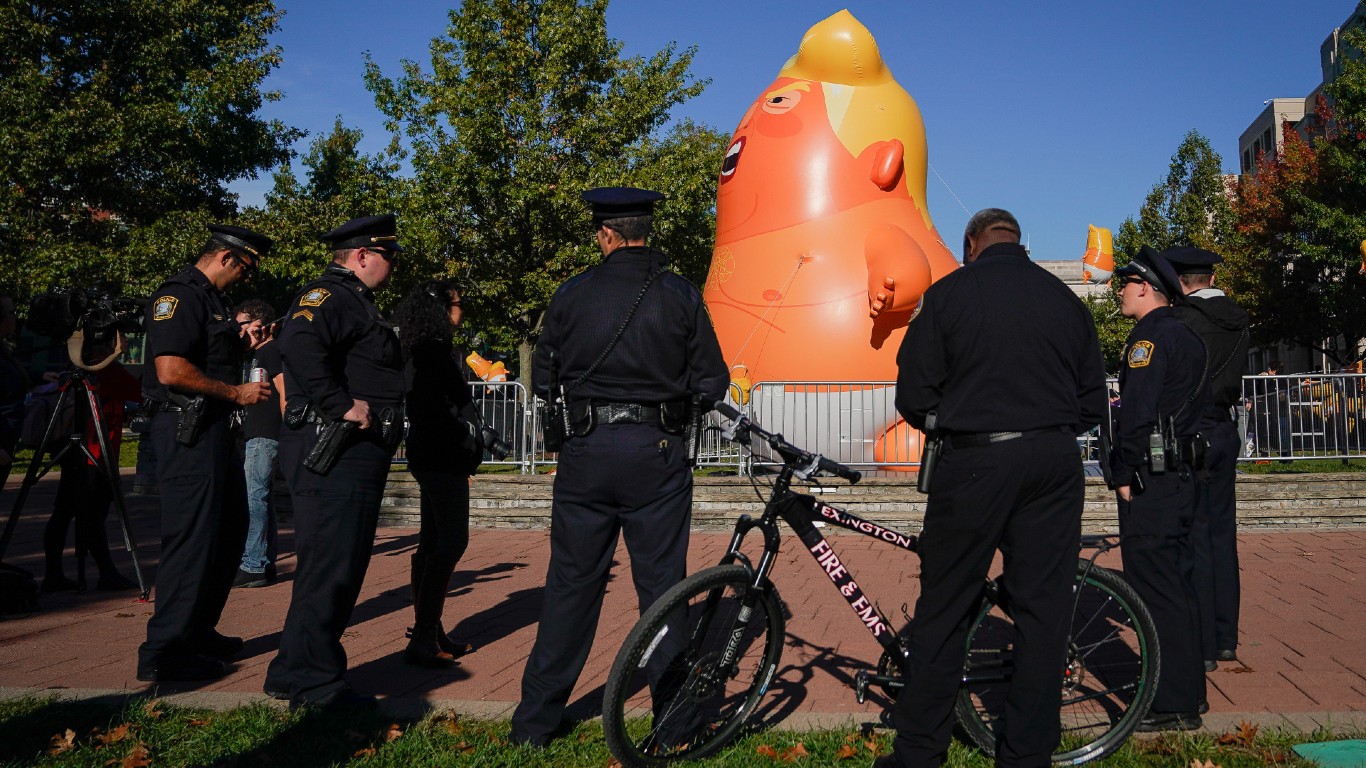
20. Lexington, Kentucky
> Arrest rate, 2013-2019: 4,642 per 100,000 residents
> Avg. total annual arrests, 2013-2019: 14,796
> Violent crime rate, 2013-2019: 322.3 per 100,000 residents
[in-text-ad]

19. Lincoln, Nebraska
> Arrest rate, 2013-2019: 4,707 per 100,000 residents
> Avg. total annual arrests, 2013-2019: 13,219
> Violent crime rate, 2013-2019: 361.9 per 100,000 residents
18. Anchorage, Alaska
> Arrest rate, 2013-2019: 4,724 per 100,000 residents
> Avg. total annual arrests, 2013-2019: 13,988
> Violent crime rate, 2013-2019: 1,093.2 per 100,000 residents

17. Bakersfield, California
> Arrest rate, 2013-2019: 4,773 per 100,000 residents
> Avg. total annual arrests, 2013-2019: 17,931
> Violent crime rate, 2013-2019: 481.2 per 100,000 residents
[in-text-ad-2]
16. Aurora, Colorado
> Arrest rate, 2013-2019: 4,805 per 100,000 residents
> Avg. total annual arrests, 2013-2019: 17,468
> Violent crime rate, 2013-2019: 559.8 per 100,000 residents

15. Atlanta, Georgia
> Arrest rate, 2013-2019: 5,019 per 100,000 residents
> Avg. total annual arrests, 2013-2019: 24,075
> Violent crime rate, 2013-2019: 976.3 per 100,000 residents
[in-text-ad]
14. Memphis, Tennessee
> Arrest rate, 2013-2019: 5,053 per 100,000 residents
> Avg. total annual arrests, 2013-2019: 33,009
> Violent crime rate, 2013-2019: 1,833.0 per 100,000 residents
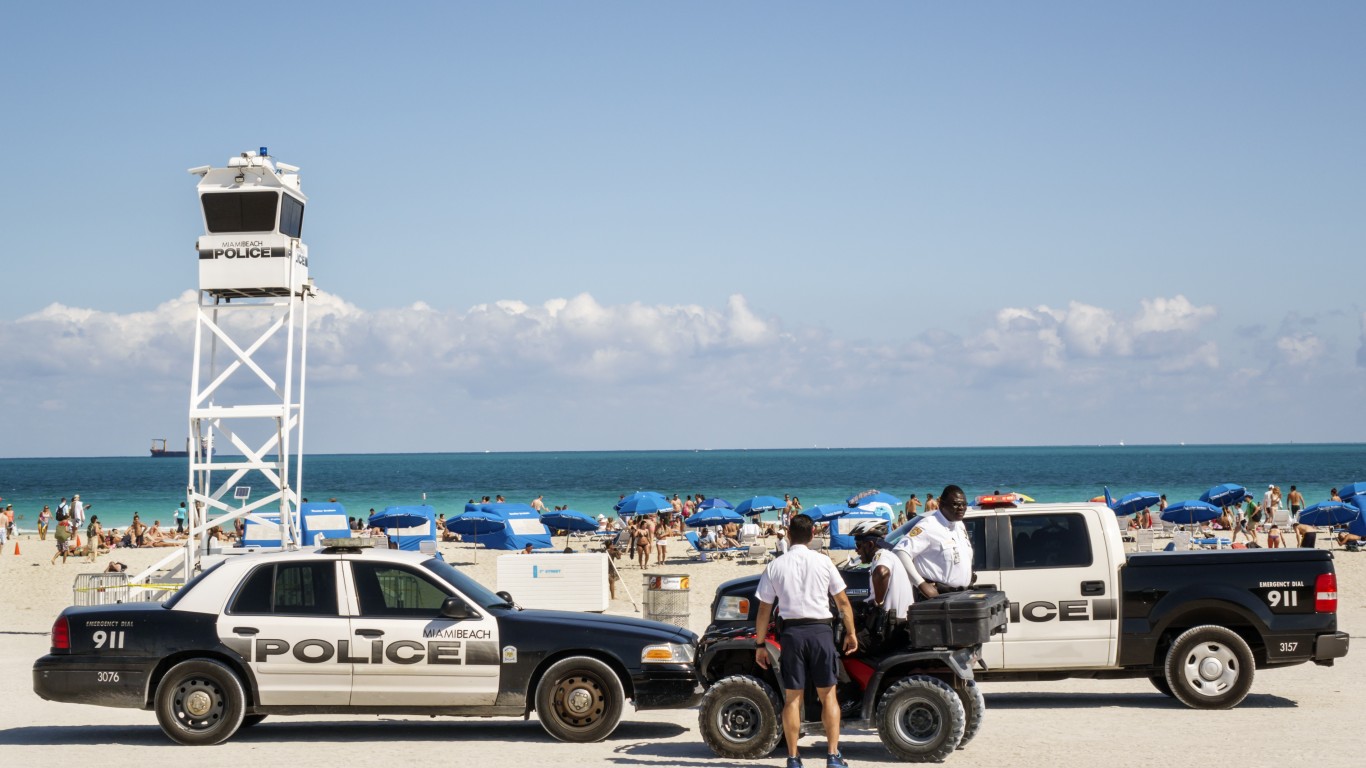
13. Miami, Florida
> Arrest rate, 2013-2019: 5,076 per 100,000 residents
> Avg. total annual arrests, 2013-2019: 22,902
> Violent crime rate, 2013-2019: 856.3 per 100,000 residents
12. Baltimore, Maryland
> Arrest rate, 2013-2019: 5,105 per 100,000 residents
> Avg. total annual arrests, 2013-2019: 31,379
> Violent crime rate, 2013-2019: 1,679.2 per 100,000 residents
[in-text-ad-2]
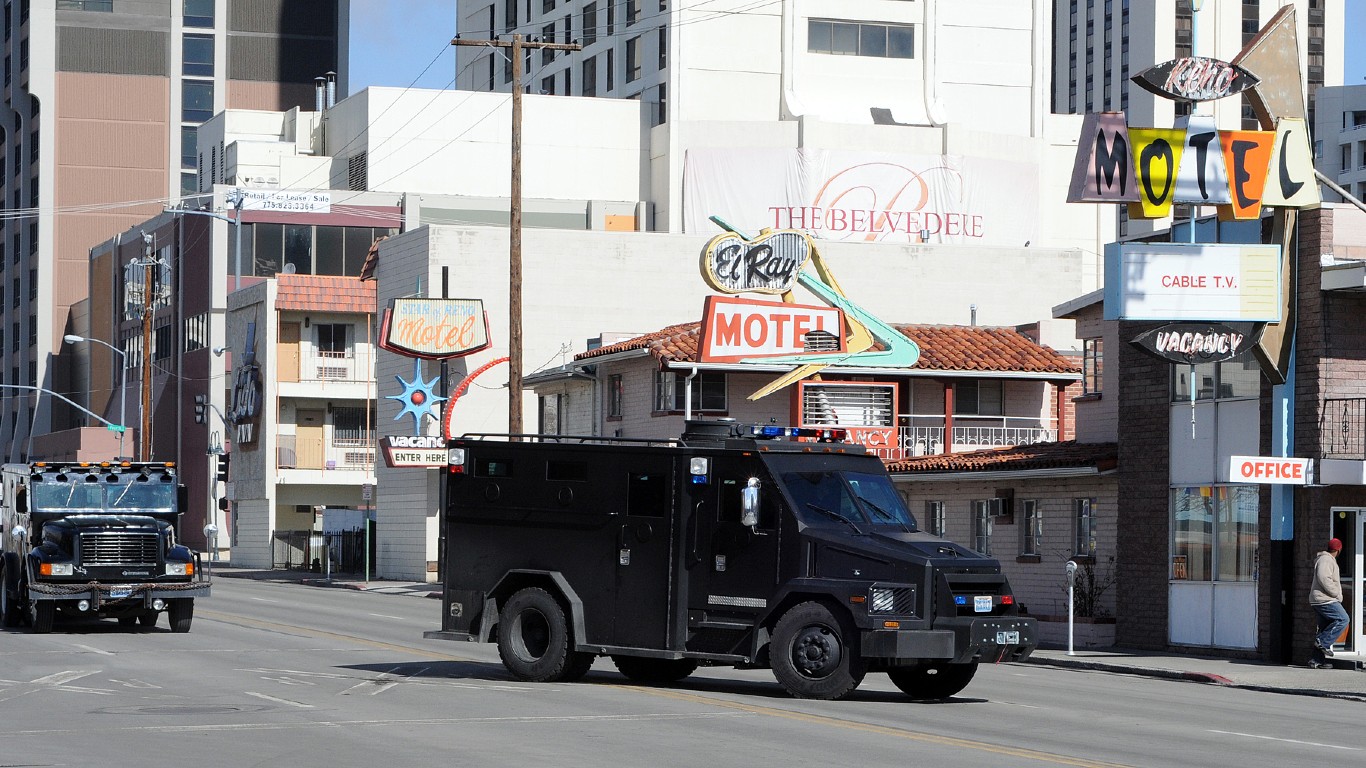
11. Reno, Nevada
> Arrest rate, 2013-2019: 5,156 per 100,000 residents
> Avg. total annual arrests, 2013-2019: 12,510
> Violent crime rate, 2013-2019: 598.6 per 100,000 residents

10. Corpus Christi, Texas
> Arrest rate, 2013-2019: 5,251 per 100,000 residents
> Avg. total annual arrests, 2013-2019: 17,049
> Violent crime rate, 2013-2019: 698.3 per 100,000 residents
[in-text-ad]
9. Norfolk, Virginia
> Arrest rate, 2013-2019: 5,457 per 100,000 residents
> Avg. total annual arrests, 2013-2019: 13,401
> Violent crime rate, 2013-2019: 550.6 per 100,000 residents
8. New Orleans, Louisiana
> Arrest rate, 2013-2019: 5,547 per 100,000 residents
> Avg. total annual arrests, 2013-2019: 21,613
> Violent crime rate, 2013-2019: 1,037.9 per 100,000 residents
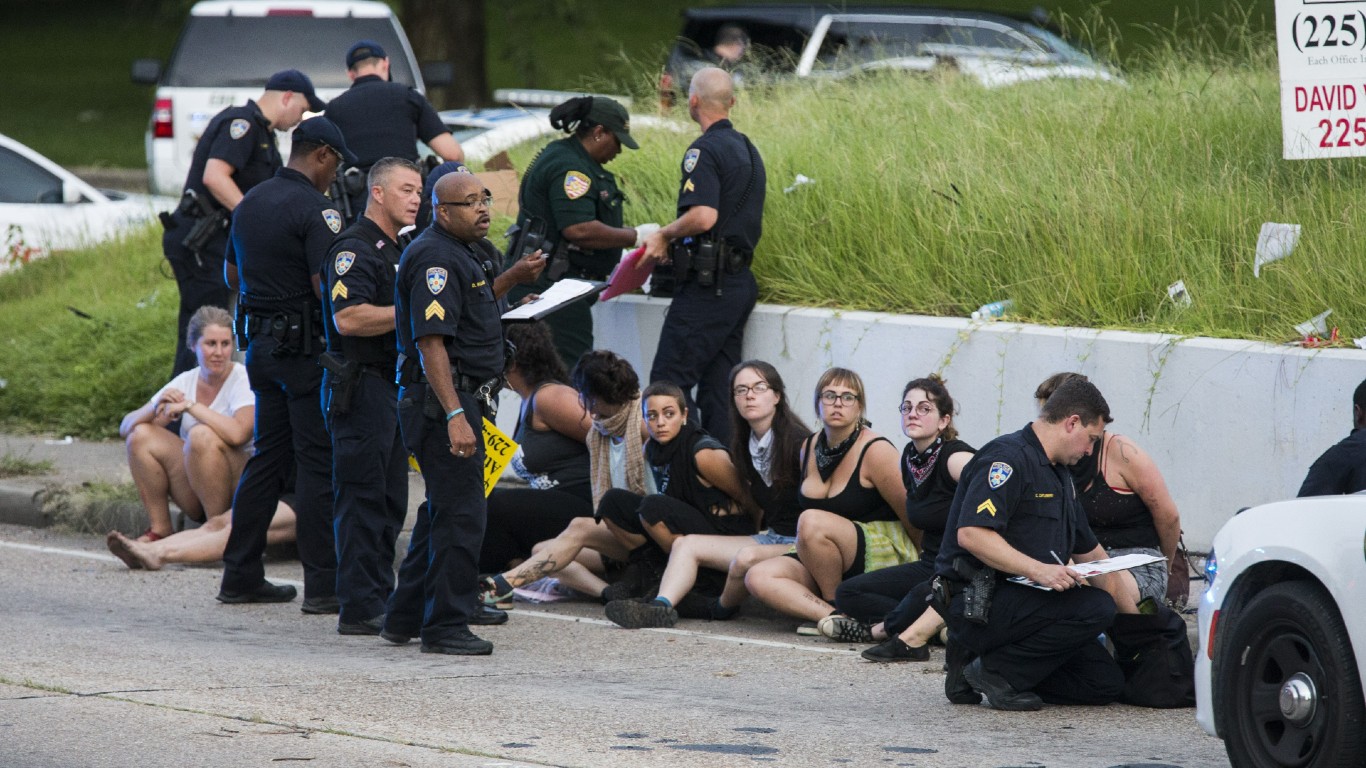
7. Baton Rouge, Louisiana
> Arrest rate, 2013-2019: 5,625 per 100,000 residents
> Avg. total annual arrests, 2013-2019: 12,677
> Violent crime rate, 2013-2019: 942.1 per 100,000 residents
[in-text-ad-2]

6. Nashville, Tennessee
> Arrest rate, 2013-2019: 5,945 per 100,000 residents
> Avg. total annual arrests, 2013-2019: 39,240
> Violent crime rate, 2013-2019: 1,108.1 per 100,000 residents
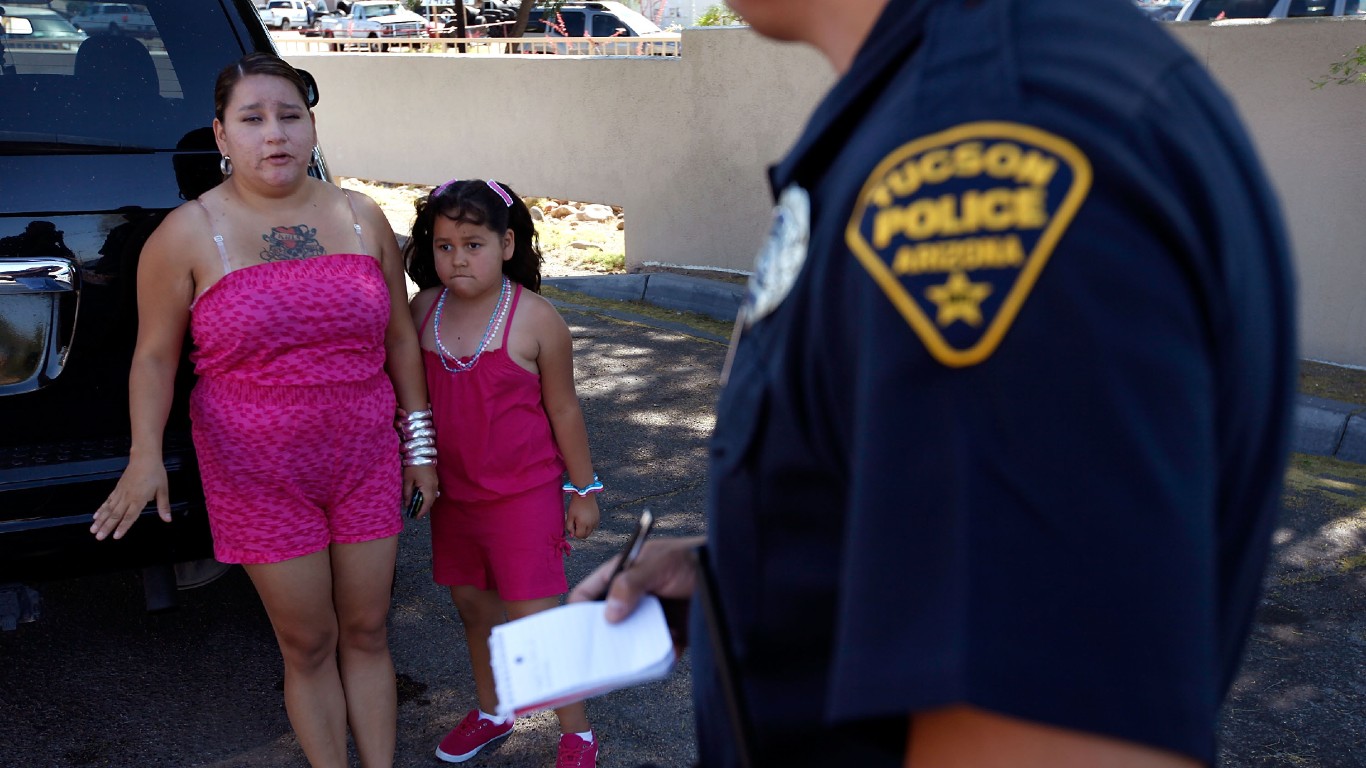
5. Tucson, Arizona
> Arrest rate, 2013-2019: 6,023 per 100,000 residents
> Avg. total annual arrests, 2013-2019: 32,475
> Violent crime rate, 2013-2019: 713.6 per 100,000 residents
[in-text-ad]
4. St. Louis, Missouri
> Arrest rate, 2013-2019: 6,052 per 100,000 residents
> Avg. total annual arrests, 2013-2019: 18,838
> Violent crime rate, 2013-2019: 1,835.1 per 100,000 residents

3. Louisville, Kentucky
> Arrest rate, 2013-2019: 6,317 per 100,000 residents
> Avg. total annual arrests, 2013-2019: 38,976
> Violent crime rate, 2013-2019: 696.4 per 100,000 residents

2. Winston-Salem, North Carolina
> Arrest rate, 2013-2019: 6,596 per 100,000 residents
> Avg. total annual arrests, 2013-2019: 15,971
> Violent crime rate, 2013-2019: 644.7 per 100,000 residents
[in-text-ad-2]

1. Tampa, Florida
> Arrest rate, 2013-2019: 6,922 per 100,000 residents
> Avg. total annual arrests, 2013-2019: 26,052
> Violent crime rate, 2013-2019: 508.2 per 100,000 residents
Are you ready for retirement? Planning for retirement can be overwhelming, that’s why it could be a good idea to speak to a fiduciary financial advisor about your goals today.
Start by taking this retirement quiz right here from SmartAsset that will match you with up to 3 financial advisors that serve your area and beyond in 5 minutes. Smart Asset is now matching over 50,000 people a month.
Click here now to get started.
Thank you for reading! Have some feedback for us?
Contact the 24/7 Wall St. editorial team.