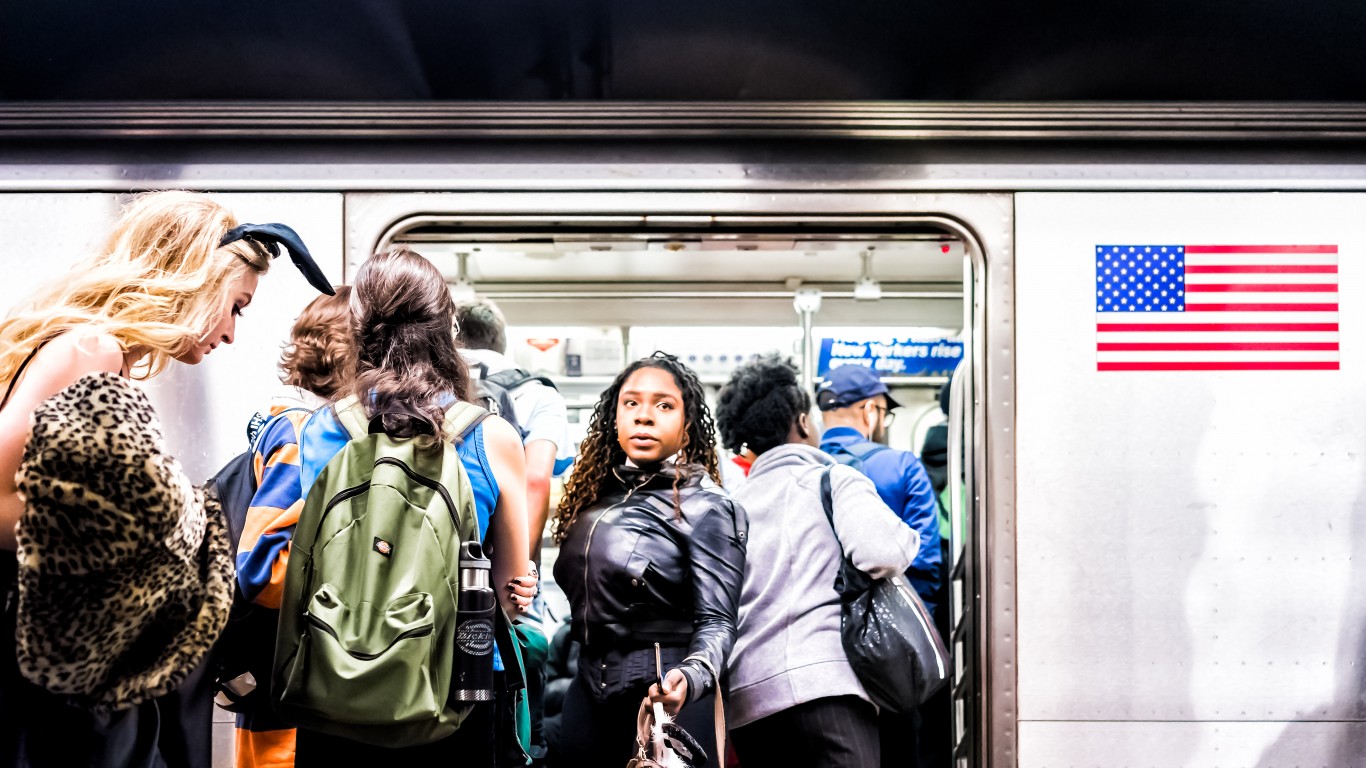
Big cities have many attractions as centers of business, arts, and entertainment, but they also have their downsides, including congestion, poor air quality, crime, and lack of employment opportunities, especially in certain neighborhoods. These are the cities with the worst unemployment since the pandemic started.
These issues are among the top causes of stress for those living in urban environments. 24/7 Tempo has compiled a list of the most stressed-out cities in the country, based on these and a number of other factors.
The two cities where stress is the worst are Cleveland and Detroit, both of which were once booming manufacturing centers that fell on hard times. (At one point in the late 19th century, Cleveland was home to more than 50% of the world’s millionaires; in the first half of the 20th century, Detroit was known worldwide as the capital of the automobile industry.) Both are also known for high degrees of racial inequality, which correlates with poverty and unemployment and thus with stress. Here is the worst city to live in in every state.
No part of the country is immune to hardship and stress, however. Almost half the most stressed-out cities are in the Deep South or Texas. The list also includes cities in New England, such as Providence, Rhode Island and Worcester, Massachusetts, as well as some in the West and Southwest, such as Phoenix, Arizona and San Bernardino, California.
Right in the middle of the list is New York. It’s the biggest city in the country and is home to some of the wealthiest people as well as the poorest. It certainly has big-city stress but it also continues to attract people from all over the world looking for their piece of the American Dream.
Click here for the 50 most stressed-out cities in the U.S.
Methodology
To identify the most stressed out cities, 24/7 Tempo reviewed a ranking of stressed-out cities on WalletHub, a credit advice site owned by Evolution Finance, Inc. The site’s study looked at 182 U.S. cities, applying some 42 different measures of stress related to work, financial issues, family, and health and safety to develop a stress score for each city. Data came from 18 government and private sites. The percentage of households with incomes under $10,000 and the five-year unemployment rate for 2015-2019 is from the U.S. Census Bureau’s American Community Survey for 2019.

50. San Antonio, Texas
> High stress score: 52.0
> Households with incomes under $10,000: 39,657, 7.9% — #7 highest out of 182 cities
> Estimated unemployment rate (2015-2019): 5.5% — #93 highest out of 182 cities
[in-text-ad]
49. Worcester, Massachusetts
> High stress score: 52.1
> Households with incomes under $10,000: 7,472, 10.4% — #83 highest out of 182 cities
> Estimated unemployment rate (2015-2019): 5.6% — #88 highest out of 182 cities

47. New Haven, Connecticut
> High stress score: 52.3
> Households with incomes under $10,000: 5,542, 11.3% — #112 highest out of 182 cities
> Estimated unemployment rate (2015-2019): 9.0% — #14 highest out of 182 cities

48. Providence, Rhode Island
> High stress score: 52.3
> Households with incomes under $10,000: 7,475, 12.1% — #82 highest out of 182 cities
> Estimated unemployment rate (2015-2019): 7.8% — #31 highest out of 182 cities
[in-text-ad-2]

46. Bridgeport, Connecticut
> High stress score: 52.5
> Households with incomes under $10,000: 5,316, 10.5% — #113 highest out of 182 cities
> Estimated unemployment rate (2015-2019): 12.5% — #3 highest out of 182 cities

45. Washington, District of Columbia
> High stress score: 52.8
> Households with incomes under $10,000: 24,456, 8.6% — #16 highest out of 182 cities
> Estimated unemployment rate (2015-2019): 6.9% — #39 highest out of 182 cities
[in-text-ad]
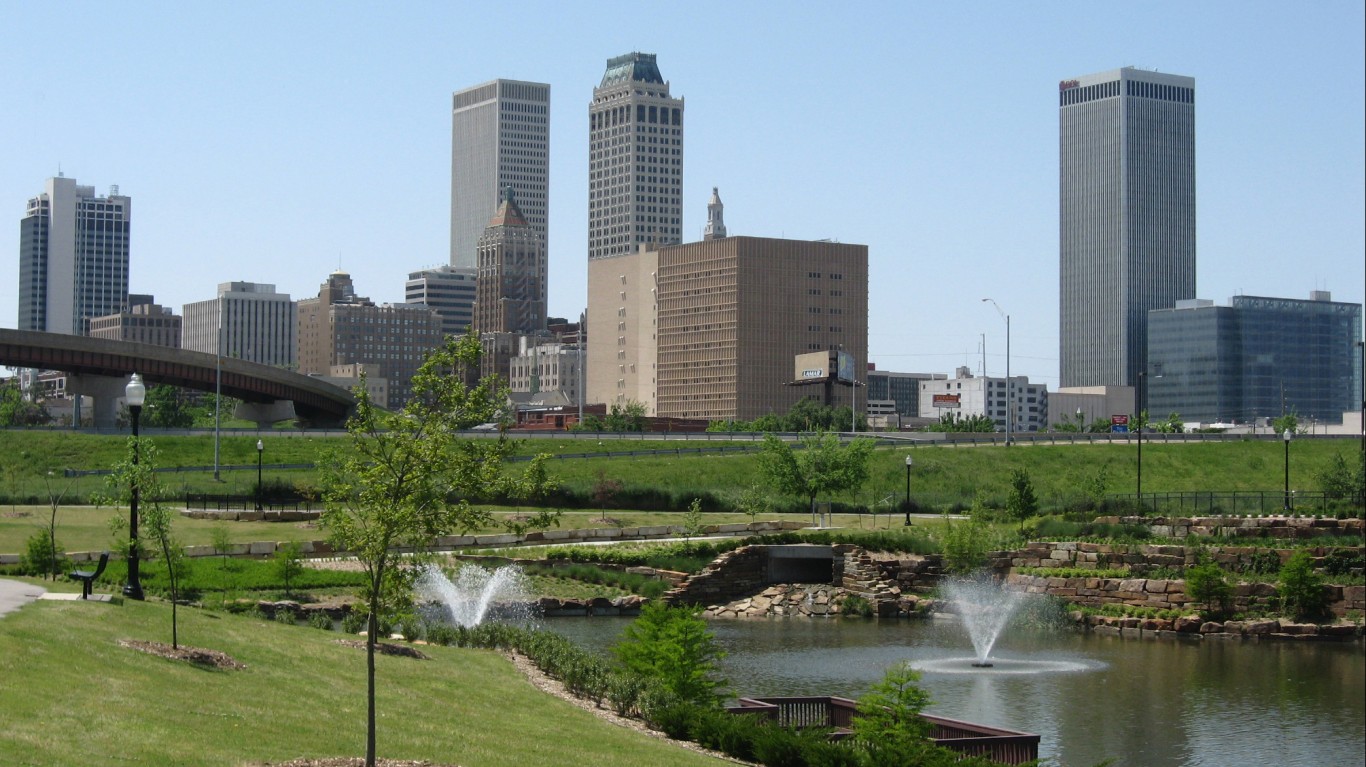
44. Tulsa, Oklahoma
> High stress score: 52.8
> Households with incomes under $10,000: 14,556, 8.9% — #44 highest out of 182 cities
> Estimated unemployment rate (2015-2019): 6.3% — #56 highest out of 182 cities
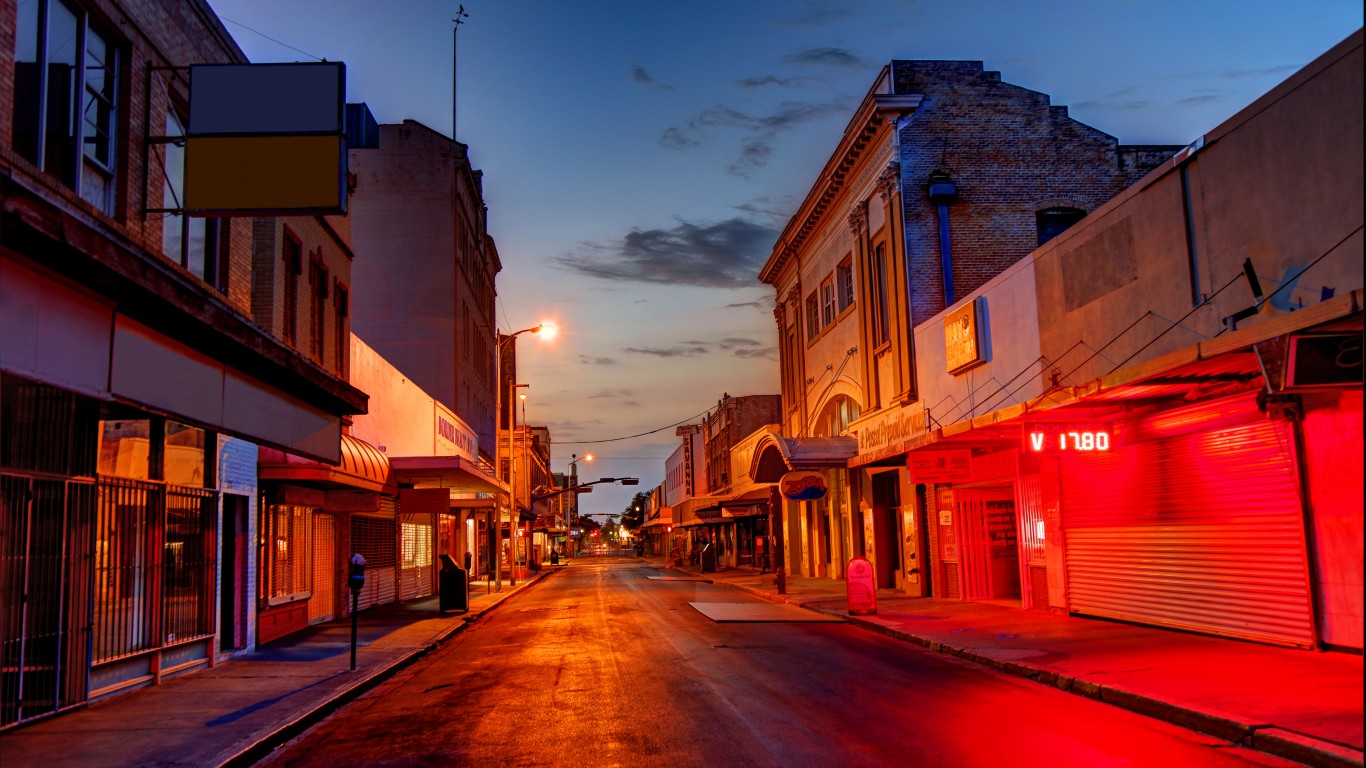
43. Laredo, Texas
> High stress score: 53.2
> Households with incomes under $10,000: 7,159, 10.1% — #84 highest out of 182 cities
> Estimated unemployment rate (2015-2019): 4.8% — #125 highest out of 182 cities
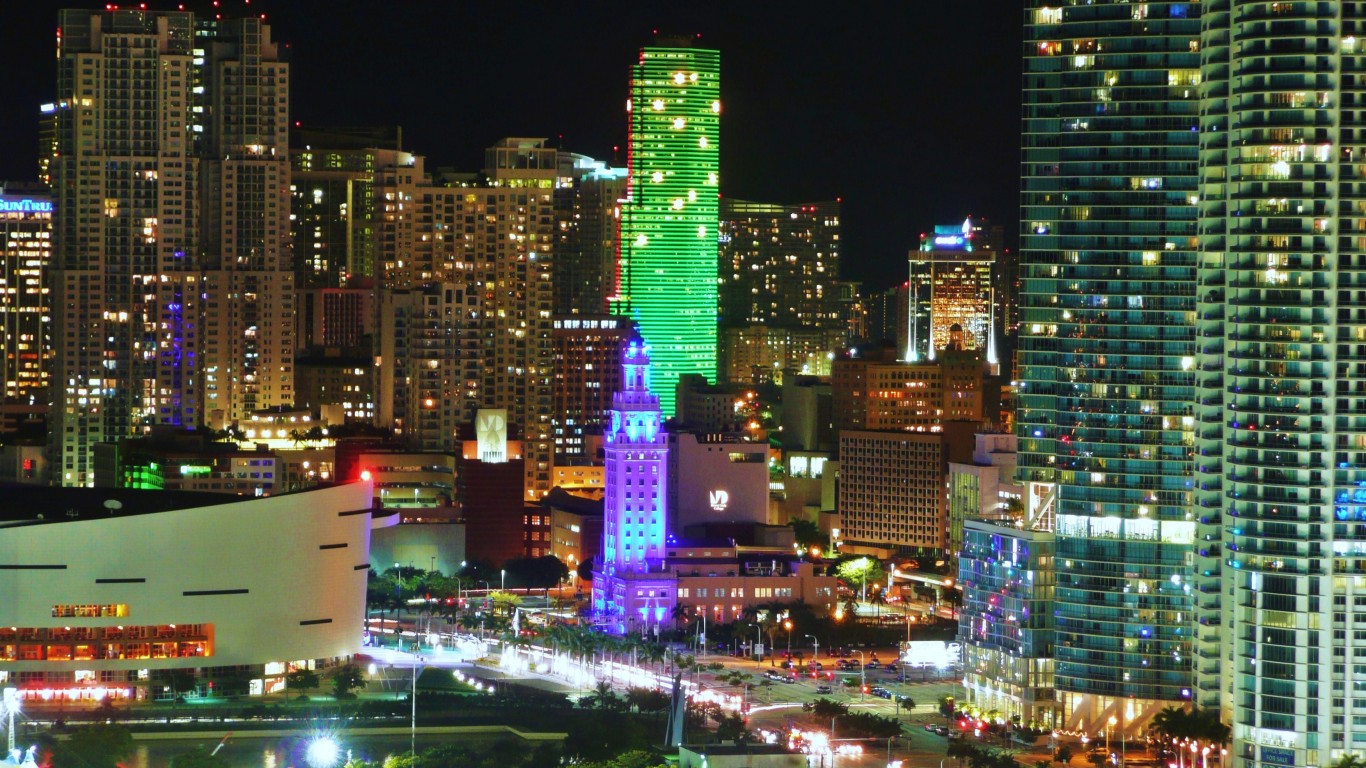
42. Miami, Florida
> High stress score: 53.5
> Households with incomes under $10,000: 23,885, 13.5% — #17 highest out of 182 cities
> Estimated unemployment rate (2015-2019): 6.0% — #68 highest out of 182 cities
[in-text-ad-2]

41. Phoenix, Arizona
> High stress score: 53.6
> Households with incomes under $10,000: 36,101, 6.4% — #9 highest out of 182 cities
> Estimated unemployment rate (2015-2019): 5.4% — #97 highest out of 182 cities
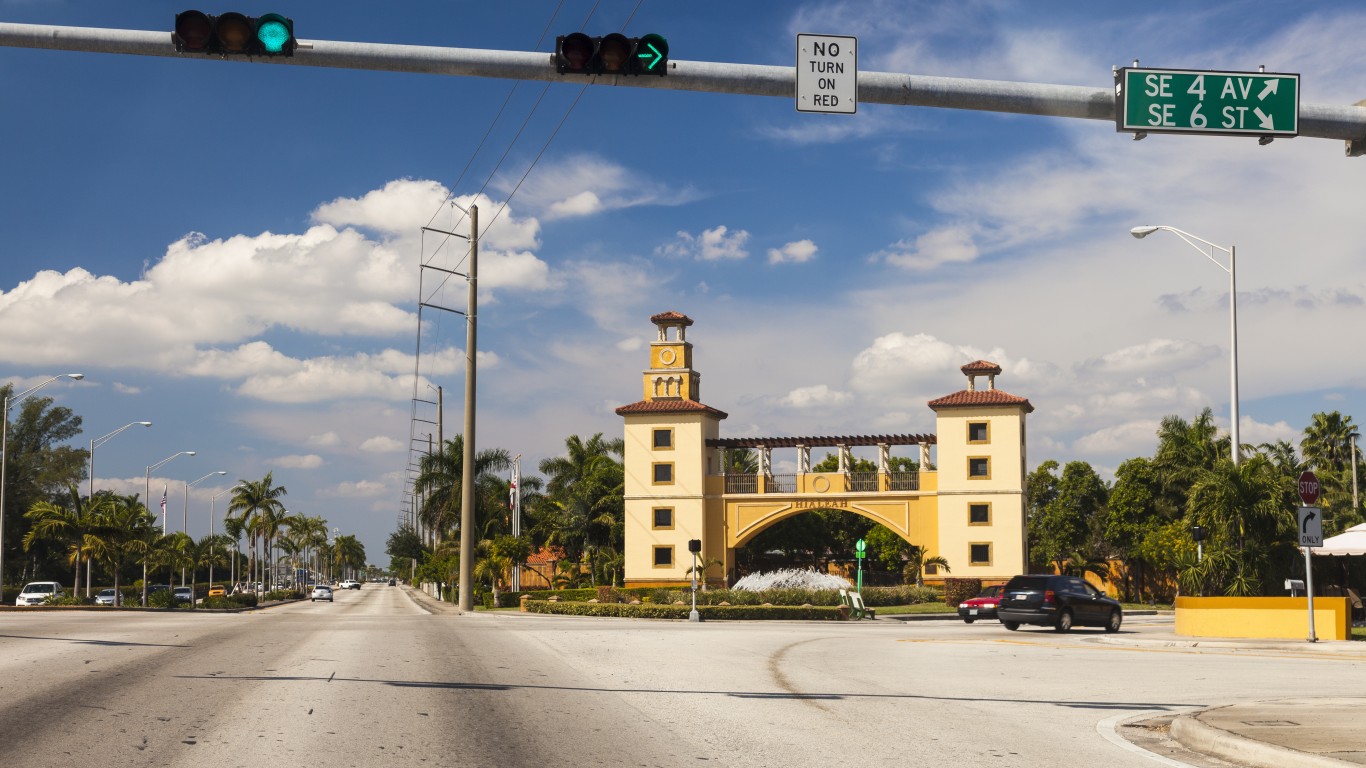
40. Hialeah, Florida
> High stress score: 53.7
> Households with incomes under $10,000: 8,939, 12.0% — #65 highest out of 182 cities
> Estimated unemployment rate (2015-2019): 4.6% — #134 highest out of 182 cities
[in-text-ad]
39. Chattanooga, Tennessee
> High stress score: 53.9
> Households with incomes under $10,000: 5,899, 7.8% — #104 highest out of 182 cities
> Estimated unemployment rate (2015-2019): 6.1% — #64 highest out of 182 cities

38. Richmond, Virginia
> High stress score: 54.0
> Households with incomes under $10,000: 10,149, 11.2% — #54 highest out of 182 cities
> Estimated unemployment rate (2015-2019): 6.5% — #50 highest out of 182 cities
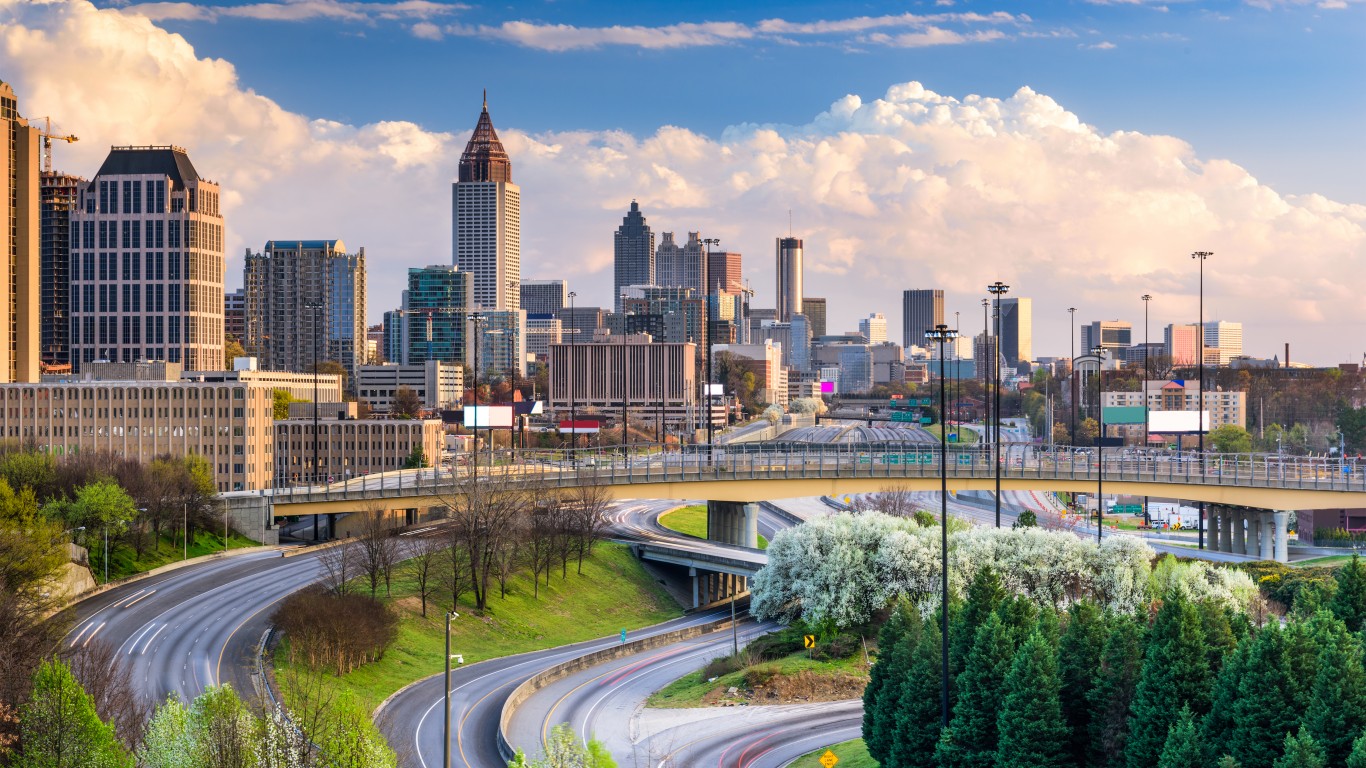
37. Atlanta, Georgia
> High stress score: 54.0
> Households with incomes under $10,000: 20,326, 9.9% — #24 highest out of 182 cities
> Estimated unemployment rate (2015-2019): 6.4% — #54 highest out of 182 cities
[in-text-ad-2]
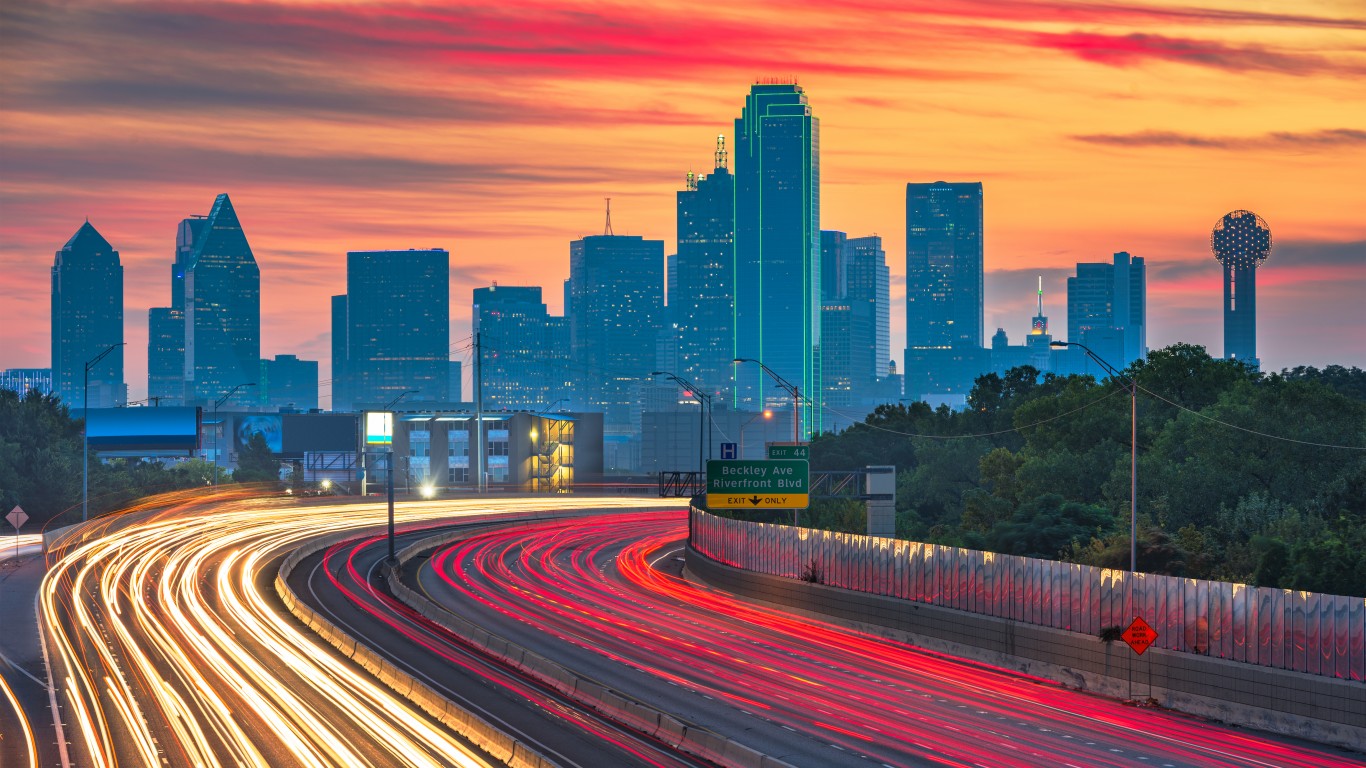
36. Dallas, Texas
> High stress score: 54.2
> Households with incomes under $10,000: 38,710, 7.5% — #8 highest out of 182 cities
> Estimated unemployment rate (2015-2019): 4.7% — #129 highest out of 182 cities
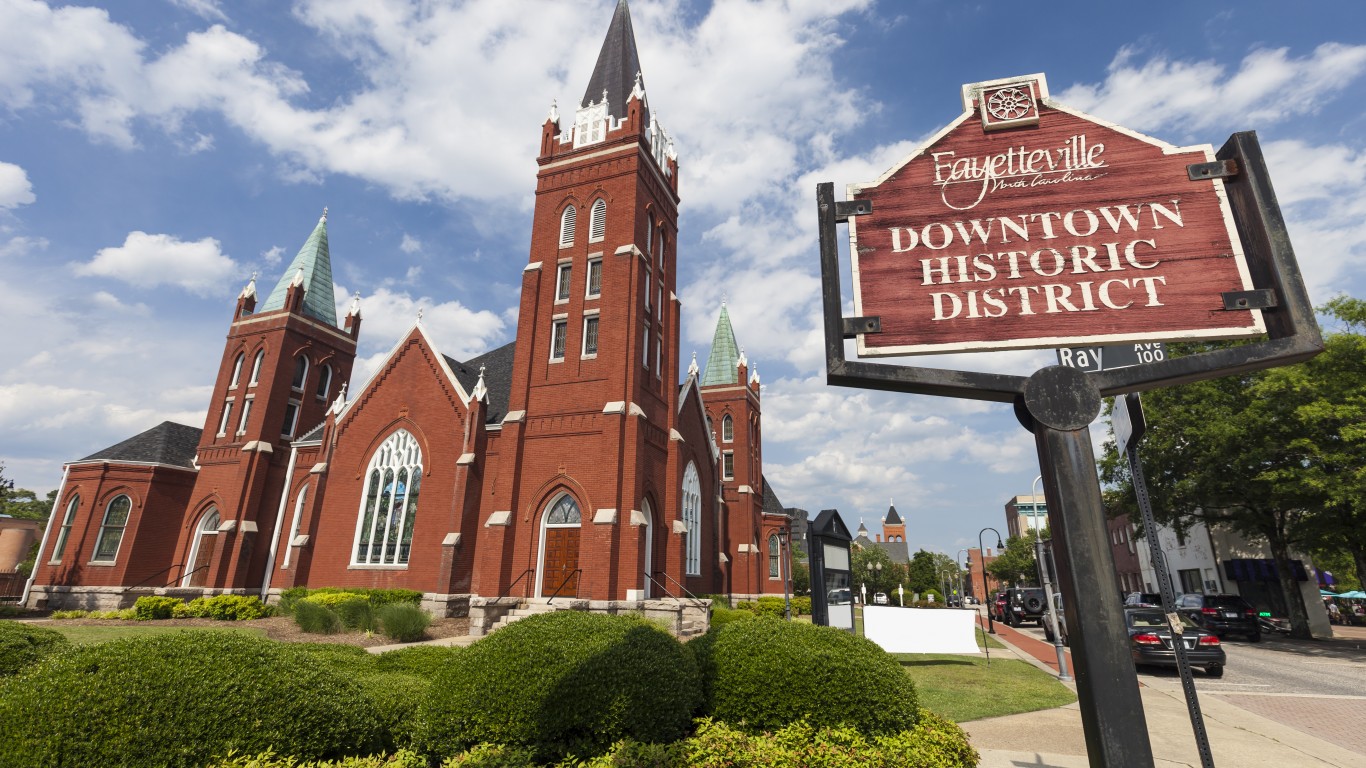
35. Fayetteville, North Carolina
> High stress score: 54.3
> Households with incomes under $10,000: 6,892, 8.5% — #90 highest out of 182 cities
> Estimated unemployment rate (2015-2019): 9.1% — #12 highest out of 182 cities
[in-text-ad]
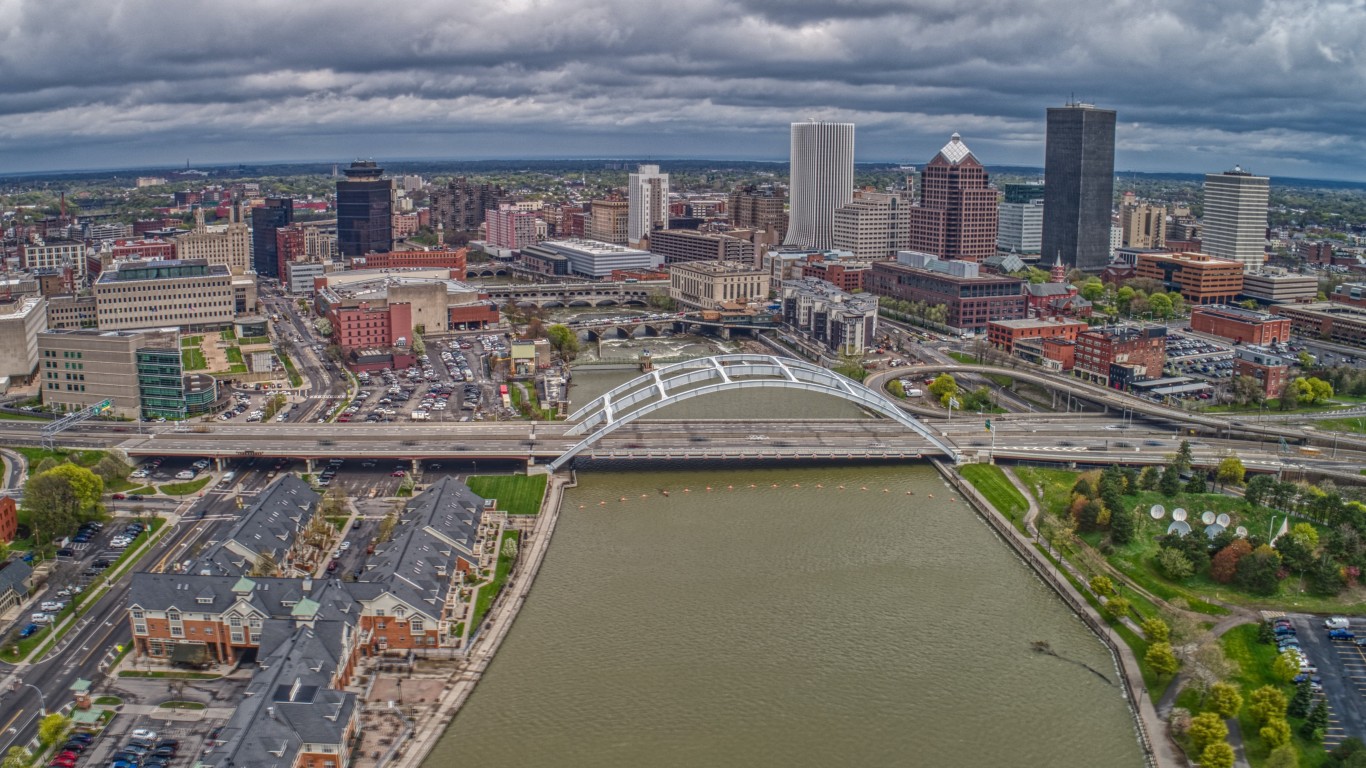
34. Rochester, New York
> High stress score: 54.4
> Households with incomes under $10,000: 11,528, 13.4% — #51 highest out of 182 cities
> Estimated unemployment rate (2015-2019): 10.2% — #7 highest out of 182 cities
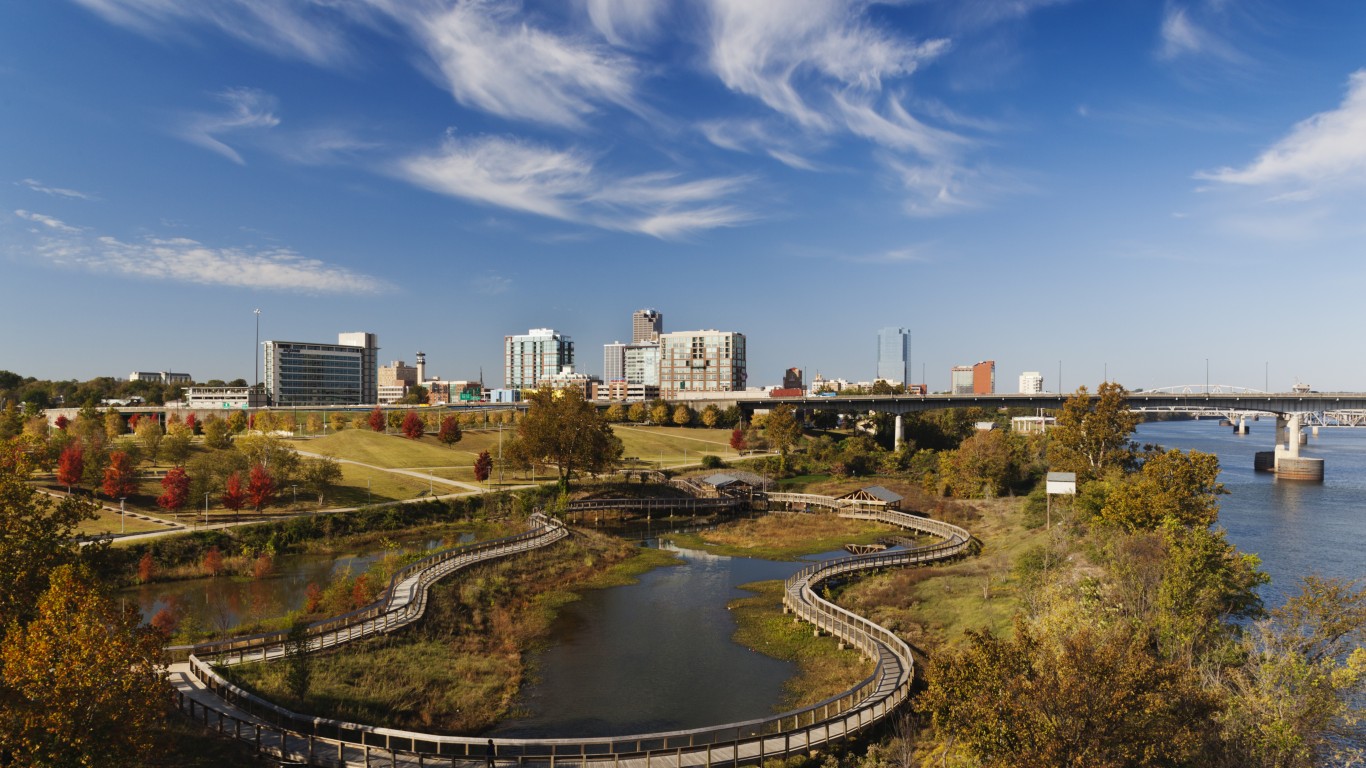
33. Little Rock, Arkansas
> High stress score: 54.4
> Households with incomes under $10,000: 6,914, 8.4% — #89 highest out of 182 cities
> Estimated unemployment rate (2015-2019): 4.1% — #153 highest out of 182 cities
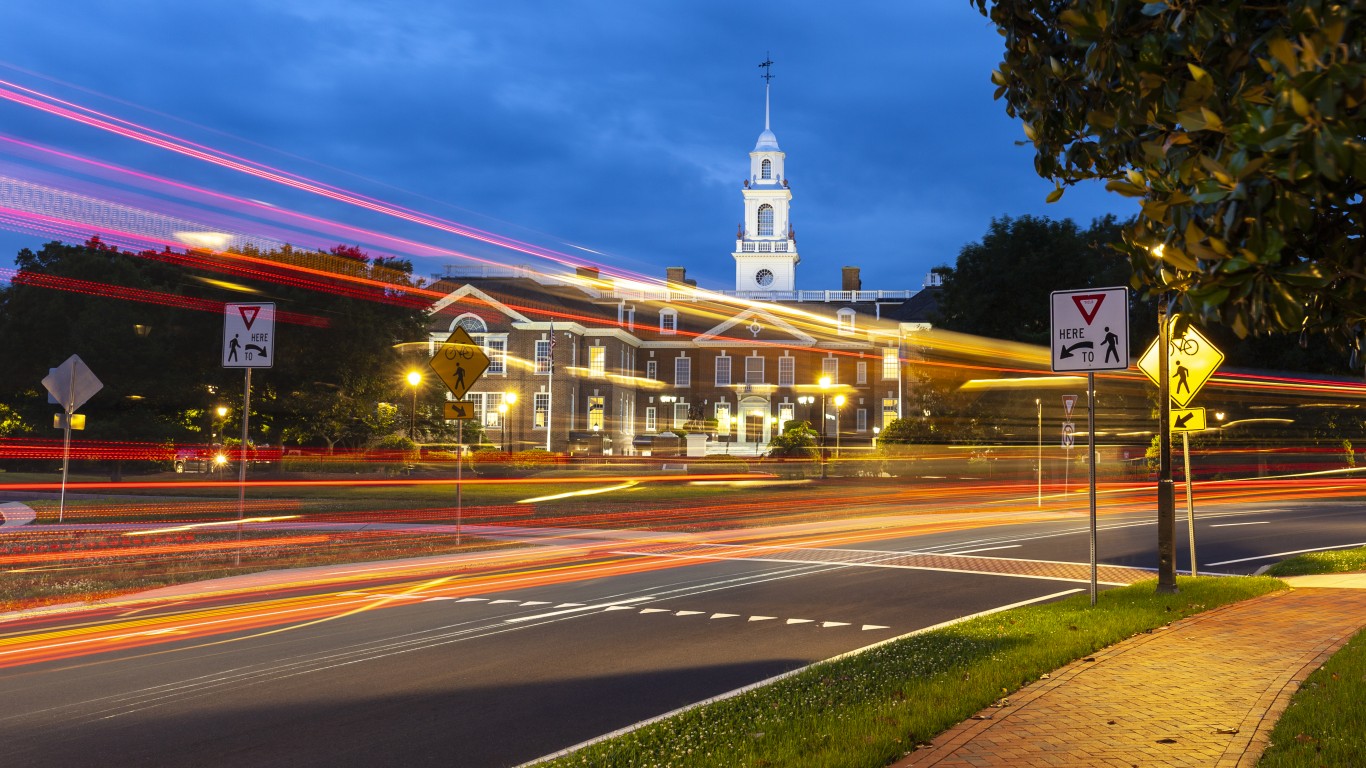
32. Dover, Delaware
> High stress score: 54.5
> Households with incomes under $10,000: 866, 6.1% — #179 highest out of 182 cities
> Estimated unemployment rate (2015-2019): 6.2% — #61 highest out of 182 cities
[in-text-ad-2]
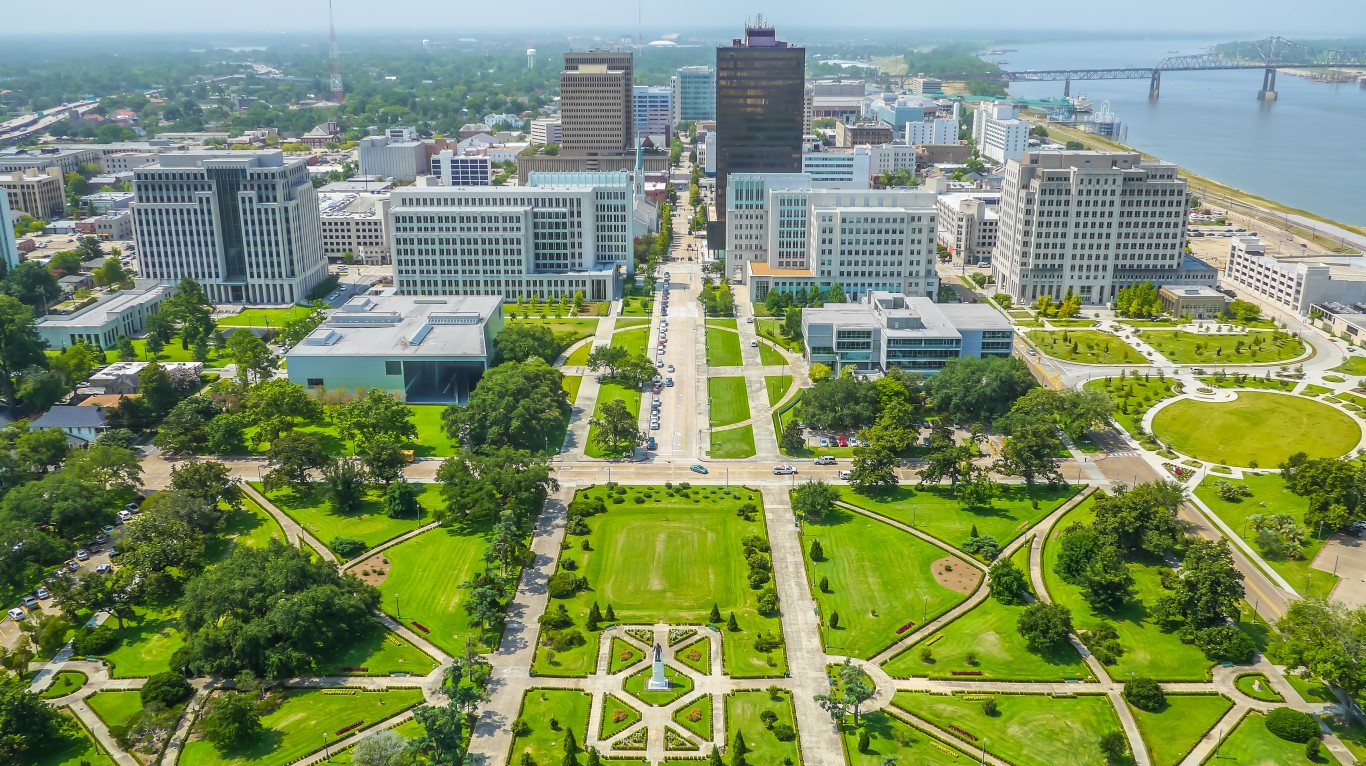
30. Baton Rouge, Louisiana
> High stress score: 54.9
> Households with incomes under $10,000: 9,687, 11.6% — #56 highest out of 182 cities
> Estimated unemployment rate (2015-2019): 8.4% — #21 highest out of 182 cities

31. Norfolk, Virginia
> High stress score: 54.9
> Households with incomes under $10,000: 7,915, 9.0% — #74 highest out of 182 cities
> Estimated unemployment rate (2015-2019): 7.6% — #33 highest out of 182 cities
[in-text-ad]
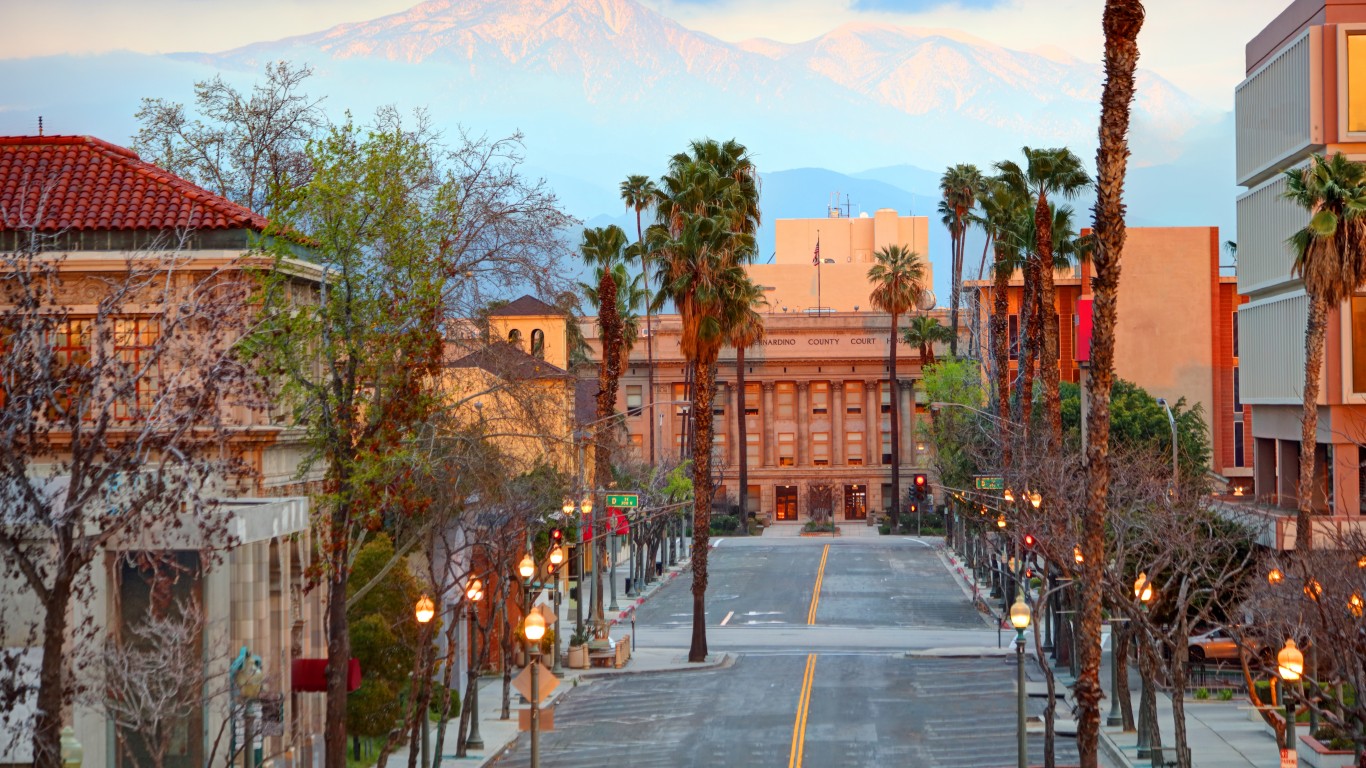
29. San Bernardino, California
> High stress score: 55.1
> Households with incomes under $10,000: 4,293, 7.2% — #122 highest out of 182 cities
> Estimated unemployment rate (2015-2019): 9.2% — #9 highest out of 182 cities
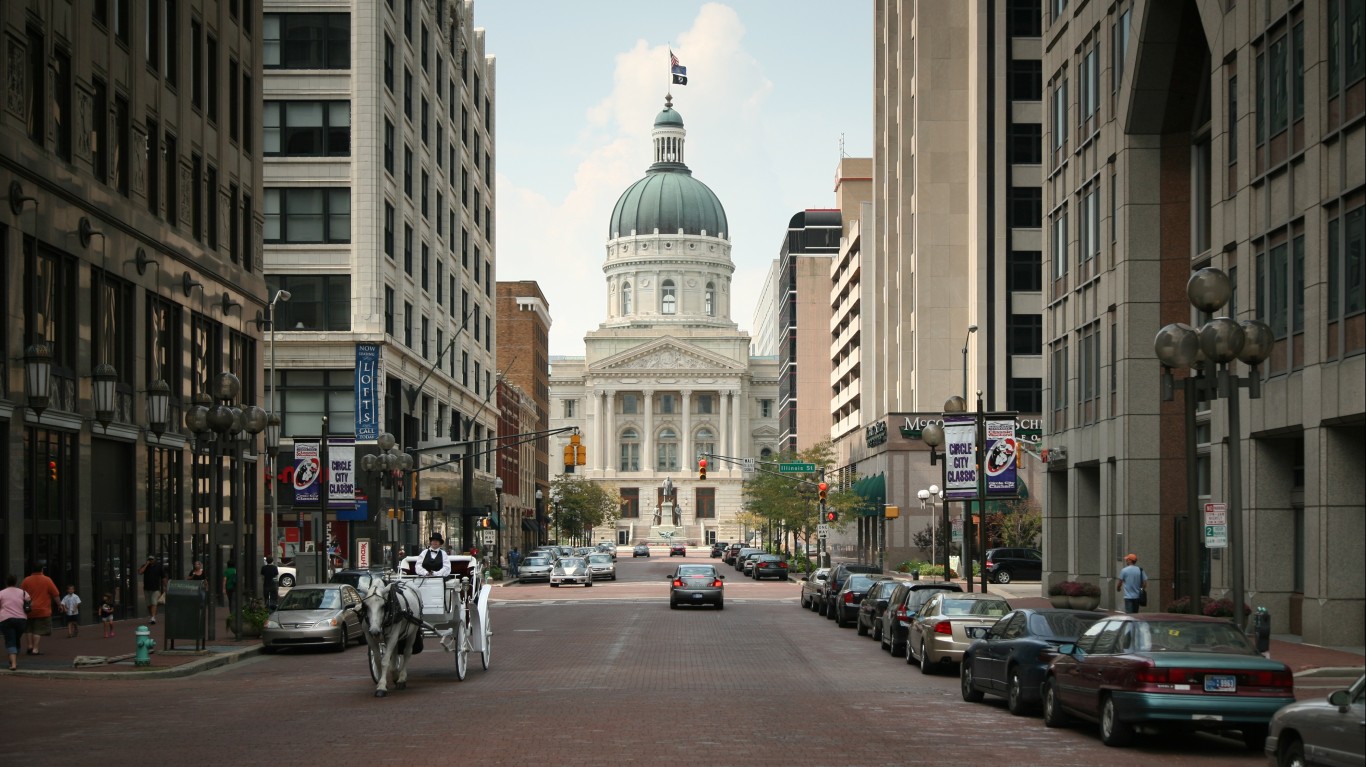
28. Indianapolis, Indiana
> High stress score: 55.1
> Households with incomes under $10,000: 29,237, 8.6% — #11 highest out of 182 cities
> Estimated unemployment rate (2015-2019): 6.4% — #54 highest out of 182 cities

27. Newport News, Virginia
> High stress score: 55.5
> Households with incomes under $10,000: 5,282, 7.6% — #115 highest out of 182 cities
> Estimated unemployment rate (2015-2019): 6.2% — #61 highest out of 182 cities
[in-text-ad-2]

26. New York, New York
> High stress score: 55.7
> Households with incomes under $10,000: 270,622, 8.5% — #1 highest out of 182 cities
> Estimated unemployment rate (2015-2019): 6.3% — #56 highest out of 182 cities
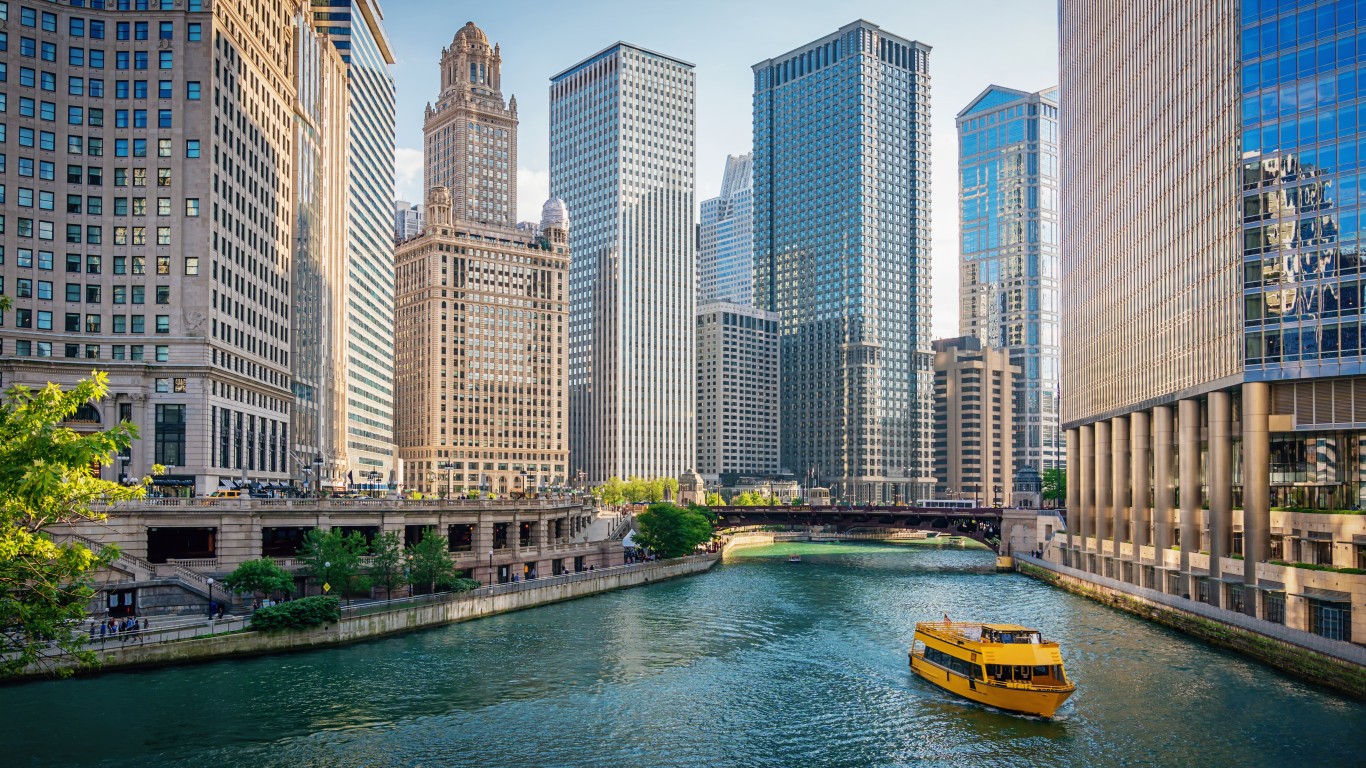
25. Chicago, Illinois
> High stress score: 55.9
> Households with incomes under $10,000: 98,154, 9.2% — #2 highest out of 182 cities
> Estimated unemployment rate (2015-2019): 8.1% — #26 highest out of 182 cities
[in-text-ad]
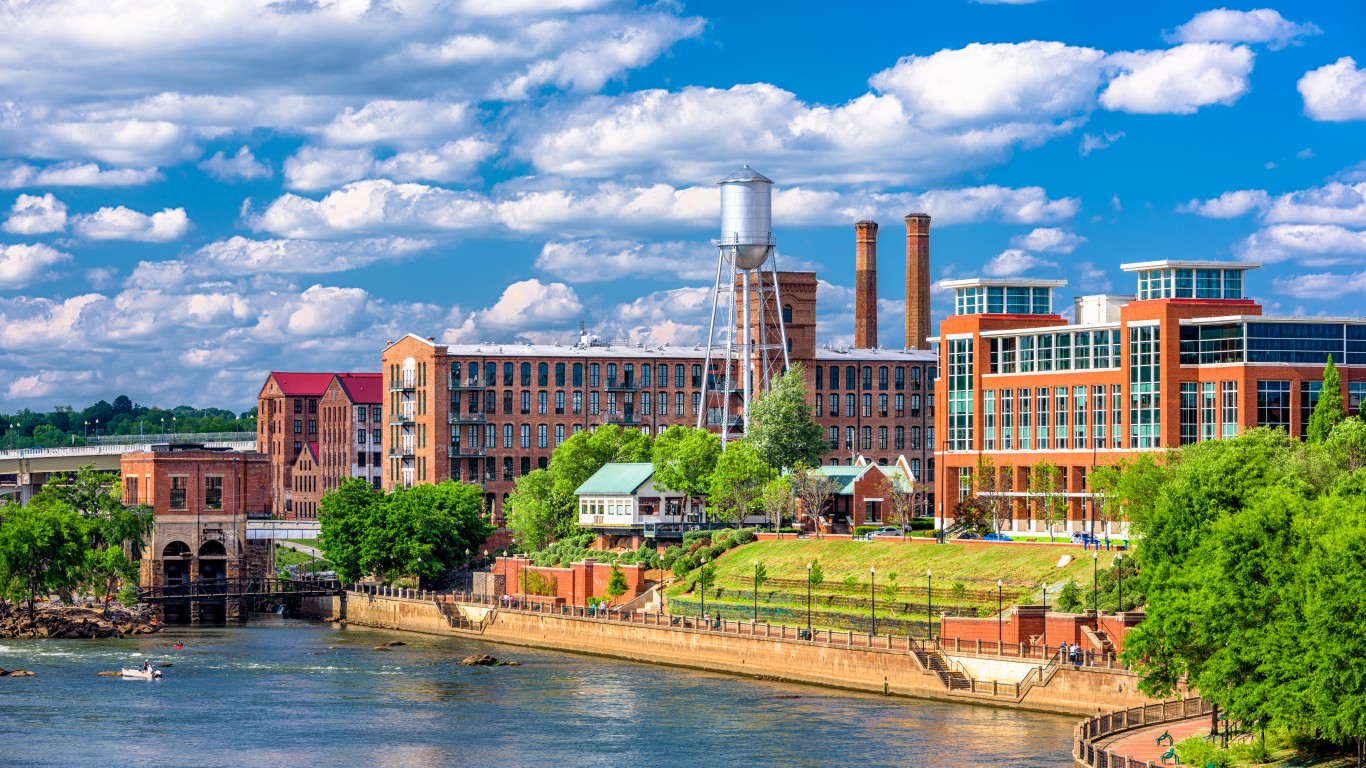
24. Columbus, Georgia
> High stress score: 56.0
> Households with incomes under $10,000: 7,776, 10.7% — #77 highest out of 182 cities
> Estimated unemployment rate (2015-2019): 9.2% — #9 highest out of 182 cities

23. Augusta, Georgia
> High stress score: 56.0
> Households with incomes under $10,000: 7,609, 10.9% — #80 highest out of 182 cities
> Estimated unemployment rate (2015-2019): 9.0% — #14 highest out of 182 cities
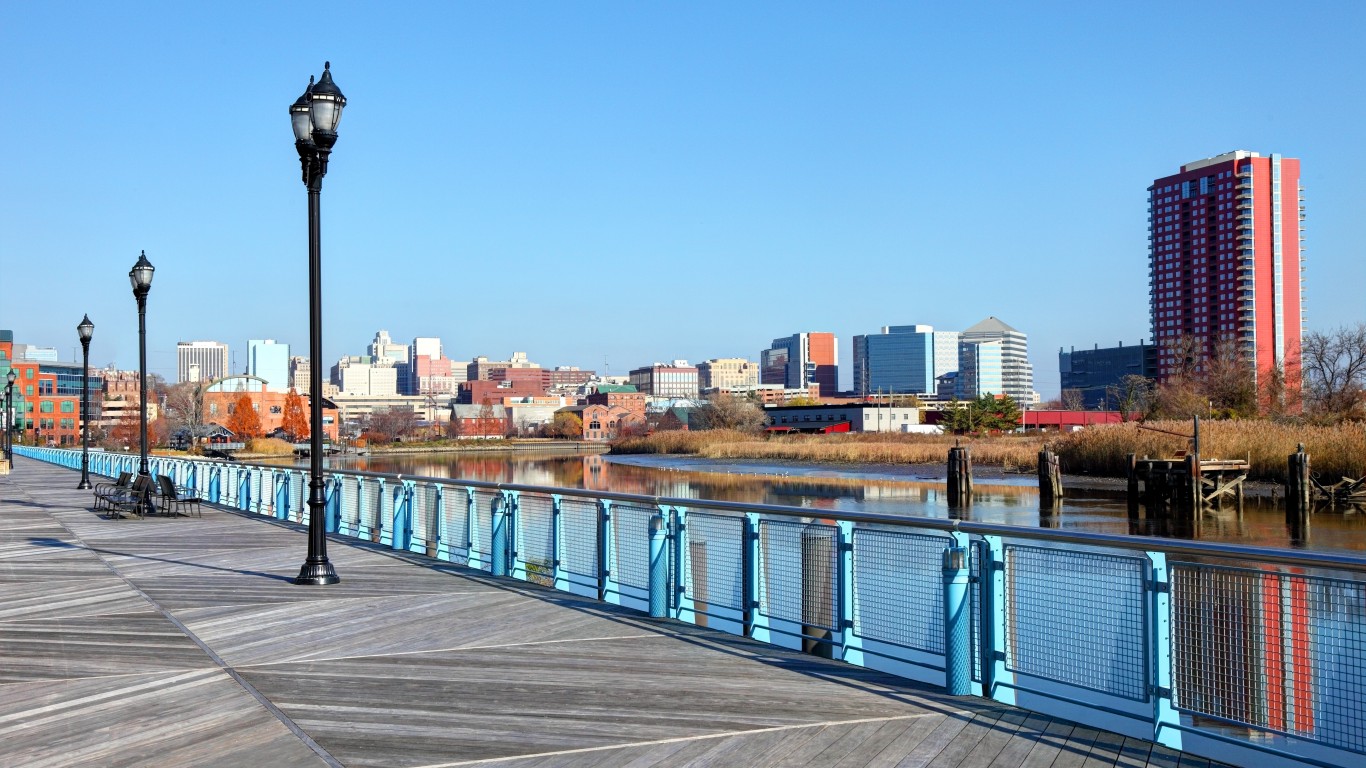
22. Wilmington, Delaware
> High stress score: 56.3
> Households with incomes under $10,000: 3,883, 13.5% — #128 highest out of 182 cities
> Estimated unemployment rate (2015-2019): 8.4% — #21 highest out of 182 cities
[in-text-ad-2]

21. Milwaukee, Wisconsin
> High stress score: 56.5
> Households with incomes under $10,000: 23,080, 10.0% — #19 highest out of 182 cities
> Estimated unemployment rate (2015-2019): 6.8% — #41 highest out of 182 cities
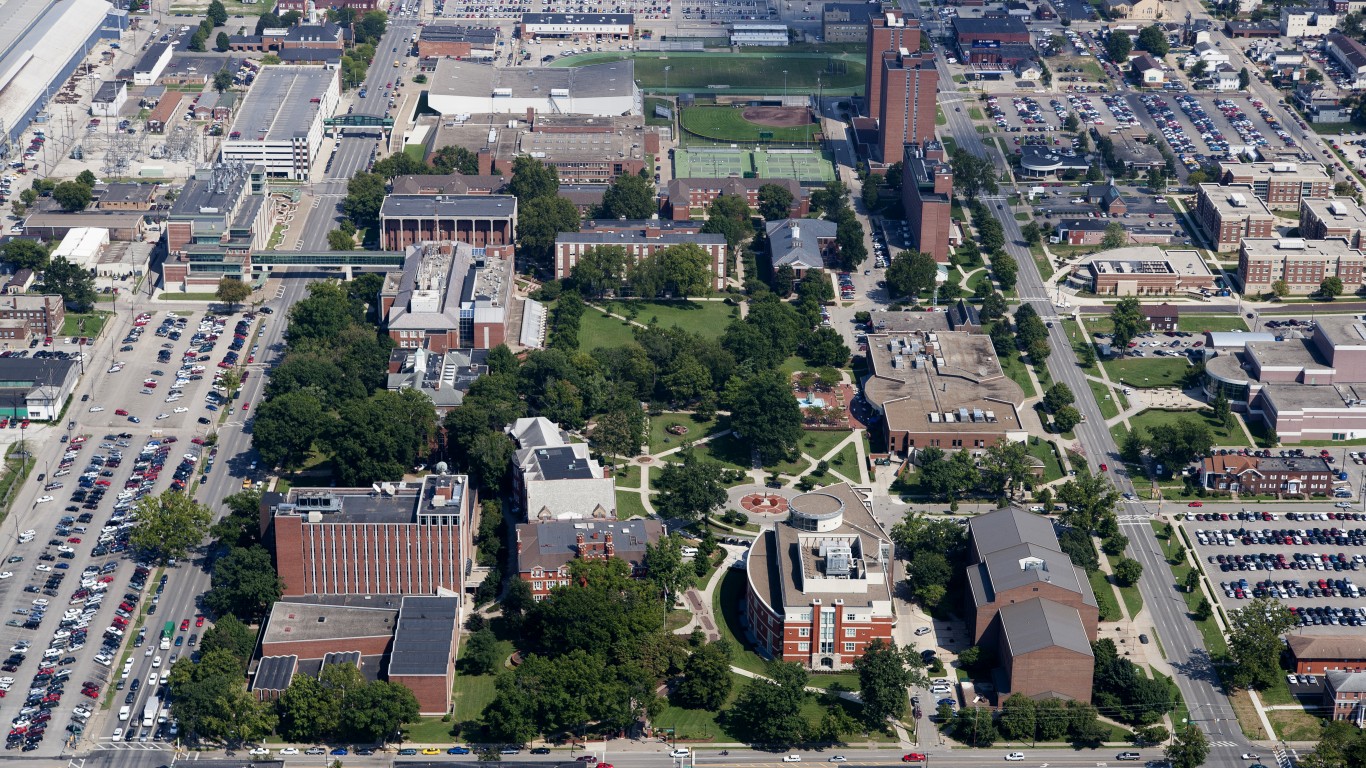
20. Huntington, West Virginia
> High stress score: 56.6
> Households with incomes under $10,000: 3,471, 18.0% — #130 highest out of 182 cities
> Estimated unemployment rate (2015-2019): 6.8% — #41 highest out of 182 cities
[in-text-ad]

19. Cincinnati, Ohio
> High stress score: 57.2
> Households with incomes under $10,000: 18,121, 13.2% — #30 highest out of 182 cities
> Estimated unemployment rate (2015-2019): 8.0% — #28 highest out of 182 cities

18. Philadelphia, Pennsylvania
> High stress score: 57.5
> Households with incomes under $10,000: 76,098, 12.7% — #4 highest out of 182 cities
> Estimated unemployment rate (2015-2019): 9.2% — #9 highest out of 182 cities
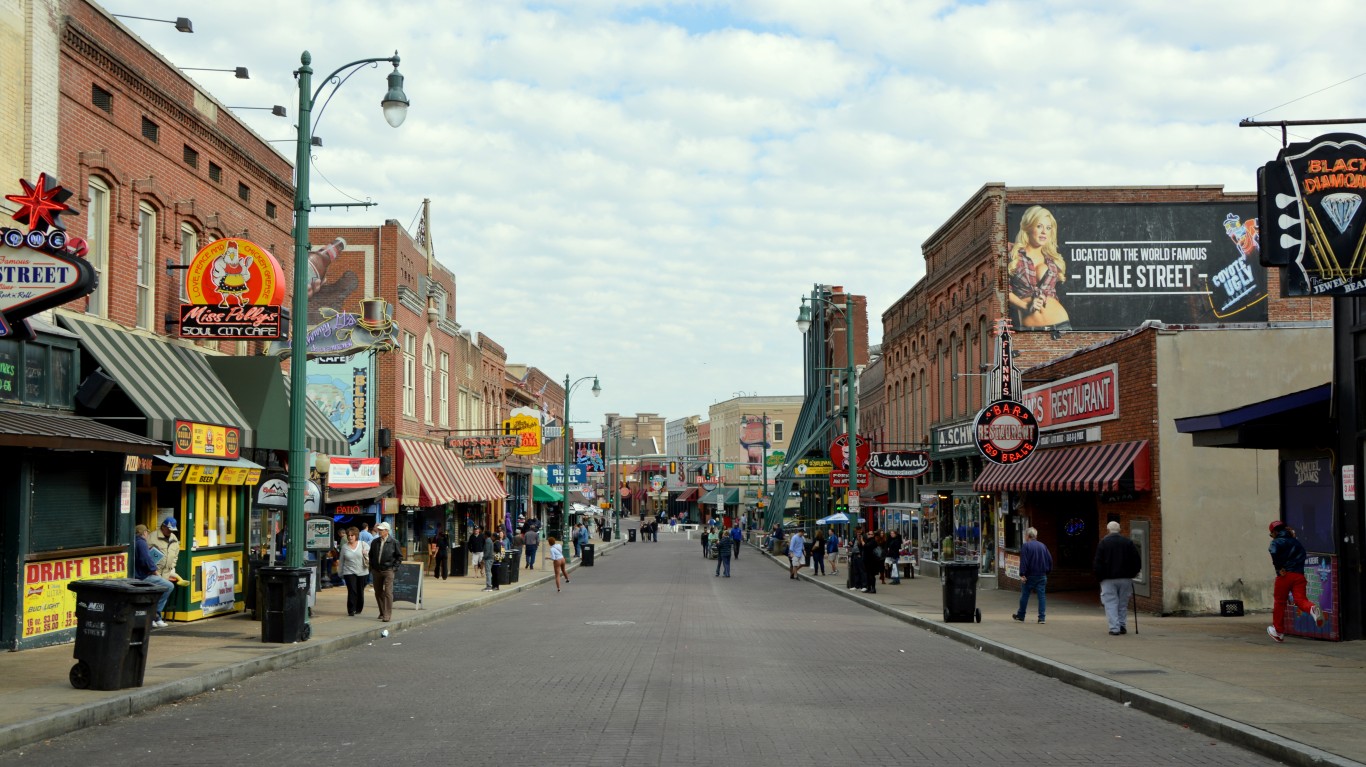
17. Memphis, Tennessee
> High stress score: 58.0
> Households with incomes under $10,000: 27,076, 10.8% — #14 highest out of 182 cities
> Estimated unemployment rate (2015-2019): 8.7% — #20 highest out of 182 cities
[in-text-ad-2]
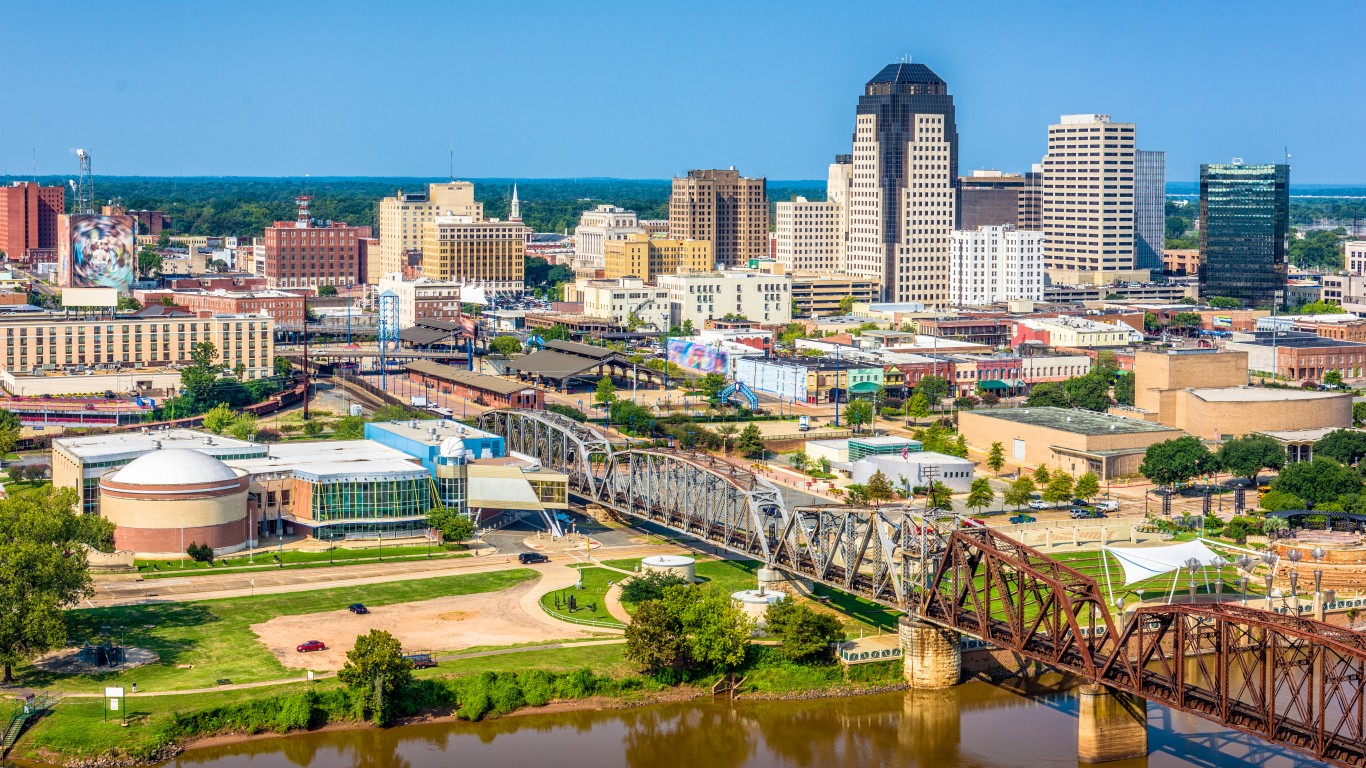
16. Shreveport, Louisiana
> High stress score: 58.1
> Households with incomes under $10,000: 9,174, 12.1% — #60 highest out of 182 cities
> Estimated unemployment rate (2015-2019): 6.8% — #41 highest out of 182 cities
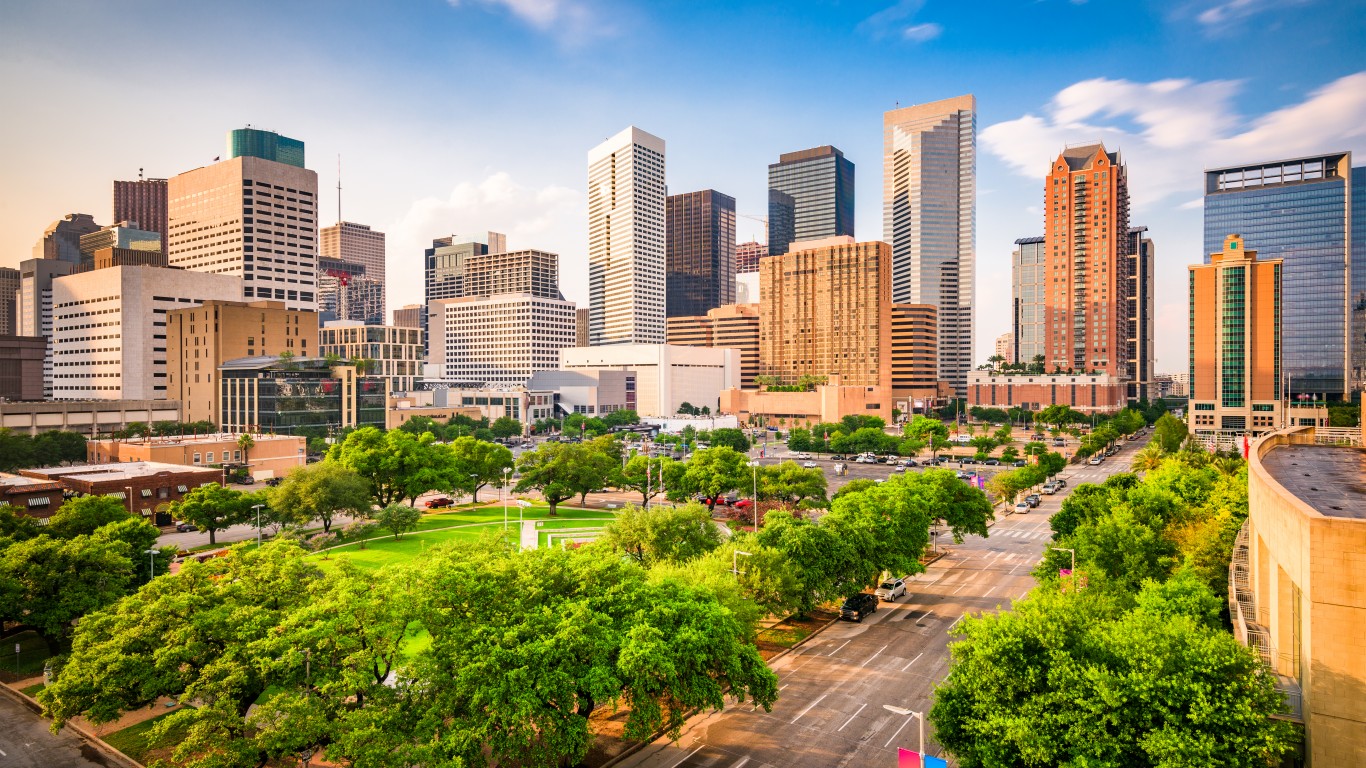
15. Houston, Texas
> High stress score: 58.5
> Households with incomes under $10,000: 66,535, 7.8% — #5 highest out of 182 cities
> Estimated unemployment rate (2015-2019): 5.9% — #75 highest out of 182 cities
[in-text-ad]
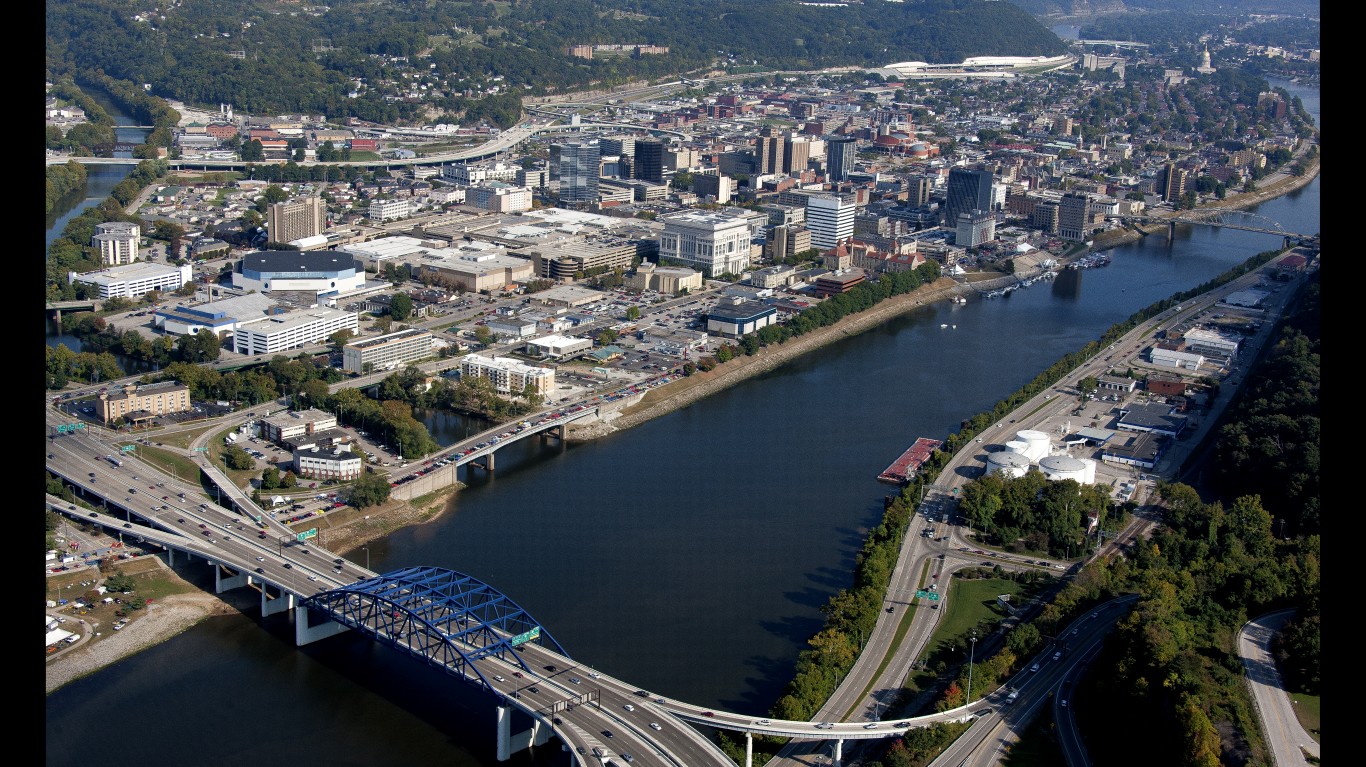
14. Charleston, West Virginia
> High stress score: 58.6
> Households with incomes under $10,000: 2,345, 10.6% — #152 highest out of 182 cities
> Estimated unemployment rate (2015-2019): 5.2% — #106 highest out of 182 cities
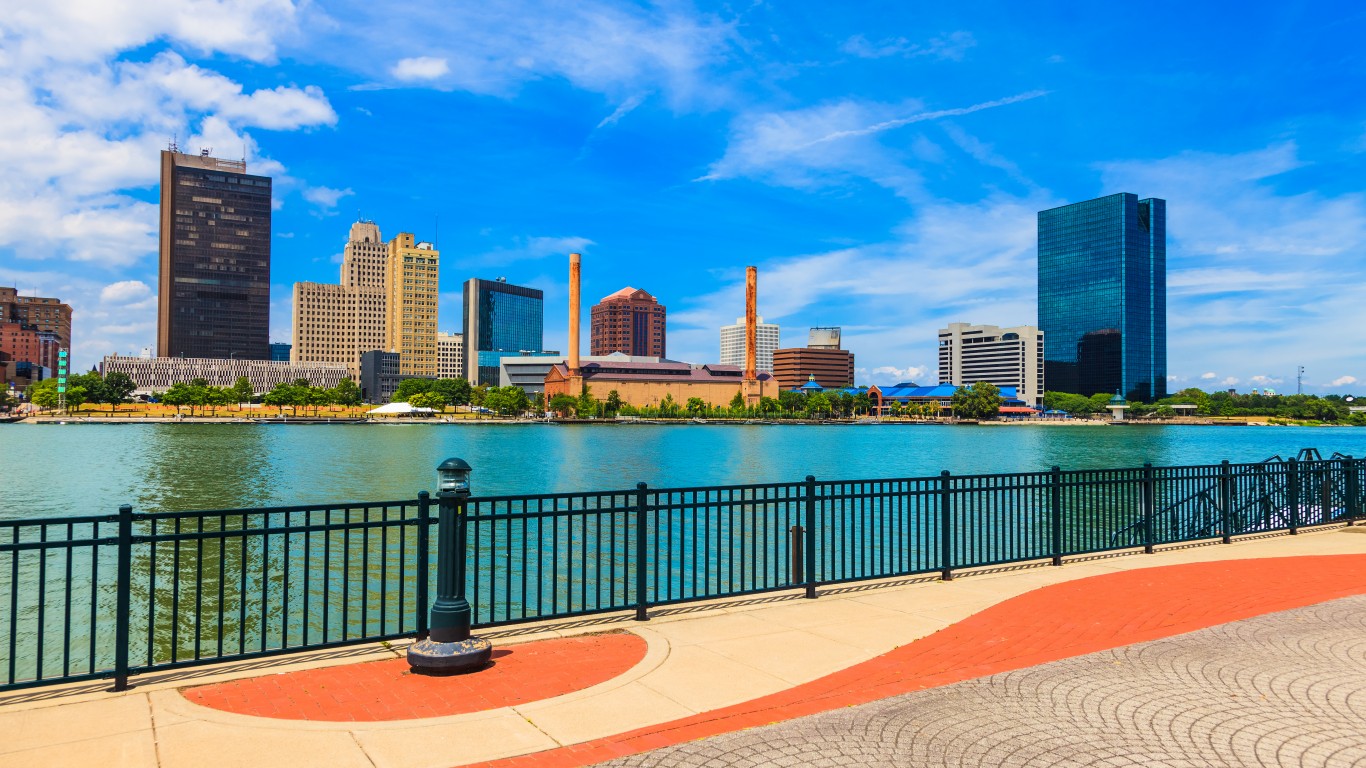
13. Toledo, Ohio
> High stress score: 58.7
> Households with incomes under $10,000: 15,395, 13.0% — #40 highest out of 182 cities
> Estimated unemployment rate (2015-2019): 9.1% — #12 highest out of 182 cities
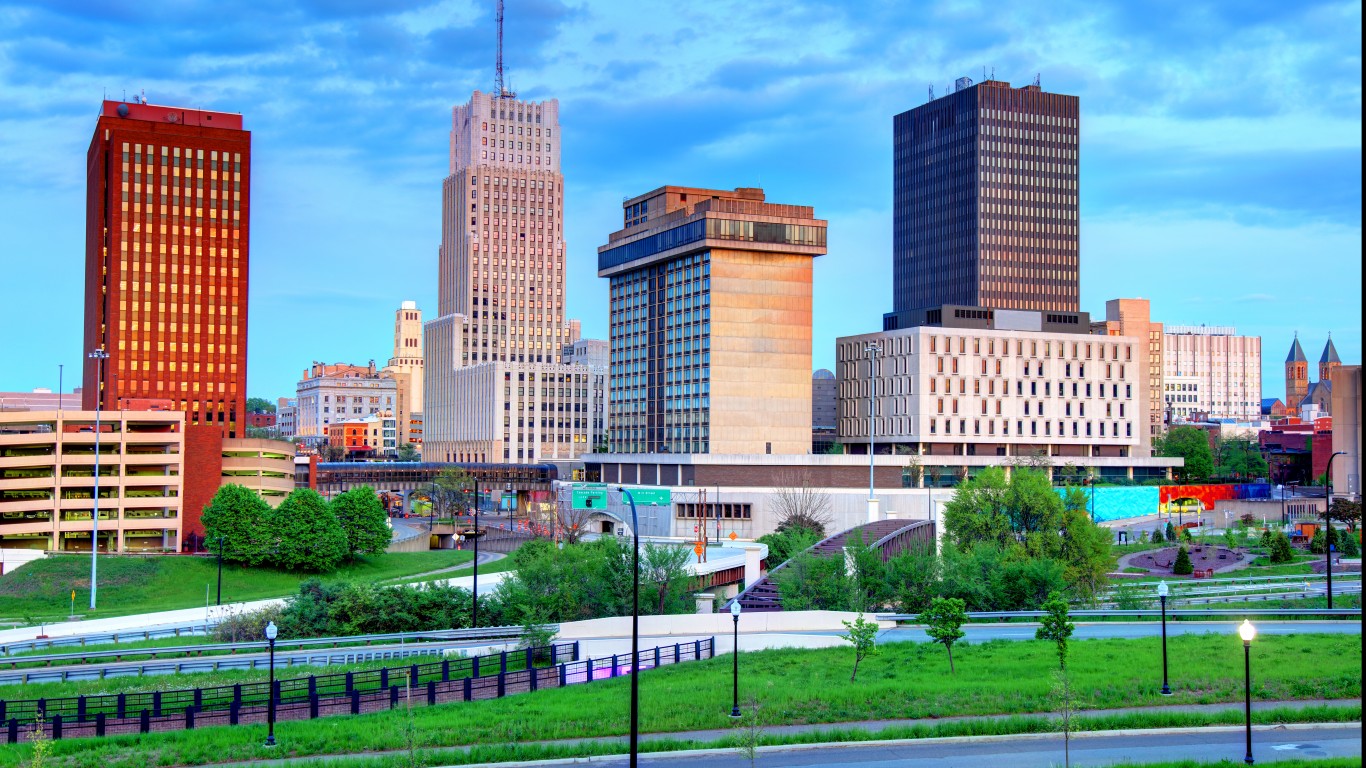
12. Akron, Ohio
> High stress score: 59.2
> Households with incomes under $10,000: 9,133, 10.8% — #61 highest out of 182 cities
> Estimated unemployment rate (2015-2019): 8.1% — #26 highest out of 182 cities
[in-text-ad-2]
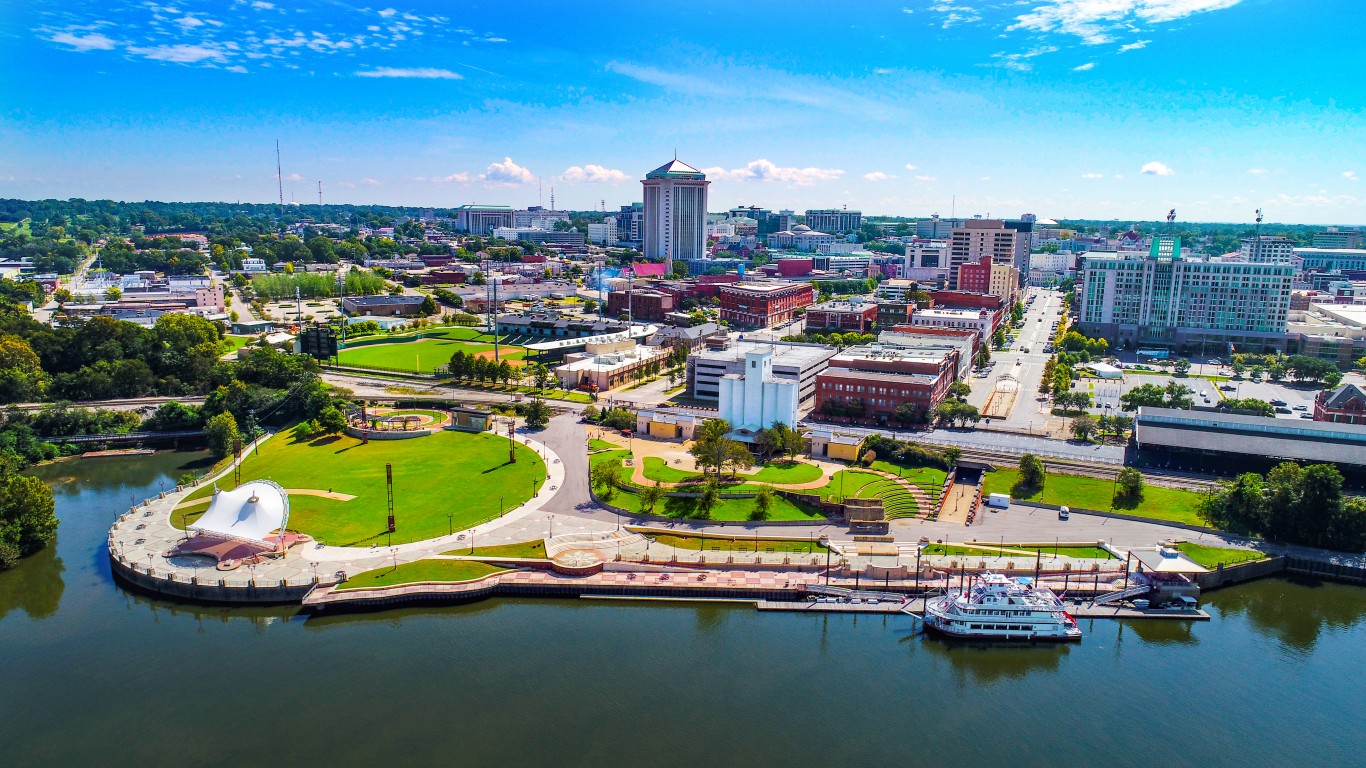
11. Montgomery, Alabama
> High stress score: 59.3
> Households with incomes under $10,000: 7,586, 9.6% — #81 highest out of 182 cities
> Estimated unemployment rate (2015-2019): 6.8% — #41 highest out of 182 cities

10. Jackson, Mississippi
> High stress score: 59.3
> Households with incomes under $10,000: 6,455, 10.4% — #96 highest out of 182 cities
> Estimated unemployment rate (2015-2019): 11.3% — #5 highest out of 182 cities
[in-text-ad]
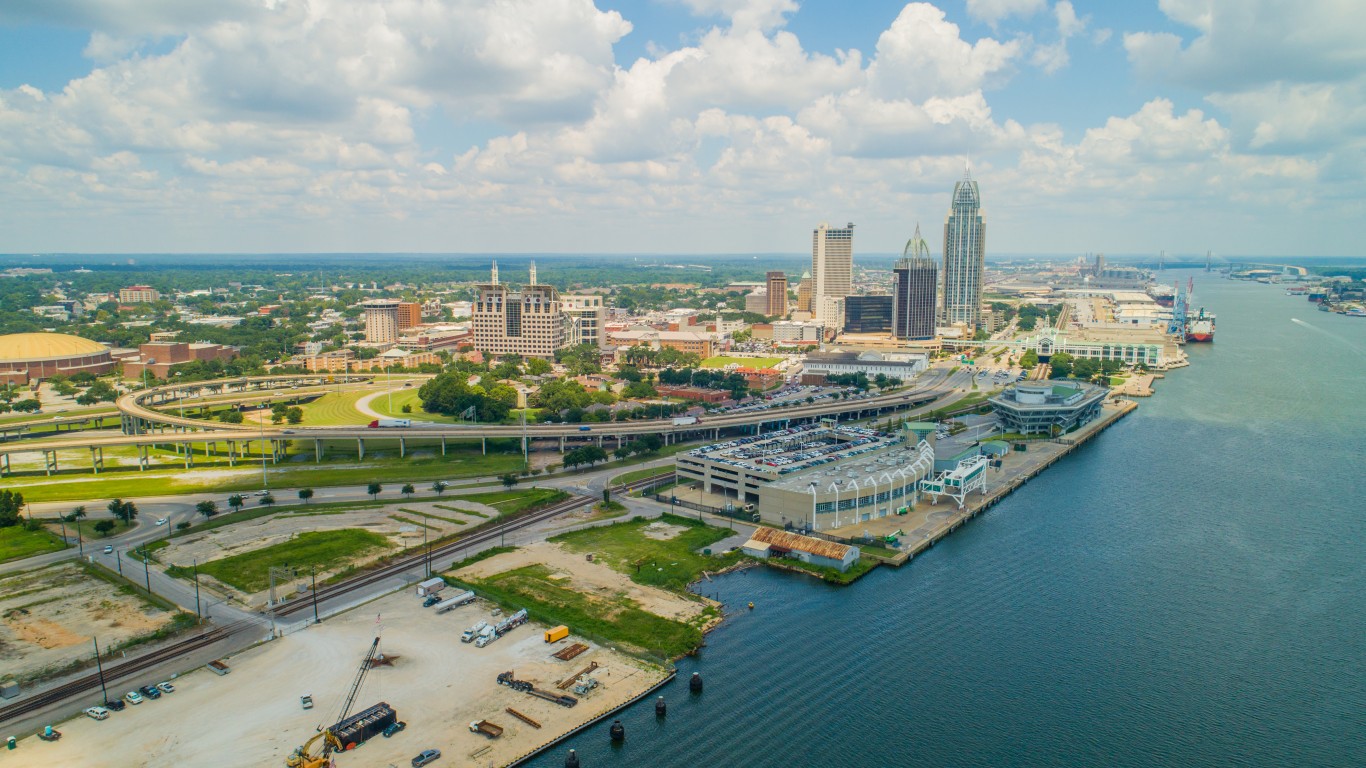
9. Mobile, Alabama
> High stress score: 59.8
> Households with incomes under $10,000: 8,786, 11.2% — #68 highest out of 182 cities
> Estimated unemployment rate (2015-2019): 6.2% — #61 highest out of 182 cities

8. St. Louis, Missouri
> High stress score: 59.8
> Households with incomes under $10,000: 16,386, 11.5% — #36 highest out of 182 cities
> Estimated unemployment rate (2015-2019): 7.0% — #36 highest out of 182 cities
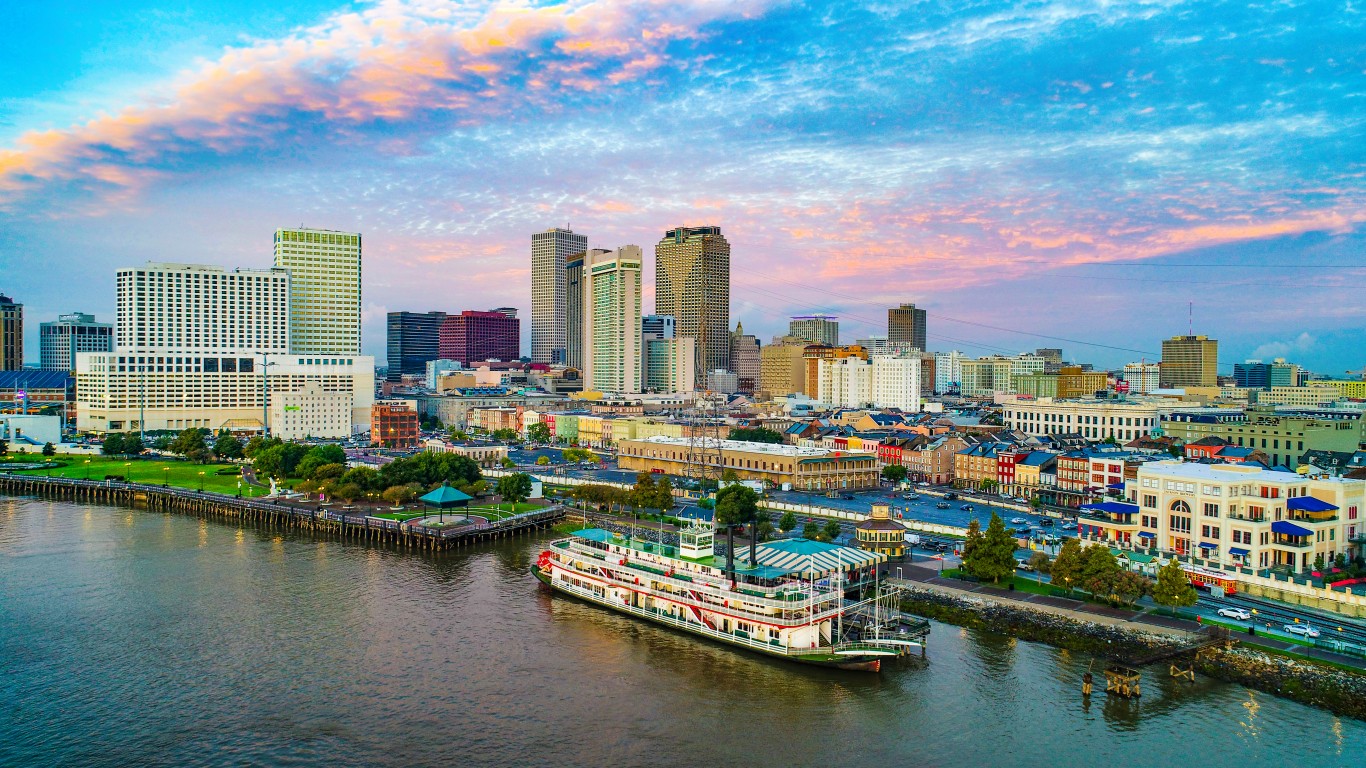
7. New Orleans, Louisiana
> High stress score: 60.4
> Households with incomes under $10,000: 22,130, 14.4% — #21 highest out of 182 cities
> Estimated unemployment rate (2015-2019): 7.9% — #30 highest out of 182 cities
[in-text-ad-2]

6. Baltimore, Maryland
> High stress score: 62.0
> Households with incomes under $10,000: 27,280, 11.4% — #13 highest out of 182 cities
> Estimated unemployment rate (2015-2019): 8.3% — #25 highest out of 182 cities
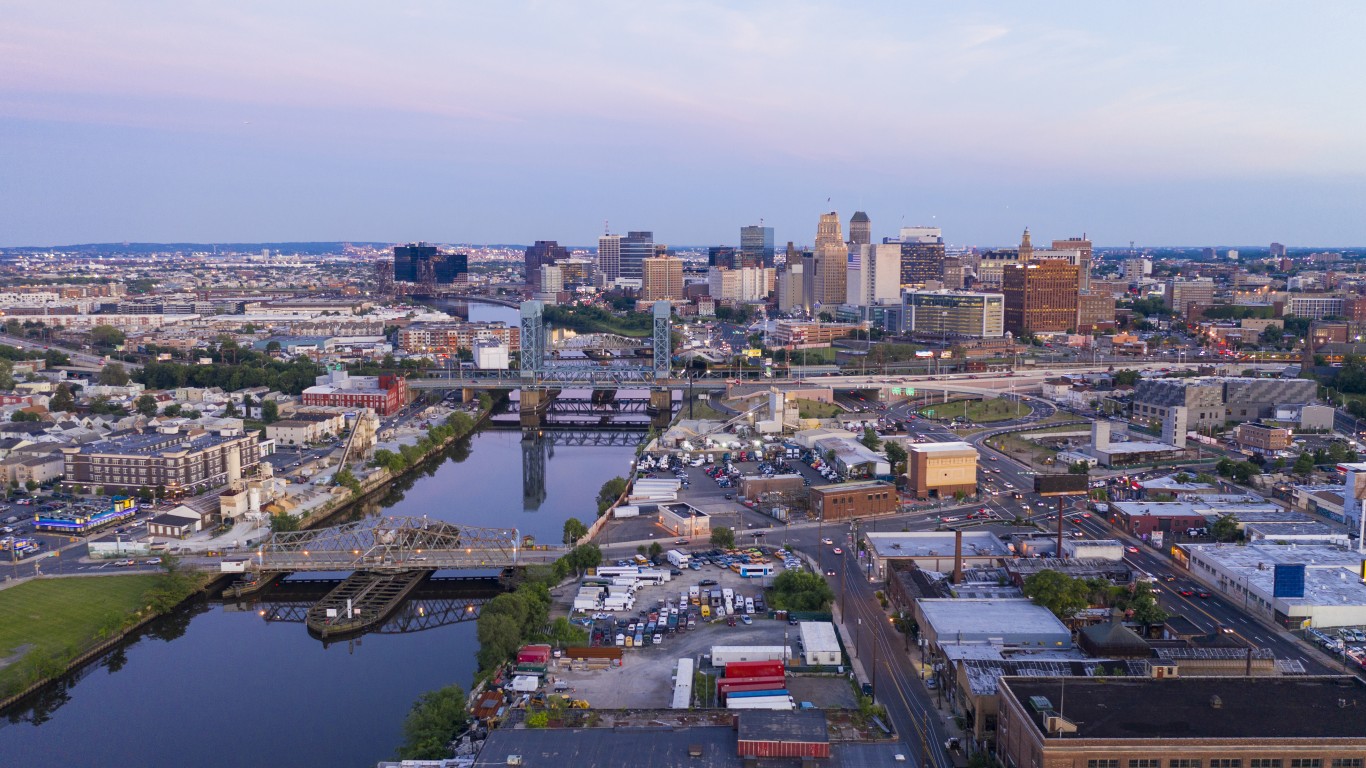
5. Newark, New Jersey
> High stress score: 62.4
> Households with incomes under $10,000: 15,596, 15.6% — #39 highest out of 182 cities
> Estimated unemployment rate (2015-2019): 11.3% — #5 highest out of 182 cities
[in-text-ad]
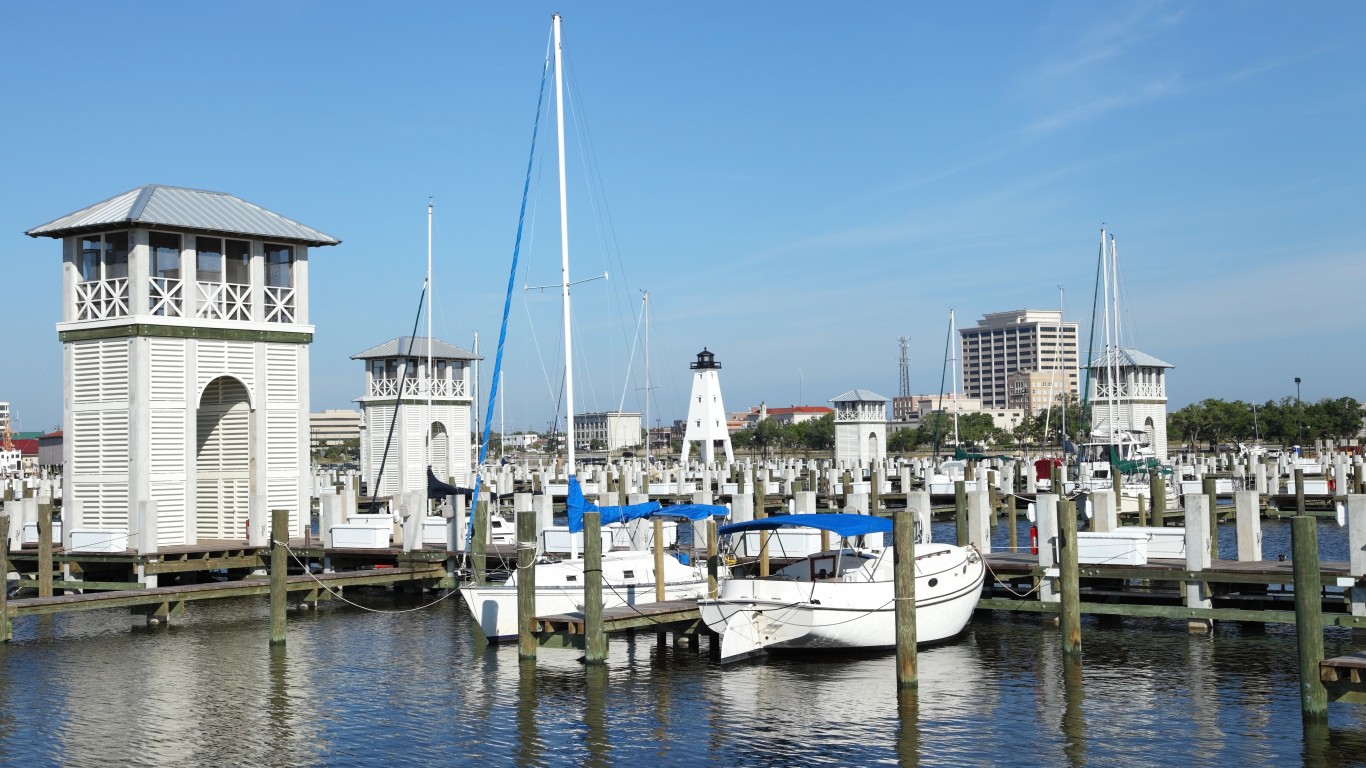
4. Gulfport, Mississippi
> High stress score: 62.4
> Households with incomes under $10,000: 3,390, 12.1% — #134 highest out of 182 cities
> Estimated unemployment rate (2015-2019): 11.6% — #4 highest out of 182 cities
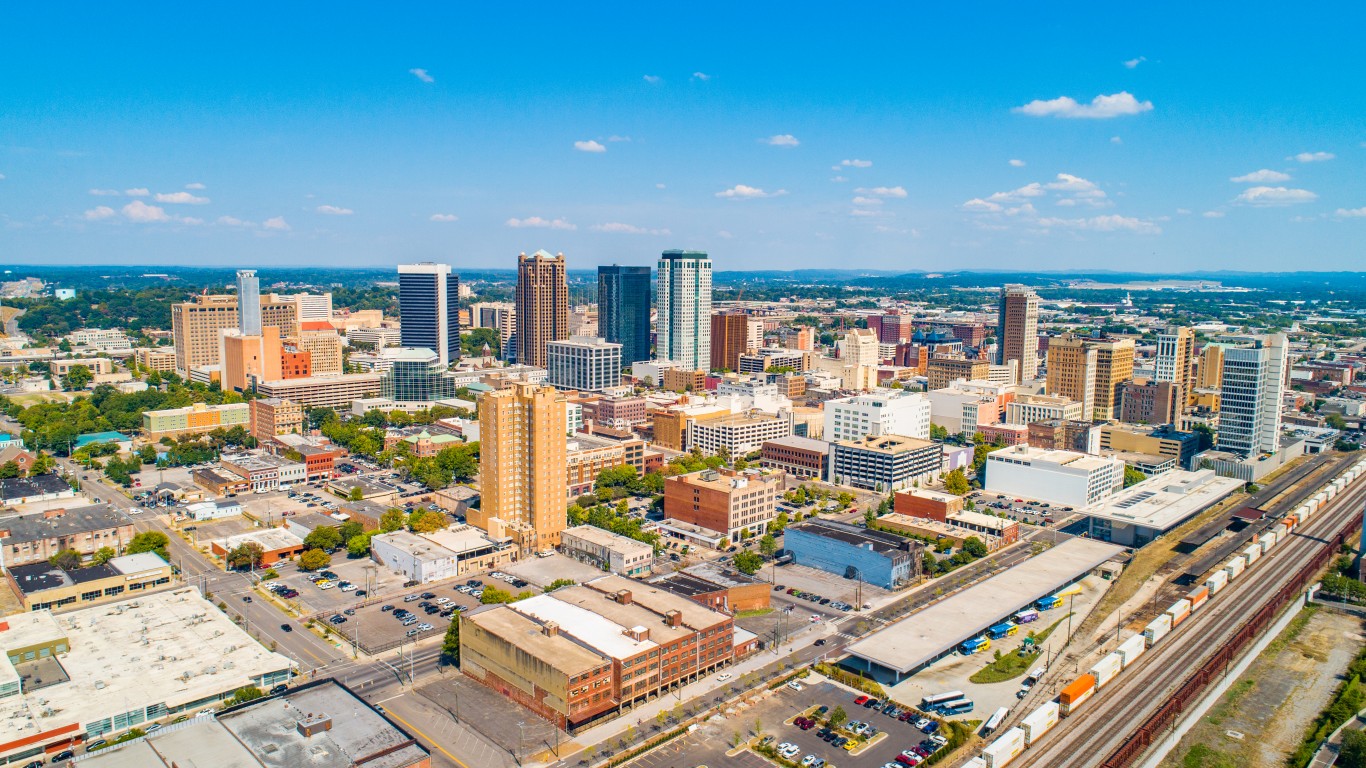
3. Birmingham, Alabama
> High stress score: 62.4
> Households with incomes under $10,000: 12,400, 13.6% — #48 highest out of 182 cities
> Estimated unemployment rate (2015-2019): 9.0% — #14 highest out of 182 cities
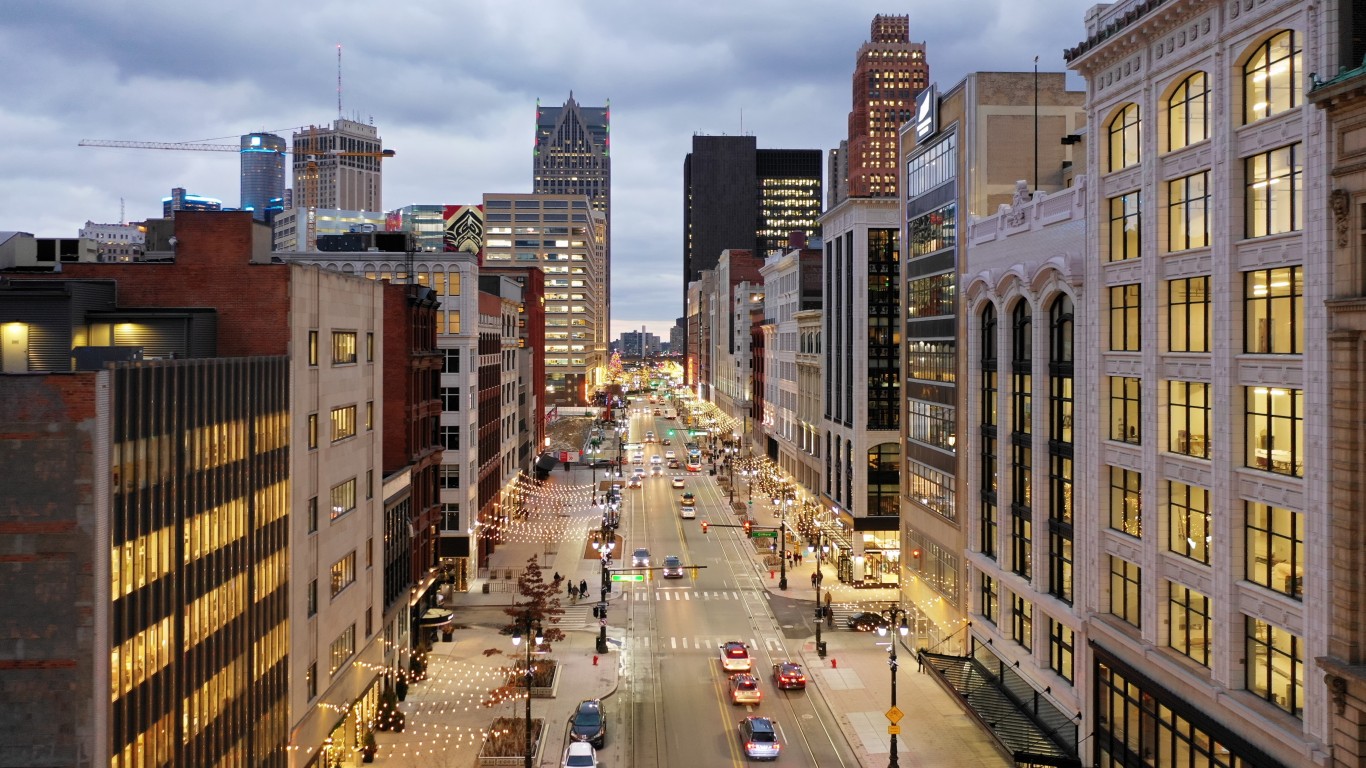
2. Detroit, Michigan
> High stress score: 65.0
> Households with incomes under $10,000: 50,139, 19.0% — #6 highest out of 182 cities
> Estimated unemployment rate (2015-2019): 15.7% — #1 highest out of 182 cities
[in-text-ad-2]
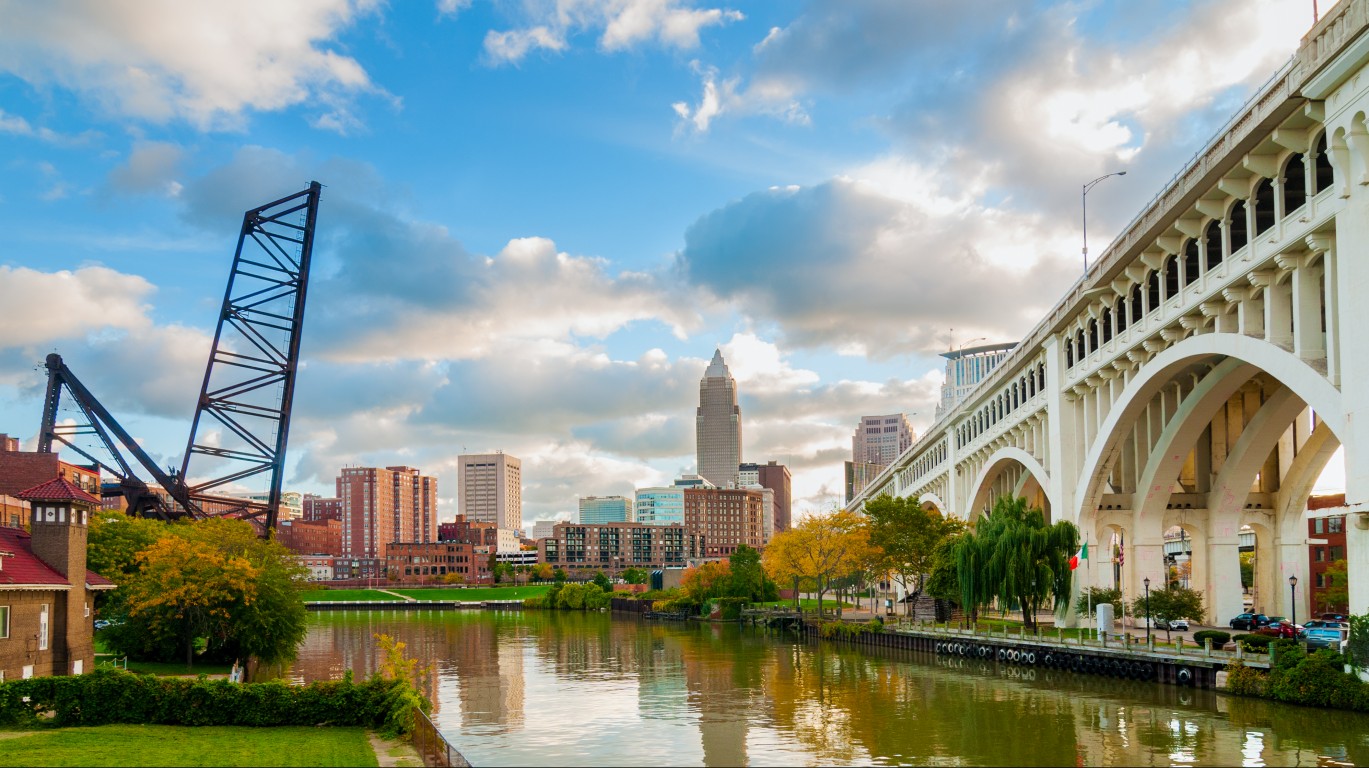
1. Cleveland, Ohio
> High stress score: 66.9
> Households with incomes under $10,000: 29,995, 17.6% — #10 highest out of 182 cities
> Estimated unemployment rate (2015-2019): 13.2% — #2 highest out of 182 cities
Are You Ahead, or Behind on Retirement? (sponsor)
If you’re one of the over 4 Million Americans set to retire this year, you may want to pay attention.
Finding a financial advisor who puts your interest first can be the difference between a rich retirement and barely getting by, and today it’s easier than ever. SmartAsset’s free tool matches you with up to three fiduciary financial advisors that serve your area in minutes. Each advisor has been carefully vetted, and must act in your best interests. Start your search now.
Don’t waste another minute; get started right here and help your retirement dreams become a retirement reality.
Thank you for reading! Have some feedback for us?
Contact the 24/7 Wall St. editorial team.


 24/7 Wall St.
 24/7 Wall St.
 24/7 Wall St.


