The average cost of a college education in the United States is $35,720 a year — three times higher than it was two decades ago. Surging prices have led to unprecedented student debt levels totalling more than $1.7 trillion — and may partially explain why college enrollment rates have fallen by nearly 2% a year since 2010. (This is the most expensive college in every state.)
Nonetheless, while a college education may not be for everyone, it remains a valuable asset that can offer better access to career opportunities, improve job security, and increase earning potential.
Nationwide, an estimated 32.1% of American adults 25 and older have a bachelor’s degree or higher. Educational attainment rates vary considerably across the country, however, and in some cities, the share of adults with a bachelor’s degree is more than double the national average. For example, the average weekly wage for a college educated worker in the United States is about 67% higher than it is for those with no more than a high school diploma. Additionally, college educated Americans are less than half as likely to be unemployed as those who only finished high school.
Using education data from the U.S. Census Bureau, 24/7 Wall St. identified the most educated cities in the United States. In each of the cities on this list, over 70% of the adult population have at least a bachelor’s degree. (Here’s a list of how many people have had a college degree every year since 1971.)
Several of the cities on this list, including State College, Pennsylvania; Chapel Hill, North Carolina; and Ann Arbor, Michigan, are home to major research universities. These areas have large graduate school populations and often a concentration of employers that fill high-skill jobs with university graduates. In all but four cities on this list, the typical household earns more than the national median household income of $62,843, and nearly every city has a lower five-year average unemployment rate than the comparable 5.3% national figure.
Click here to see the most educated cities in the nation.
Click here to see our methodology.
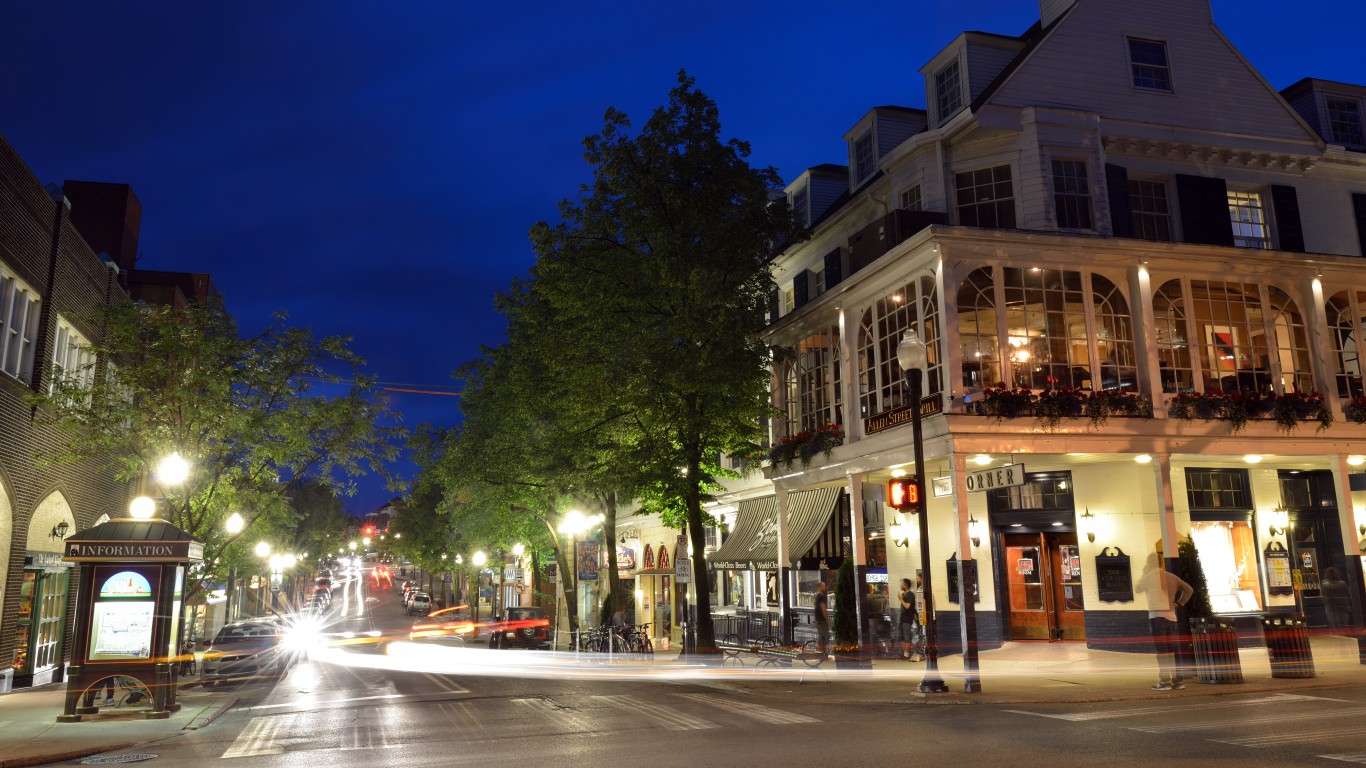
50. State College, Pennsylvania
> Adults with at least a bachelor’s degree: 70.6%
> Median household income: $34,005 — 1,732nd highest of 1,771 cities
> Estimated unemployment rate 2015-2019, all workers: 3.1% — 1,101st lowest of 1,771 cities (tied)
> Estimated unemployment rate 2015-2019, adults with at least a bachelor’s degree: 1.9% — 442nd lowest of 1,771 cities (tied)
[in-text-ad]

49. San Ramon, California
> Adults with at least a bachelor’s degree: 70.6%
> Median household income: $160,783 — 25th highest of 1,771 cities
> Estimated unemployment rate 2015-2019, all workers: 2.7% — 203rd lowest of 1,771 cities (tied)
> Estimated unemployment rate 2015-2019, adults with at least a bachelor’s degree: 2.3% — 680th lowest of 1,771 cities (tied)
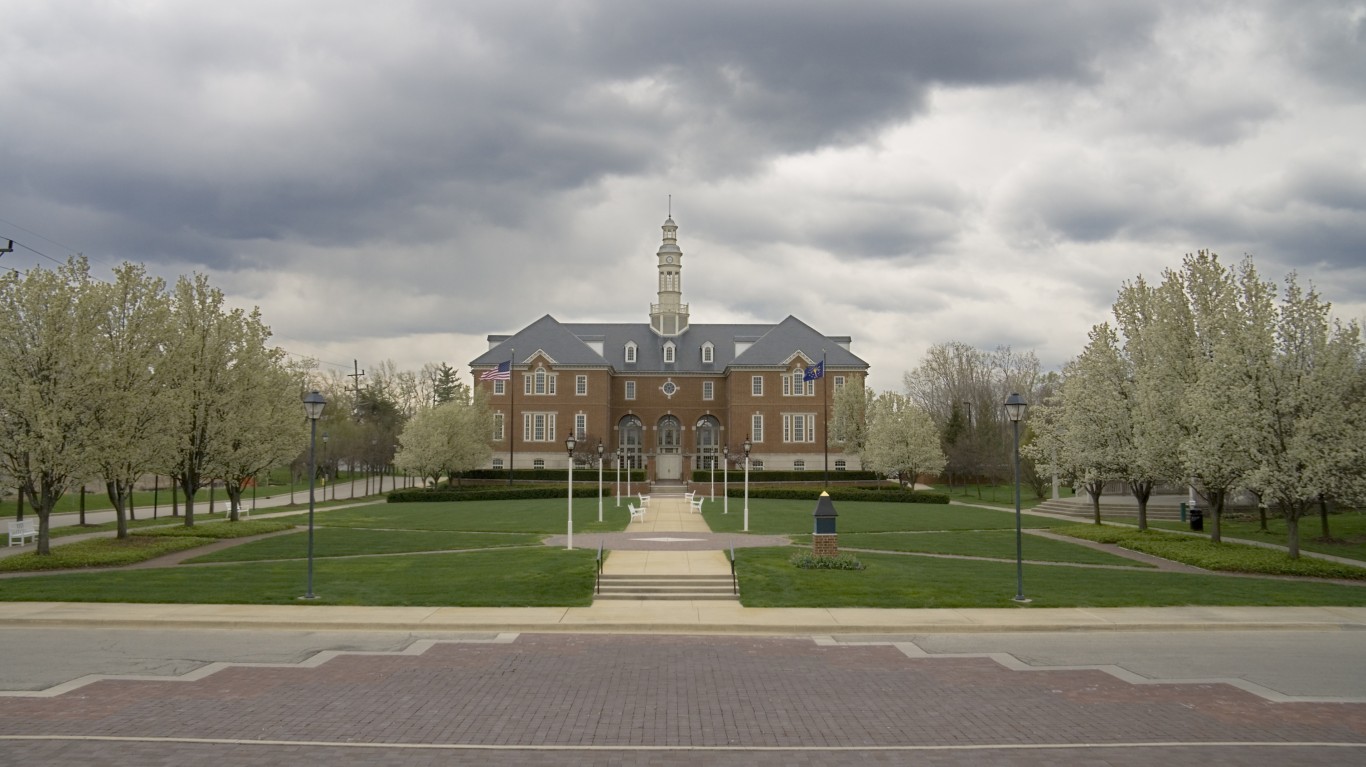
48. Carmel, Indiana
> Adults with at least a bachelor’s degree: 70.6%
> Median household income: $112,765 — 137th highest of 1,771 cities
> Estimated unemployment rate 2015-2019, all workers: 2.2% — 52nd lowest of 1,771 cities (tied)
> Estimated unemployment rate 2015-2019, adults with at least a bachelor’s degree: 1.7% — 342nd lowest of 1,771 cities (tied)
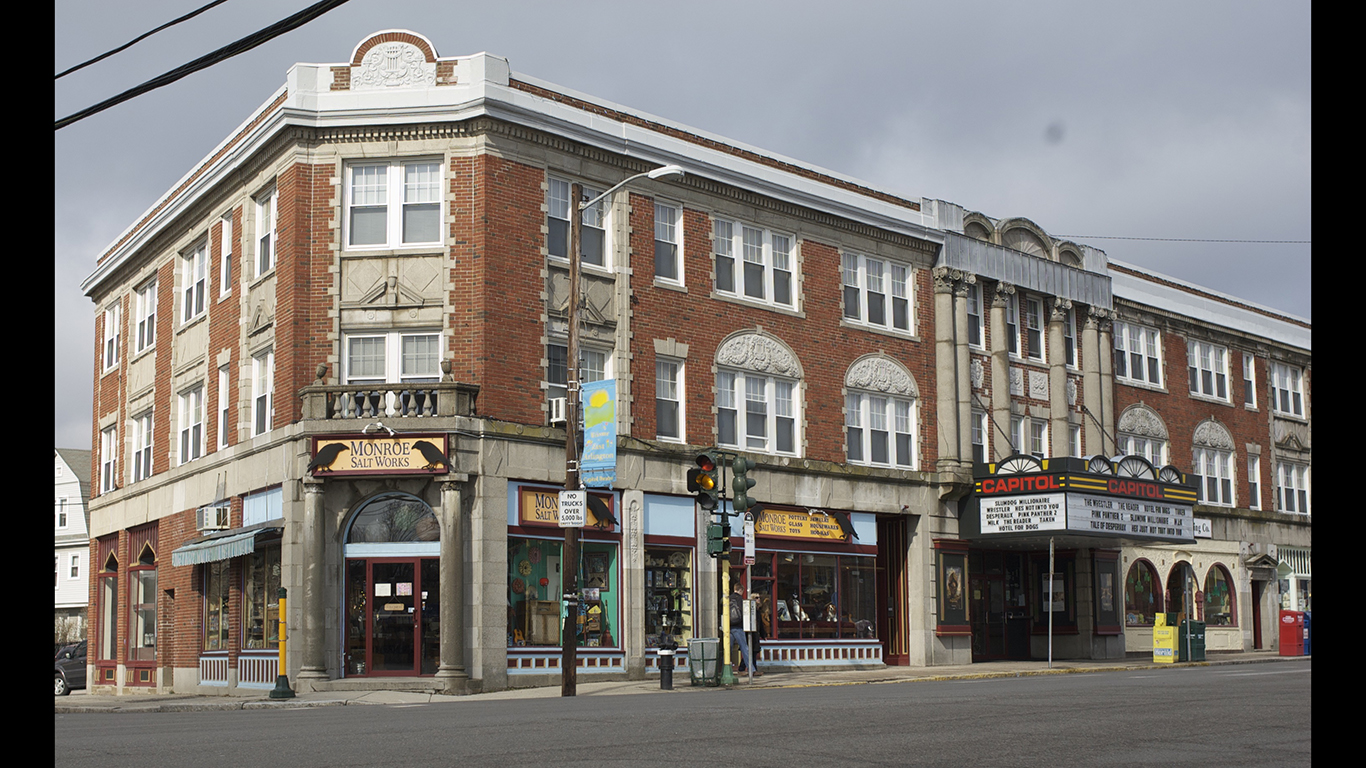
47. Arlington, Massachusetts
> Adults with at least a bachelor’s degree: 70.9%
> Median household income: $108,389 — 178th highest of 1,771 cities
> Estimated unemployment rate 2015-2019, all workers: 2.8% — 237th lowest of 1,771 cities (tied)
> Estimated unemployment rate 2015-2019, adults with at least a bachelor’s degree: 2.0% — 498th lowest of 1,771 cities (tied)
[in-text-ad-2]
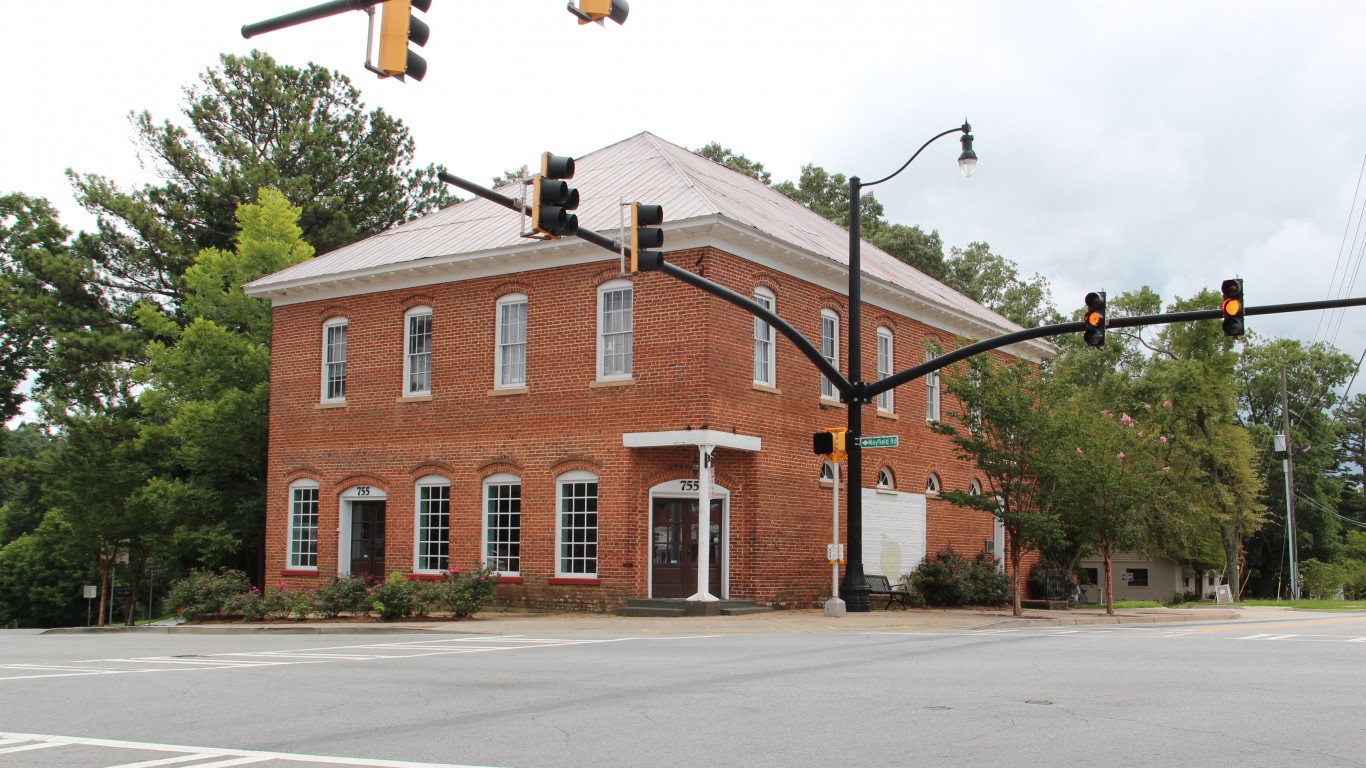
46. Milton, Georgia
> Adults with at least a bachelor’s degree: 70.9%
> Median household income: $128,559 — 71st highest of 1,771 cities
> Estimated unemployment rate 2015-2019, all workers: 3.4% — 269th lowest of 1,771 cities (tied)
> Estimated unemployment rate 2015-2019, adults with at least a bachelor’s degree: 2.8% — 1,016th lowest of 1,771 cities (tied)

45. North Bethesda, Maryland
> Adults with at least a bachelor’s degree: 70.9%
> Median household income: $107,220 — 190th highest of 1,771 cities
> Estimated unemployment rate 2015-2019, all workers: 3.0% — 203rd lowest of 1,771 cities (tied)
> Estimated unemployment rate 2015-2019, adults with at least a bachelor’s degree: 3.3% — 1,277th lowest of 1,771 cities (tied)
[in-text-ad]

44. Lake Oswego, Oregon
> Adults with at least a bachelor’s degree: 71.4%
> Median household income: $108,927 — 171st highest of 1,771 cities
> Estimated unemployment rate 2015-2019, all workers: 2.8% — 471st lowest of 1,771 cities (tied)
> Estimated unemployment rate 2015-2019, adults with at least a bachelor’s degree: 2.3% — 680th lowest of 1,771 cities (tied)

43. Oakton, Virginia
> Adults with at least a bachelor’s degree: 71.4%
> Median household income: $132,256 — 65th highest of 1,771 cities
> Estimated unemployment rate 2015-2019, all workers: 2.7% — 308th lowest of 1,771 cities (tied)
> Estimated unemployment rate 2015-2019, adults with at least a bachelor’s degree: 2.3% — 680th lowest of 1,771 cities (tied)
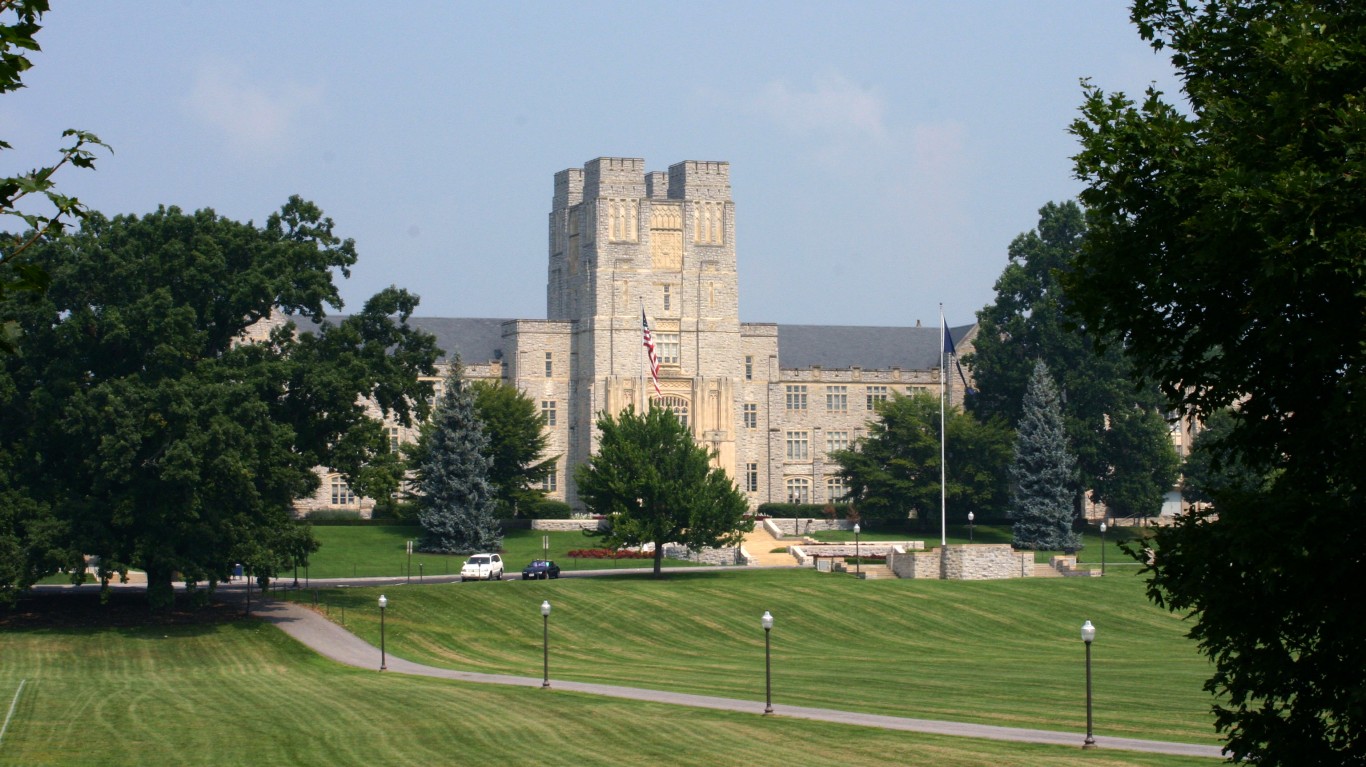
42. Blacksburg, Virginia
> Adults with at least a bachelor’s degree: 71.4%
> Median household income: $43,173 — 1,562nd highest of 1,771 cities
> Estimated unemployment rate 2015-2019, all workers: 4.2% — 913th lowest of 1,771 cities (tied)
> Estimated unemployment rate 2015-2019, adults with at least a bachelor’s degree: 1.0% — 87th lowest of 1,771 cities (tied)
[in-text-ad-2]
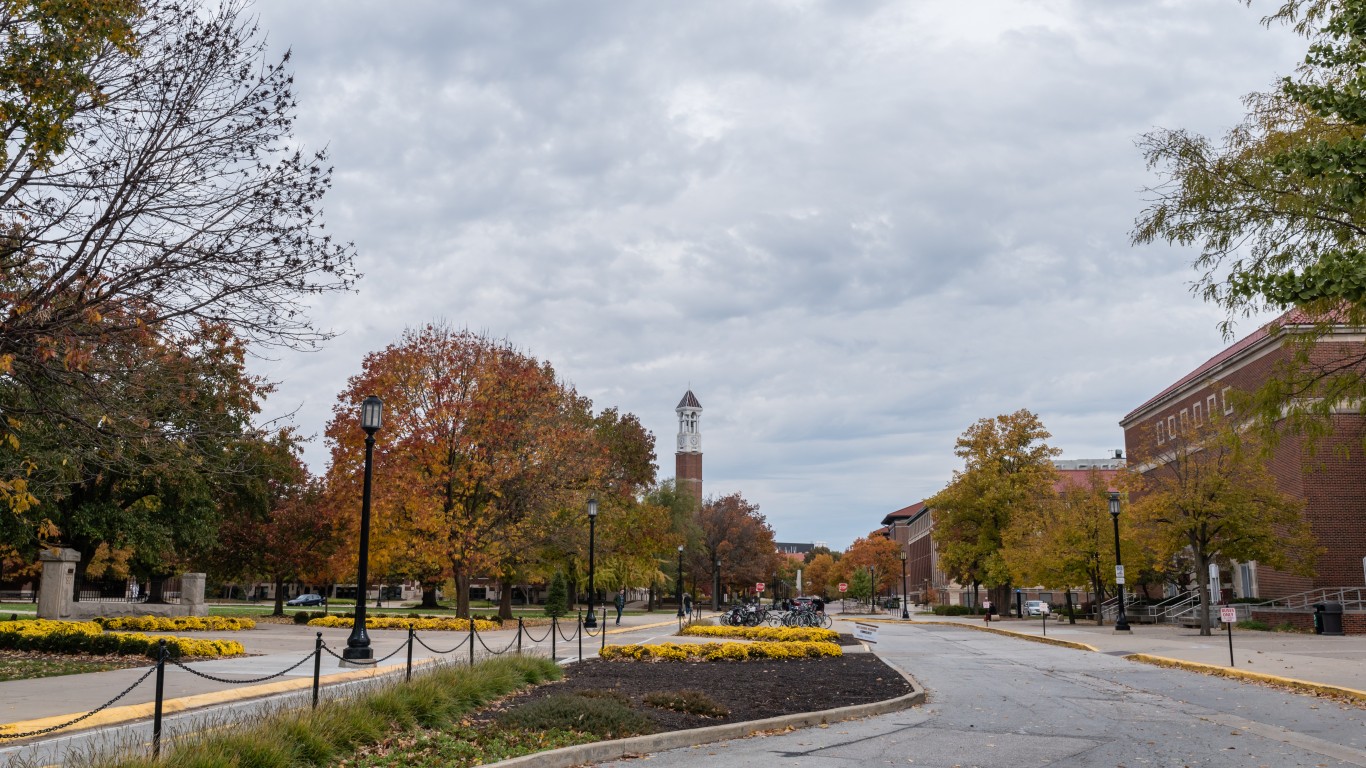
41. West Lafayette, Indiana
> Adults with at least a bachelor’s degree: 71.5%
> Median household income: $34,650 — 1,727th highest of 1,771 cities
> Estimated unemployment rate 2015-2019, all workers: 2.4% — 434th lowest of 1,771 cities (tied)
> Estimated unemployment rate 2015-2019, adults with at least a bachelor’s degree: 1.3% — 167th lowest of 1,771 cities (tied)

40. Lafayette, California
> Adults with at least a bachelor’s degree: 71.6%
> Median household income: $178,889 — 12th highest of 1,771 cities
> Estimated unemployment rate 2015-2019, all workers: 3.7% — 714th lowest of 1,771 cities (tied)
> Estimated unemployment rate 2015-2019, adults with at least a bachelor’s degree: 3.1% — 1,186th lowest of 1,771 cities (tied)
[in-text-ad]

39. Redmond, Washington
> Adults with at least a bachelor’s degree: 71.8%
> Median household income: $132,188 — 66th highest of 1,771 cities
> Estimated unemployment rate 2015-2019, all workers: 3.3% — 308th lowest of 1,771 cities (tied)
> Estimated unemployment rate 2015-2019, adults with at least a bachelor’s degree: 2.5% — 837th lowest of 1,771 cities (tied)
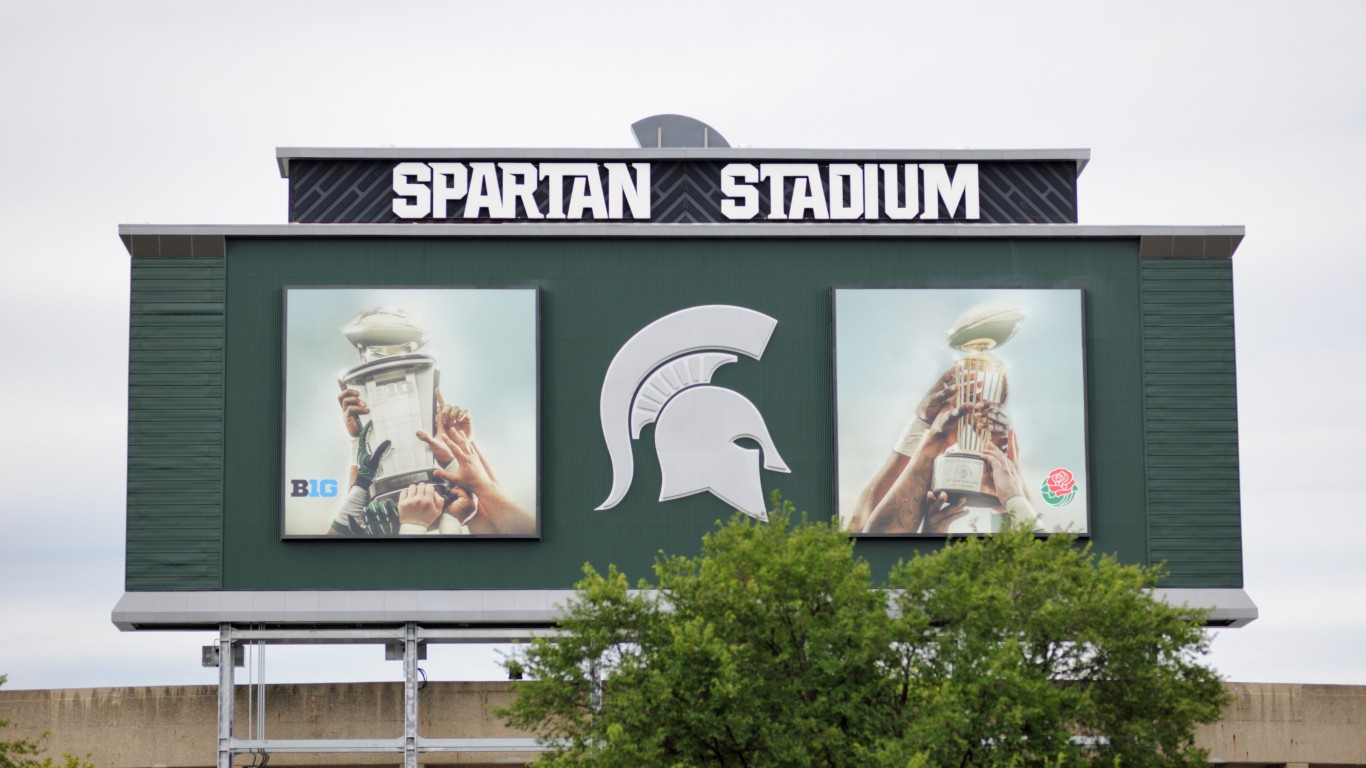
38. East Lansing, Michigan
> Adults with at least a bachelor’s degree: 72.0%
> Median household income: $39,867 — 1,646th highest of 1,771 cities
> Estimated unemployment rate 2015-2019, all workers: 3.9% — 1,623rd lowest of 1,771 cities (tied)
> Estimated unemployment rate 2015-2019, adults with at least a bachelor’s degree: 2.6% — 903rd lowest of 1,771 cities (tied)
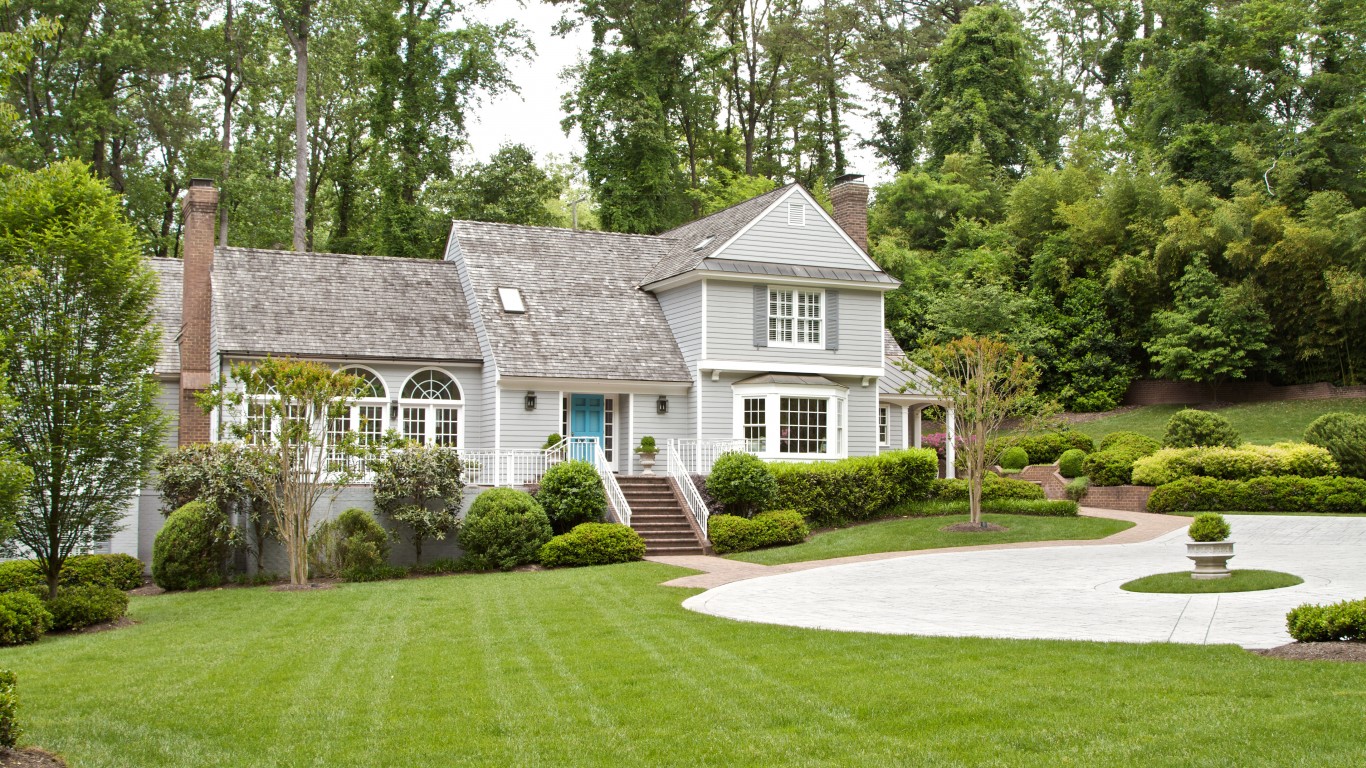
37. Short Pump, Virginia
> Adults with at least a bachelor’s degree: 72.2%
> Median household income: $107,321 — 189th highest of 1,771 cities
> Estimated unemployment rate 2015-2019, all workers: 2.0% — 31st lowest of 1,771 cities (tied)
> Estimated unemployment rate 2015-2019, adults with at least a bachelor’s degree: 1.2% — 136th lowest of 1,771 cities (tied)
[in-text-ad-2]
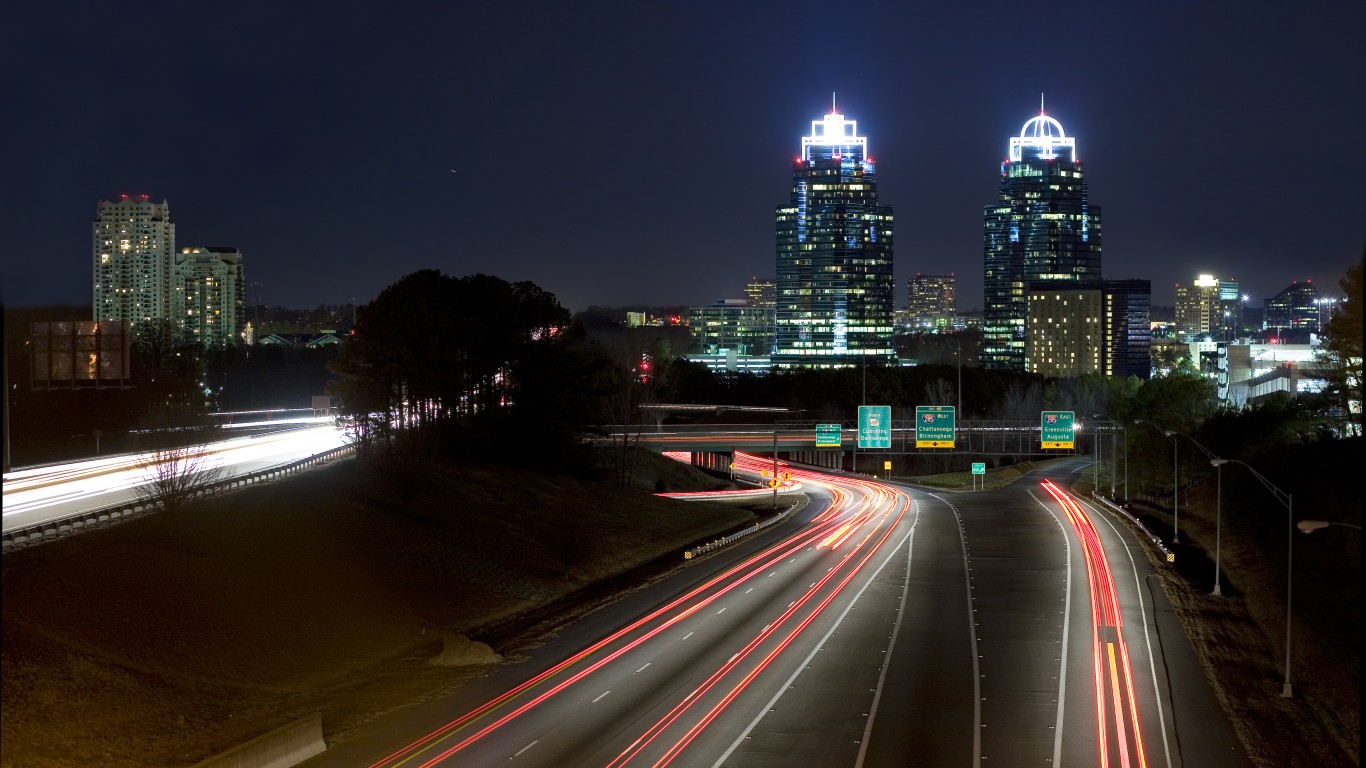
36. Dunwoody, Georgia
> Adults with at least a bachelor’s degree: 72.2%
> Median household income: $96,057 — 301st highest of 1,771 cities
> Estimated unemployment rate 2015-2019, all workers: 1.9% — 237th lowest of 1,771 cities (tied)
> Estimated unemployment rate 2015-2019, adults with at least a bachelor’s degree: 1.1% — 107th lowest of 1,771 cities (tied)
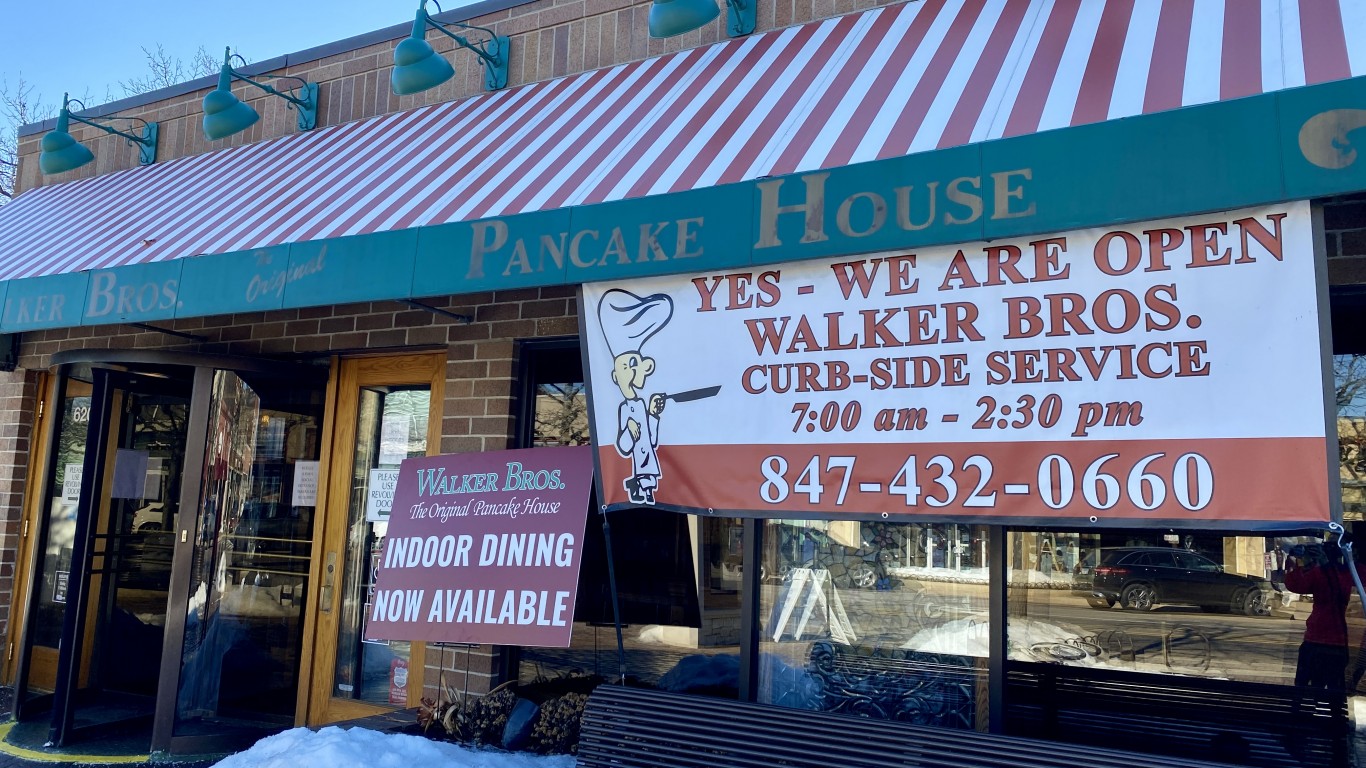
35. Highland Park, Illinois
> Adults with at least a bachelor’s degree: 73.8%
> Median household income: $150,269 — 38th highest of 1,771 cities
> Estimated unemployment rate 2015-2019, all workers: 2.9% — 237th lowest of 1,771 cities (tied)
> Estimated unemployment rate 2015-2019, adults with at least a bachelor’s degree: 2.6% — 903rd lowest of 1,771 cities (tied)
[in-text-ad]
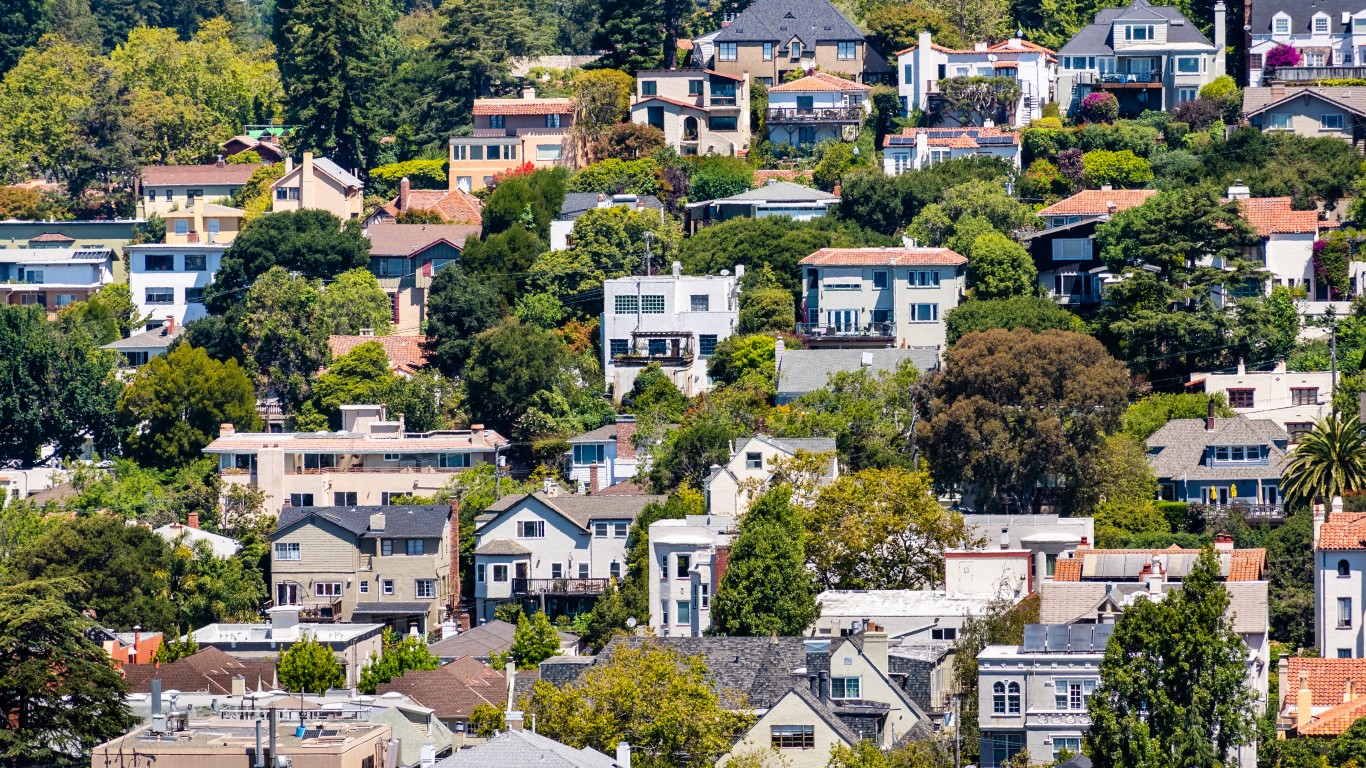
34. Berkeley, California
> Adults with at least a bachelor’s degree: 73.8%
> Median household income: $85,530 — 440th highest of 1,771 cities
> Estimated unemployment rate 2015-2019, all workers: 4.5% — 984th lowest of 1,771 cities (tied)
> Estimated unemployment rate 2015-2019, adults with at least a bachelor’s degree: 3.8% — 1,456th lowest of 1,771 cities (tied)
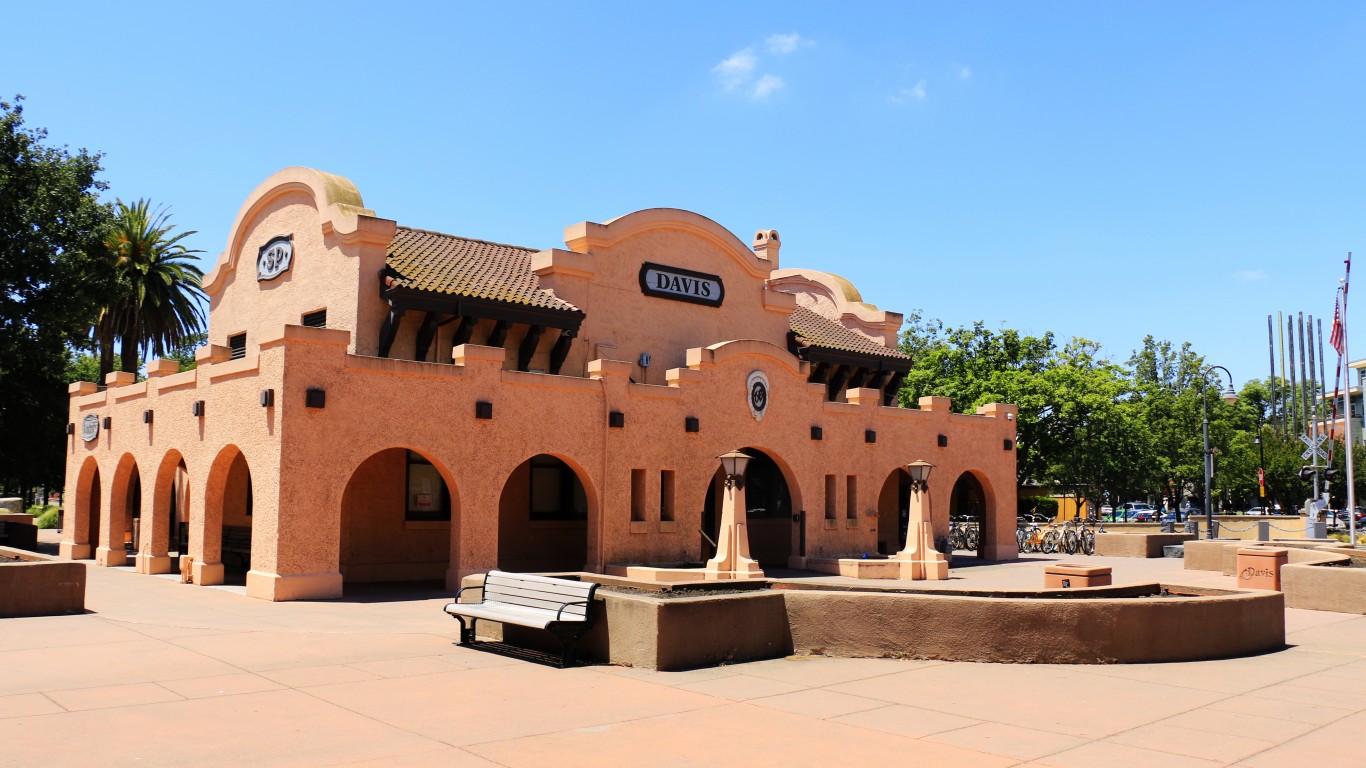
33. Davis, California
> Adults with at least a bachelor’s degree: 73.8%
> Median household income: $69,379 — 757th highest of 1,771 cities
> Estimated unemployment rate 2015-2019, all workers: 4.1% — 1,144th lowest of 1,771 cities (tied)
> Estimated unemployment rate 2015-2019, adults with at least a bachelor’s degree: 2.7% — 958th lowest of 1,771 cities (tied)
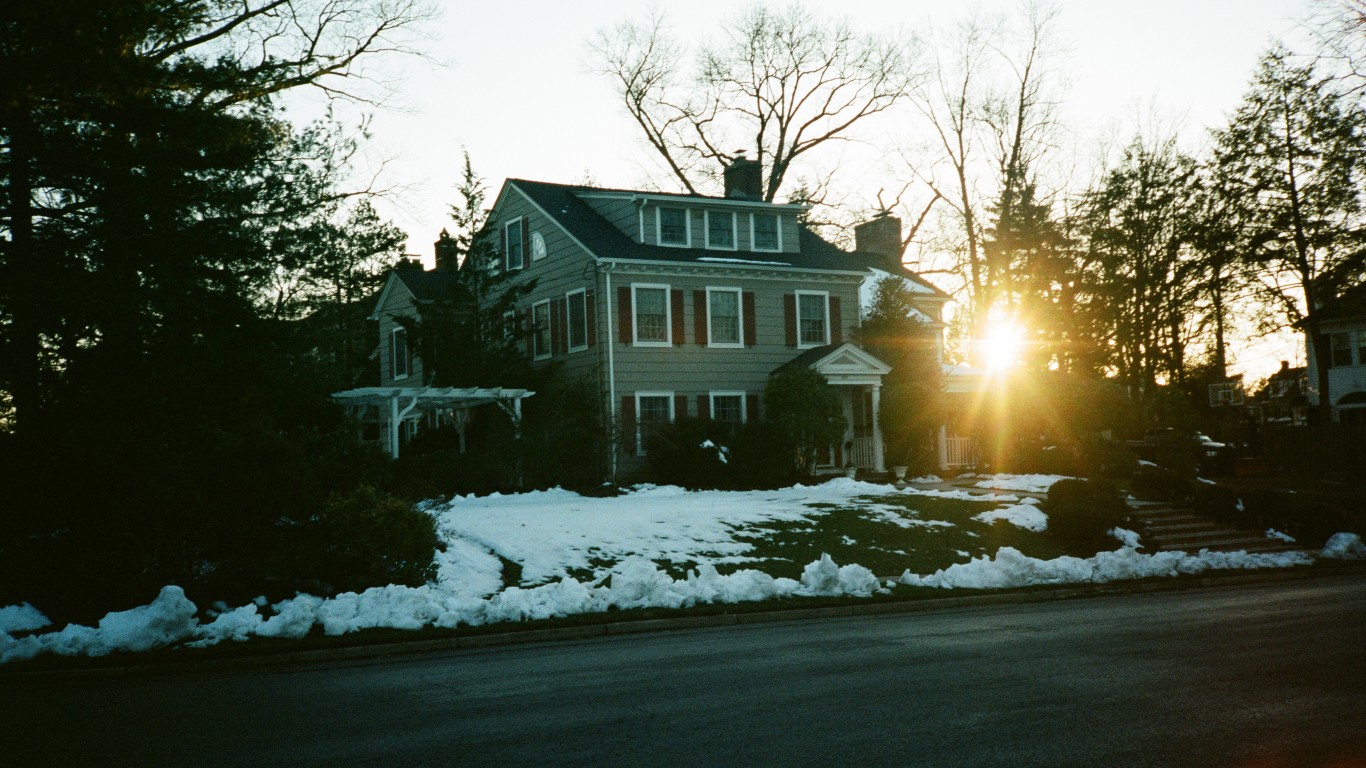
32. Westfield, New Jersey
> Adults with at least a bachelor’s degree: 74.1%
> Median household income: $170,798 — 15th highest of 1,771 cities
> Estimated unemployment rate 2015-2019, all workers: 2.1% — 78th lowest of 1,771 cities (tied)
> Estimated unemployment rate 2015-2019, adults with at least a bachelor’s degree: 1.5% — 228th lowest of 1,771 cities (tied)
[in-text-ad-2]

31. Dublin, Ohio
> Adults with at least a bachelor’s degree: 74.6%
> Median household income: $137,867 — 51st highest of 1,771 cities
> Estimated unemployment rate 2015-2019, all workers: 2.3% — 52nd lowest of 1,771 cities (tied)
> Estimated unemployment rate 2015-2019, adults with at least a bachelor’s degree: 1.9% — 442nd lowest of 1,771 cities (tied)
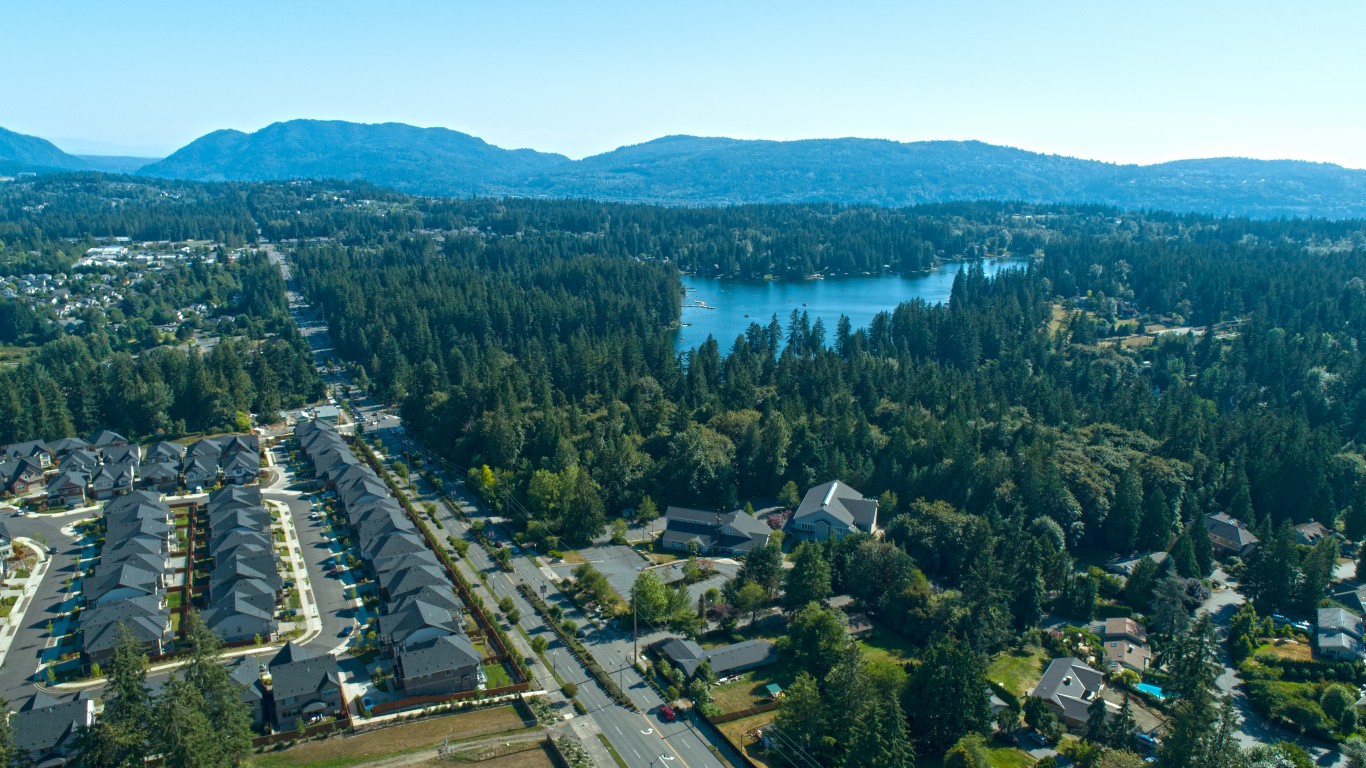
30. Sammamish, Washington
> Adults with at least a bachelor’s degree: 75.2%
> Median household income: $174,003 — 13th highest of 1,771 cities
> Estimated unemployment rate 2015-2019, all workers: 2.7% — 90th lowest of 1,771 cities (tied)
> Estimated unemployment rate 2015-2019, adults with at least a bachelor’s degree: 2.2% — 625th lowest of 1,771 cities (tied)
[in-text-ad]
29. Manhattan Beach, California
> Adults with at least a bachelor’s degree: 75.2%
> Median household income: $153,023 — 34th highest of 1,771 cities
> Estimated unemployment rate 2015-2019, all workers: 4.7% — 913th lowest of 1,771 cities (tied)
> Estimated unemployment rate 2015-2019, adults with at least a bachelor’s degree: 3.7% — 1,418th lowest of 1,771 cities (tied)

28. Arlington, Virginia
> Adults with at least a bachelor’s degree: 75.3%
> Median household income: $120,071 — 103rd highest of 1,771 cities
> Estimated unemployment rate 2015-2019, all workers: 2.5% — 78th lowest of 1,771 cities (tied)
> Estimated unemployment rate 2015-2019, adults with at least a bachelor’s degree: 2.0% — 498th lowest of 1,771 cities (tied)

27. Belmont, Massachusetts
> Adults with at least a bachelor’s degree: 75.4%
> Median household income: $129,380 — 70th highest of 1,771 cities
> Estimated unemployment rate 2015-2019, all workers: 3.3% — 505th lowest of 1,771 cities (tied)
> Estimated unemployment rate 2015-2019, adults with at least a bachelor’s degree: 3.1% — 1,186th lowest of 1,771 cities (tied)
[in-text-ad-2]
26. Ridgewood, New Jersey
> Adults with at least a bachelor’s degree: 76.0%
> Median household income: $184,355 — 10th highest of 1,771 cities
> Estimated unemployment rate 2015-2019, all workers: 3.4% — 269th lowest of 1,771 cities (tied)
> Estimated unemployment rate 2015-2019, adults with at least a bachelor’s degree: 2.8% — 1,016th lowest of 1,771 cities (tied)
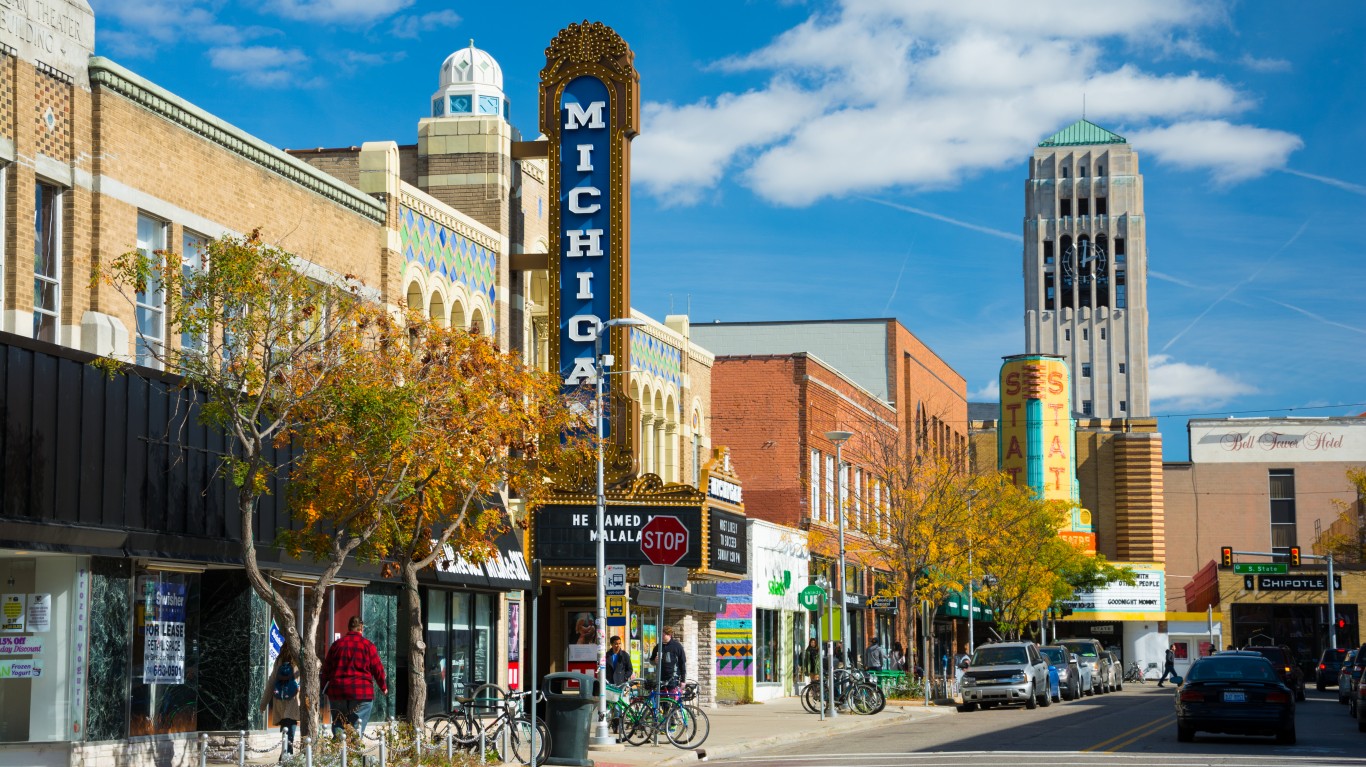
25. Ann Arbor, Michigan
> Adults with at least a bachelor’s degree: 76.0%
> Median household income: $65,745 — 840th highest of 1,771 cities
> Estimated unemployment rate 2015-2019, all workers: 2.5% — 471st lowest of 1,771 cities (tied)
> Estimated unemployment rate 2015-2019, adults with at least a bachelor’s degree: 2.0% — 498th lowest of 1,771 cities (tied)
[in-text-ad]
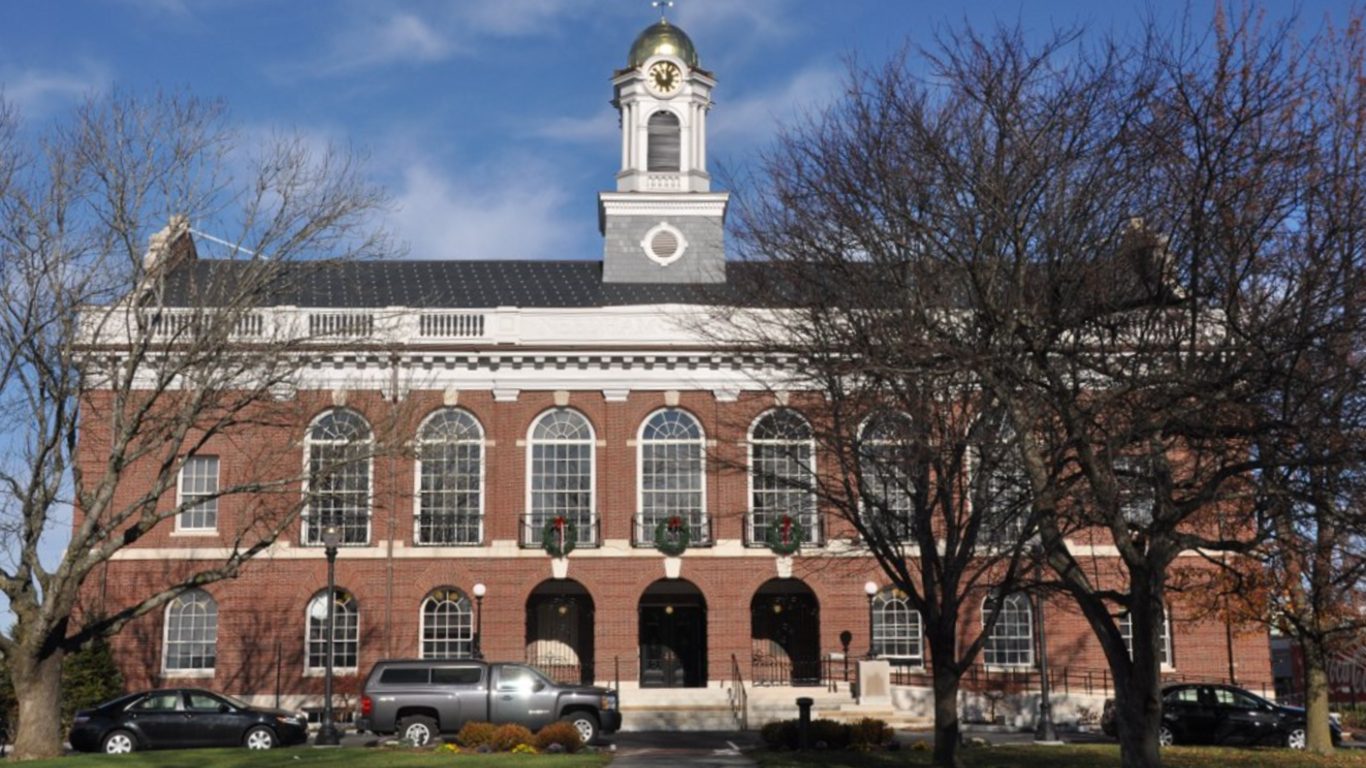
24. Needham, Massachusetts
> Adults with at least a bachelor’s degree: 76.0%
> Median household income: $165,547 — 18th highest of 1,771 cities
> Estimated unemployment rate 2015-2019, all workers: 2.7% — 505th lowest of 1,771 cities (tied)
> Estimated unemployment rate 2015-2019, adults with at least a bachelor’s degree: 2.8% — 1,016th lowest of 1,771 cities (tied)

23. Boulder, Colorado
> Adults with at least a bachelor’s degree: 76.0%
> Median household income: $69,520 — 753rd highest of 1,771 cities
> Estimated unemployment rate 2015-2019, all workers: 3.7% — 747th lowest of 1,771 cities (tied)
> Estimated unemployment rate 2015-2019, adults with at least a bachelor’s degree: 3.2% — 1,233rd lowest of 1,771 cities (tied)
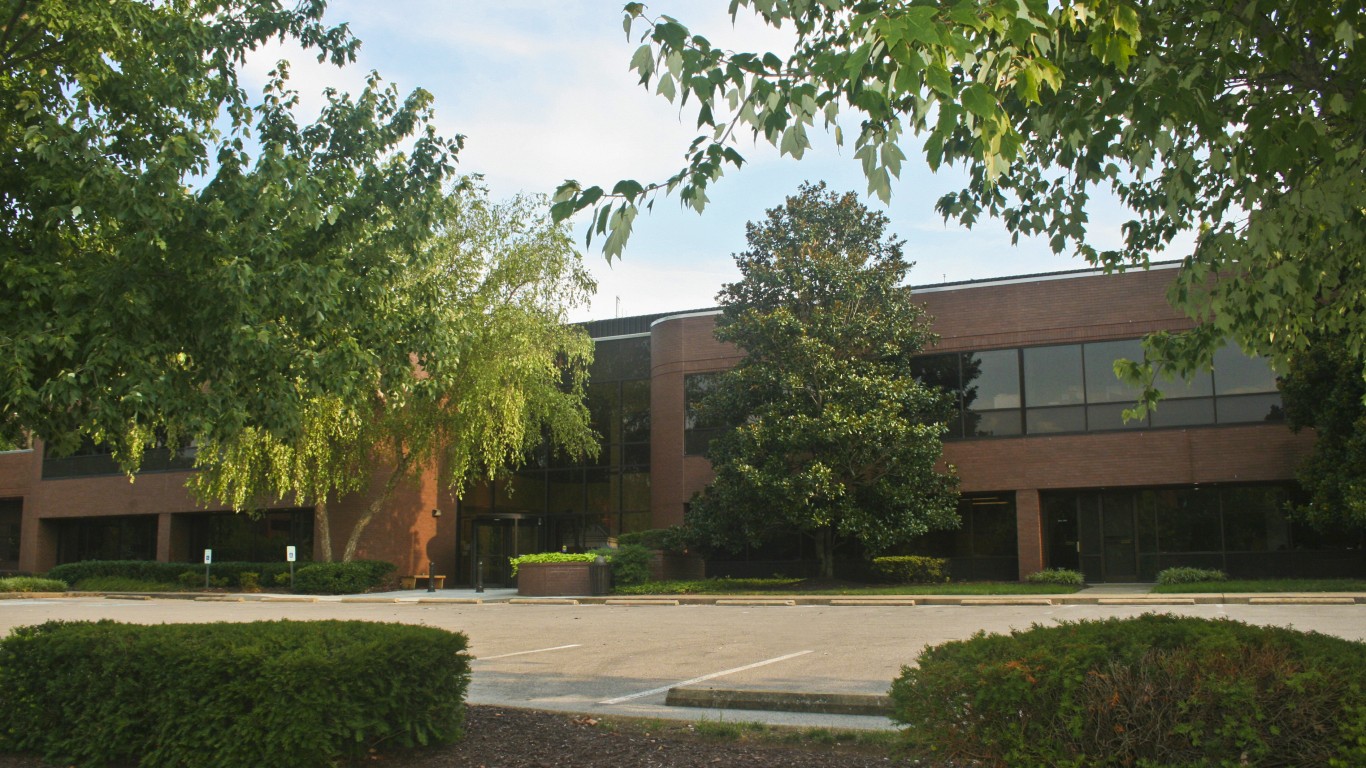
22. Brentwood, Tennessee
> Adults with at least a bachelor’s degree: 76.1%
> Median household income: $168,688 — 16th highest of 1,771 cities
> Estimated unemployment rate 2015-2019, all workers: 2.3% — 67th lowest of 1,771 cities (tied)
> Estimated unemployment rate 2015-2019, adults with at least a bachelor’s degree: 2.4% — 761st lowest of 1,771 cities (tied)
[in-text-ad-2]
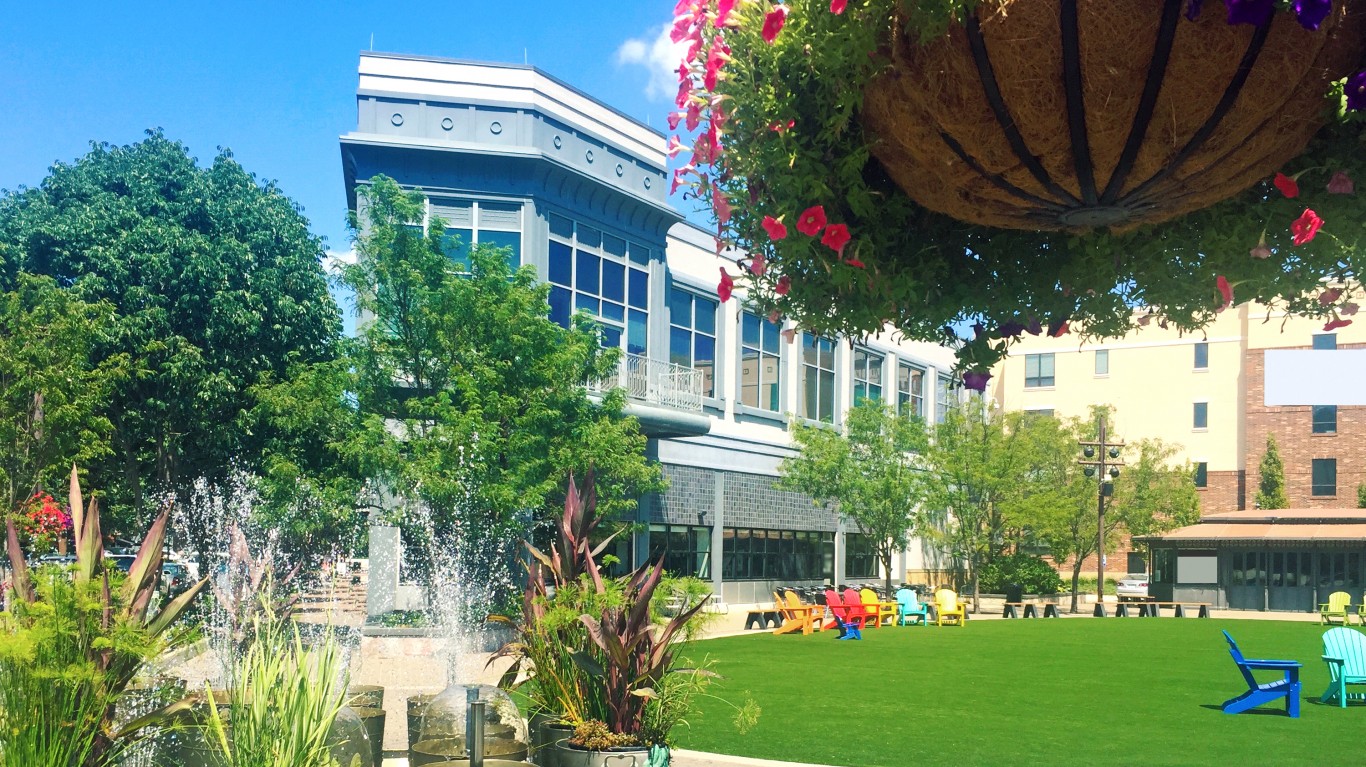
21. Leawood, Kansas
> Adults with at least a bachelor’s degree: 76.9%
> Median household income: $157,515 — 29th highest of 1,771 cities
> Estimated unemployment rate 2015-2019, all workers: 1.8% — 78th lowest of 1,771 cities (tied)
> Estimated unemployment rate 2015-2019, adults with at least a bachelor’s degree: 1.5% — 228th lowest of 1,771 cities (tied)
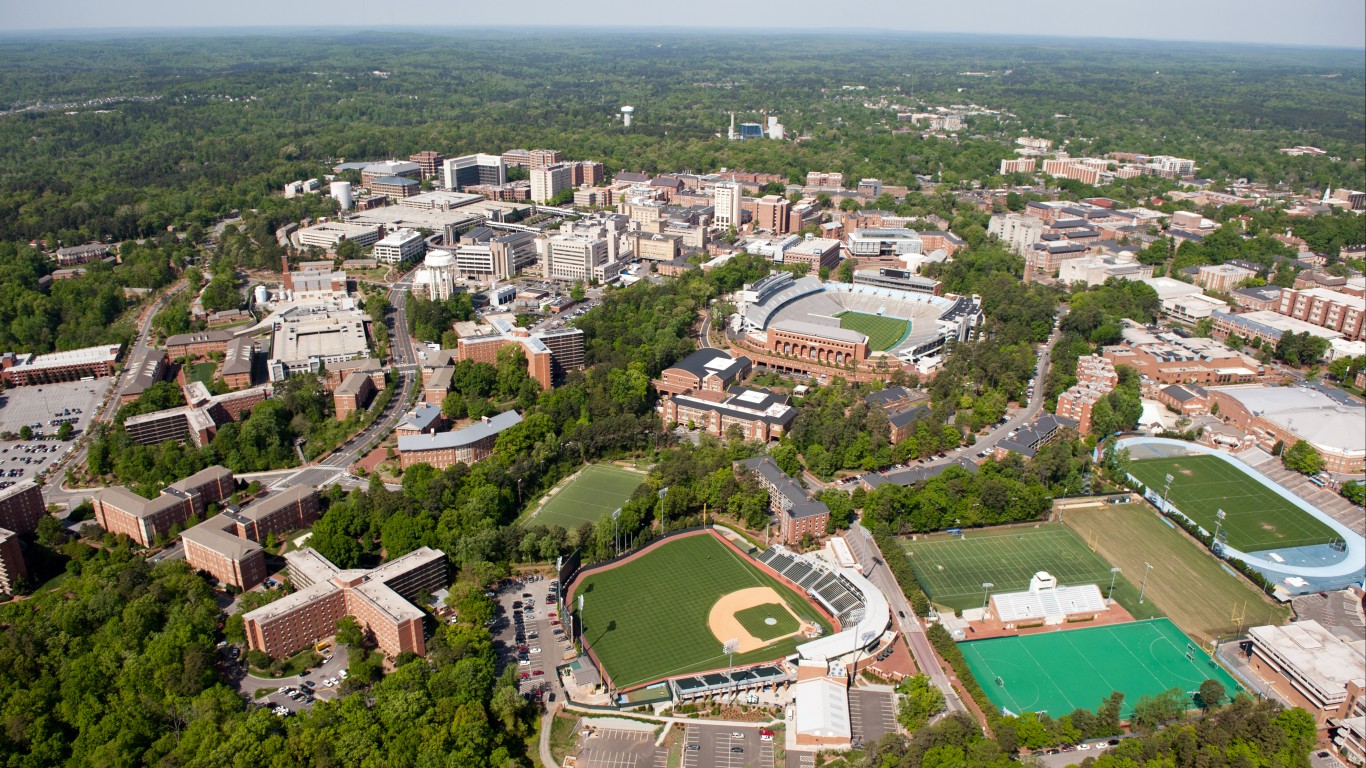
20. Chapel Hill, North Carolina
> Adults with at least a bachelor’s degree: 76.9%
> Median household income: $73,614 — 660th highest of 1,771 cities
> Estimated unemployment rate 2015-2019, all workers: 3.5% — 269th lowest of 1,771 cities (tied)
> Estimated unemployment rate 2015-2019, adults with at least a bachelor’s degree: 2.2% — 625th lowest of 1,771 cities (tied)
[in-text-ad]
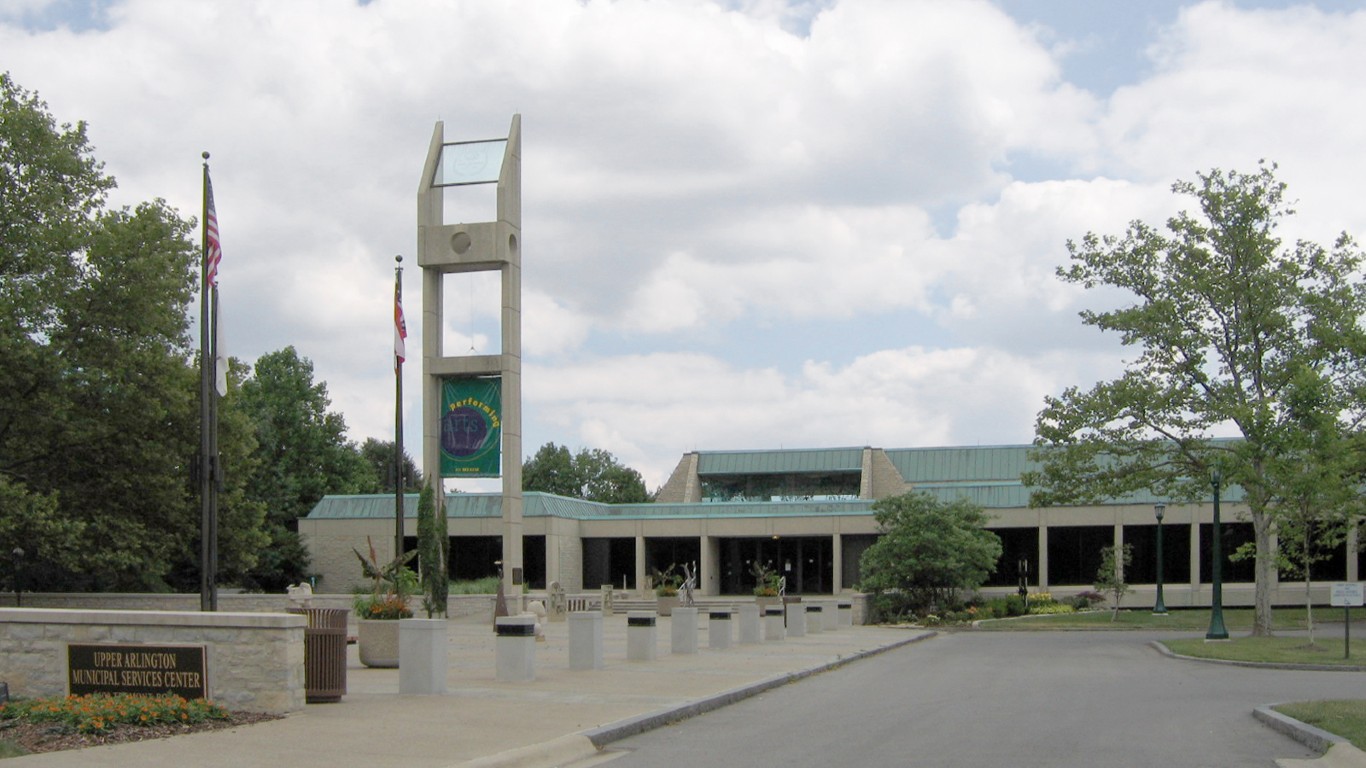
19. Upper Arlington, Ohio
> Adults with at least a bachelor’s degree: 77.1%
> Median household income: $123,548 — 90th highest of 1,771 cities
> Estimated unemployment rate 2015-2019, all workers: 2.0% — 67th lowest of 1,771 cities (tied)
> Estimated unemployment rate 2015-2019, adults with at least a bachelor’s degree: 1.5% — 228th lowest of 1,771 cities (tied)

18. Saratoga, California
> Adults with at least a bachelor’s degree: 77.5%
> Median household income: $191,677 — 8th highest of 1,771 cities
> Estimated unemployment rate 2015-2019, all workers: 3.2% — 387th lowest of 1,771 cities (tied)
> Estimated unemployment rate 2015-2019, adults with at least a bachelor’s degree: 3.0% — 1,134th lowest of 1,771 cities (tied)
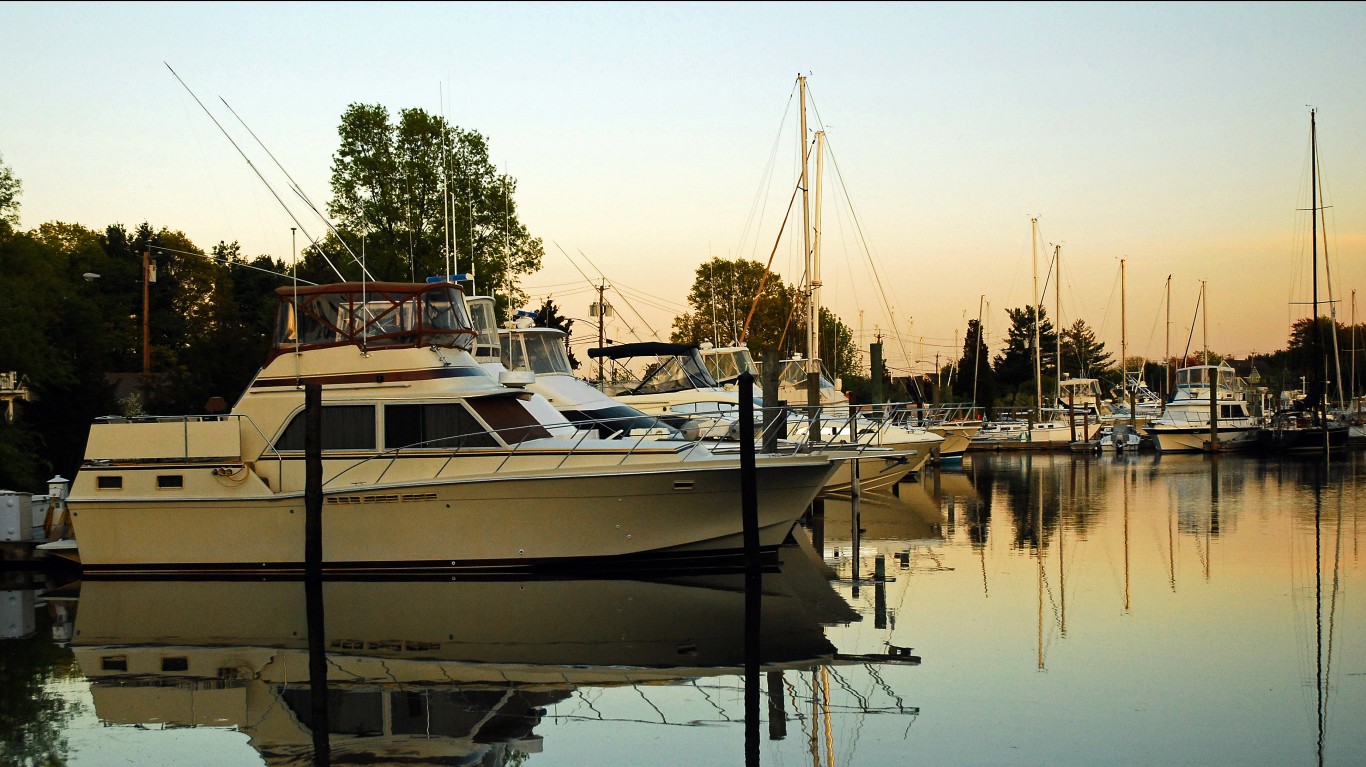
17. Westport, Connecticut
> Adults with at least a bachelor’s degree: 78.0%
> Median household income: $206,466 — 5th highest of 1,771 cities
> Estimated unemployment rate 2015-2019, all workers: 3.3% — 505th lowest of 1,771 cities (tied)
> Estimated unemployment rate 2015-2019, adults with at least a bachelor’s degree: 2.5% — 837th lowest of 1,771 cities (tied)
[in-text-ad-2]

16. Mercer Island, Washington
> Adults with at least a bachelor’s degree: 78.2%
> Median household income: $147,566 — 40th highest of 1,771 cities
> Estimated unemployment rate 2015-2019, all workers: 3.7% — 505th lowest of 1,771 cities (tied)
> Estimated unemployment rate 2015-2019, adults with at least a bachelor’s degree: 3.2% — 1,233rd lowest of 1,771 cities (tied)

15. Cupertino, California
> Adults with at least a bachelor’s degree: 78.8%
> Median household income: $171,917 — 14th highest of 1,771 cities
> Estimated unemployment rate 2015-2019, all workers: 2.8% — 348th lowest of 1,771 cities (tied)
> Estimated unemployment rate 2015-2019, adults with at least a bachelor’s degree: 2.9% — 1,072nd lowest of 1,771 cities (tied)
[in-text-ad]

14. Cambridge, Massachusetts
> Adults with at least a bachelor’s degree: 79.0%
> Median household income: $103,154 — 225th highest of 1,771 cities
> Estimated unemployment rate 2015-2019, all workers: 3.8% — 505th lowest of 1,771 cities (tied)
> Estimated unemployment rate 2015-2019, adults with at least a bachelor’s degree: 3.0% — 1,134th lowest of 1,771 cities (tied)
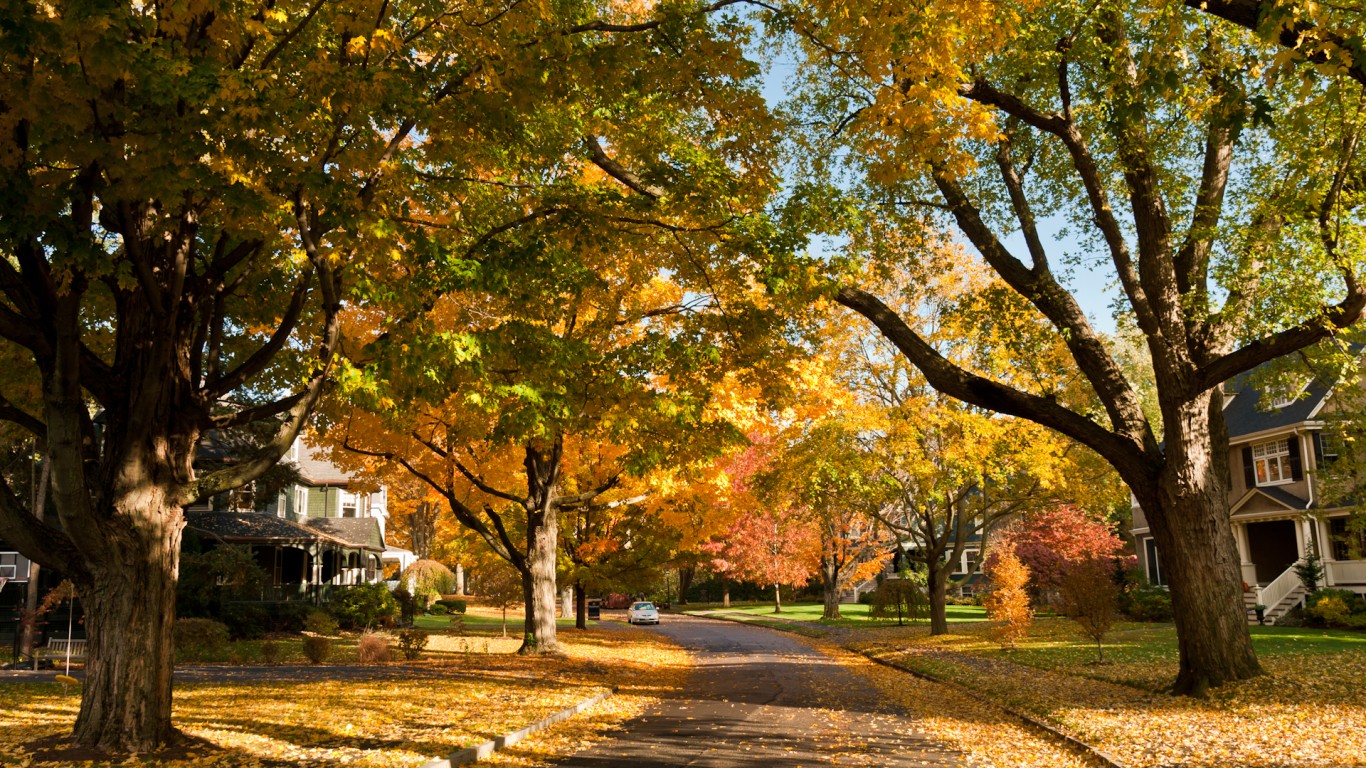
13. Newton, Massachusetts
> Adults with at least a bachelor’s degree: 79.2%
> Median household income: $151,068 — 36th highest of 1,771 cities
> Estimated unemployment rate 2015-2019, all workers: 2.6% — 90th lowest of 1,771 cities (tied)
> Estimated unemployment rate 2015-2019, adults with at least a bachelor’s degree: 2.4% — 761st lowest of 1,771 cities (tied)

12. Hoboken, New Jersey
> Adults with at least a bachelor’s degree: 80.5%
> Median household income: $147,620 — 39th highest of 1,771 cities
> Estimated unemployment rate 2015-2019, all workers: 2.8% — 137th lowest of 1,771 cities (tied)
> Estimated unemployment rate 2015-2019, adults with at least a bachelor’s degree: 2.0% — 498th lowest of 1,771 cities (tied)
[in-text-ad-2]

11. Potomac, Maryland
> Adults with at least a bachelor’s degree: 80.6%
> Median household income: $195,884 — 7th highest of 1,771 cities
> Estimated unemployment rate 2015-2019, all workers: 3.1% — 348th lowest of 1,771 cities (tied)
> Estimated unemployment rate 2015-2019, adults with at least a bachelor’s degree: 2.4% — 761st lowest of 1,771 cities (tied)
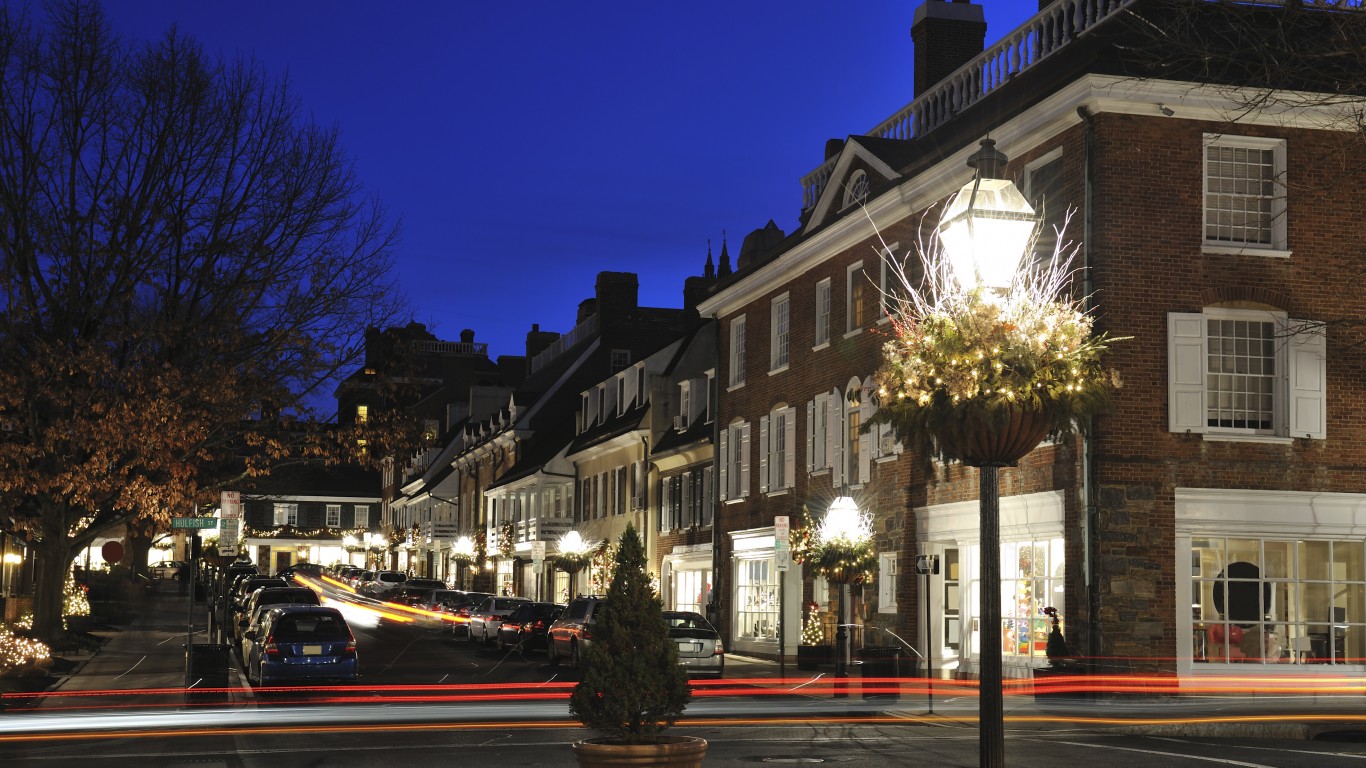
10. Princeton, New Jersey
> Adults with at least a bachelor’s degree: 81.0%
> Median household income: $137,672 — 53rd highest of 1,771 cities
> Estimated unemployment rate 2015-2019, all workers: 2.7% — 237th lowest of 1,771 cities (tied)
> Estimated unemployment rate 2015-2019, adults with at least a bachelor’s degree: 2.1% — 568th lowest of 1,771 cities (tied)
[in-text-ad]
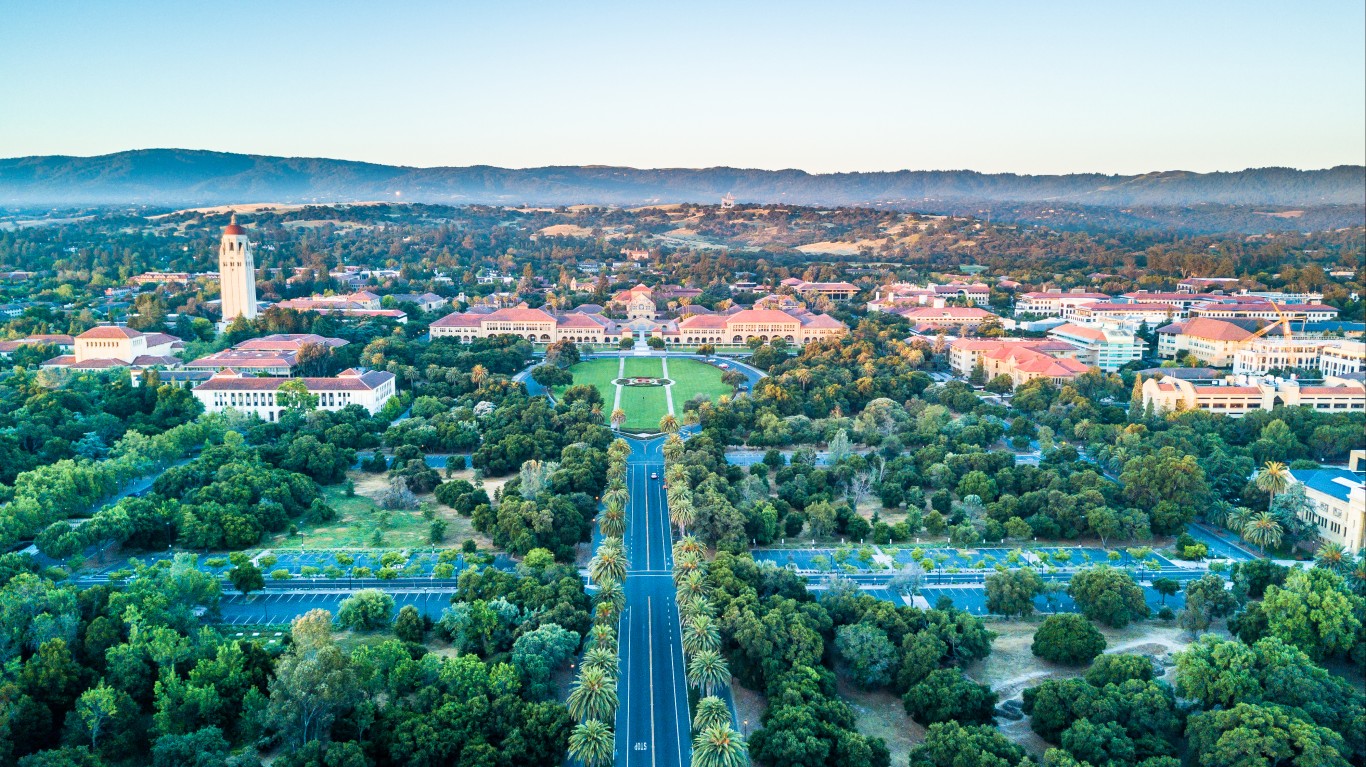
9. Palo Alto, California
> Adults with at least a bachelor’s degree: 82.8%
> Median household income: $158,271 — 28th highest of 1,771 cities
> Estimated unemployment rate 2015-2019, all workers: 3.0% — 203rd lowest of 1,771 cities (tied)
> Estimated unemployment rate 2015-2019, adults with at least a bachelor’s degree: 2.8% — 1,016th lowest of 1,771 cities (tied)
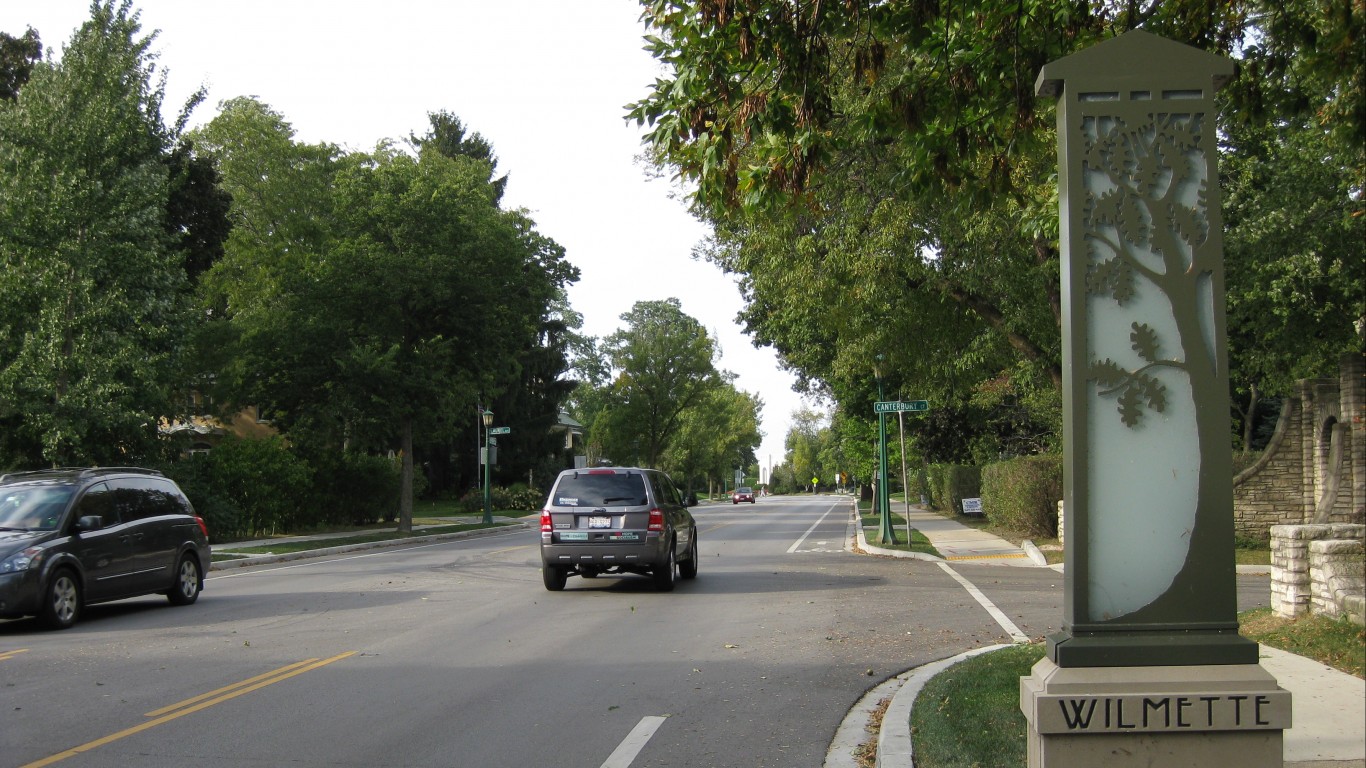
8. Wilmette, Illinois
> Adults with at least a bachelor’s degree: 83.2%
> Median household income: $164,681 — 19th highest of 1,771 cities
> Estimated unemployment rate 2015-2019, all workers: 3.9% — 589th lowest of 1,771 cities (tied)
> Estimated unemployment rate 2015-2019, adults with at least a bachelor’s degree: 3.8% — 1,456th lowest of 1,771 cities (tied)
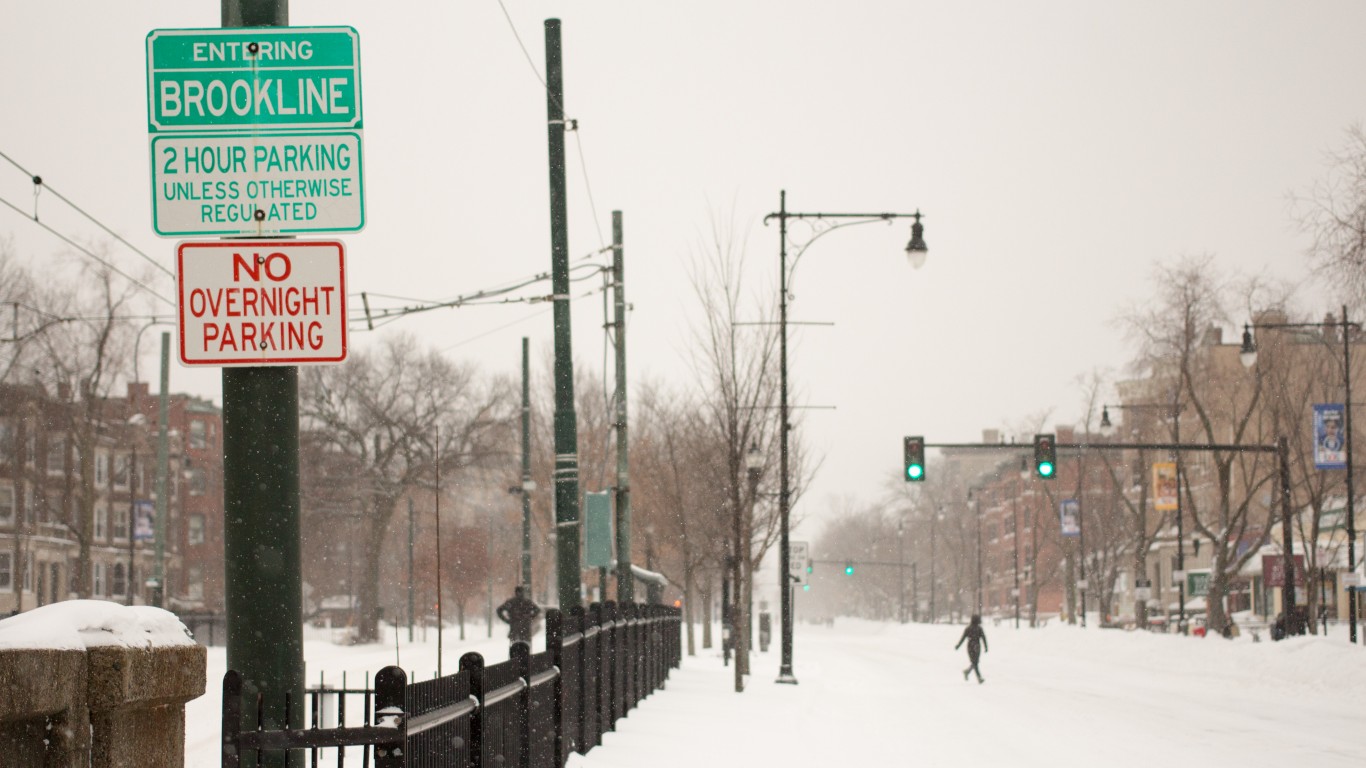
7. Brookline, Massachusetts
> Adults with at least a bachelor’s degree: 83.5%
> Median household income: $117,326 — 114th highest of 1,771 cities
> Estimated unemployment rate 2015-2019, all workers: 2.5% — 90th lowest of 1,771 cities (tied)
> Estimated unemployment rate 2015-2019, adults with at least a bachelor’s degree: 2.2% — 625th lowest of 1,771 cities (tied)
[in-text-ad-2]

6. McLean, Virginia
> Adults with at least a bachelor’s degree: 83.5%
> Median household income: $207,184 — 4th highest of 1,771 cities
> Estimated unemployment rate 2015-2019, all workers: 2.0% — 116th lowest of 1,771 cities (tied)
> Estimated unemployment rate 2015-2019, adults with at least a bachelor’s degree: 2.0% — 498th lowest of 1,771 cities (tied)
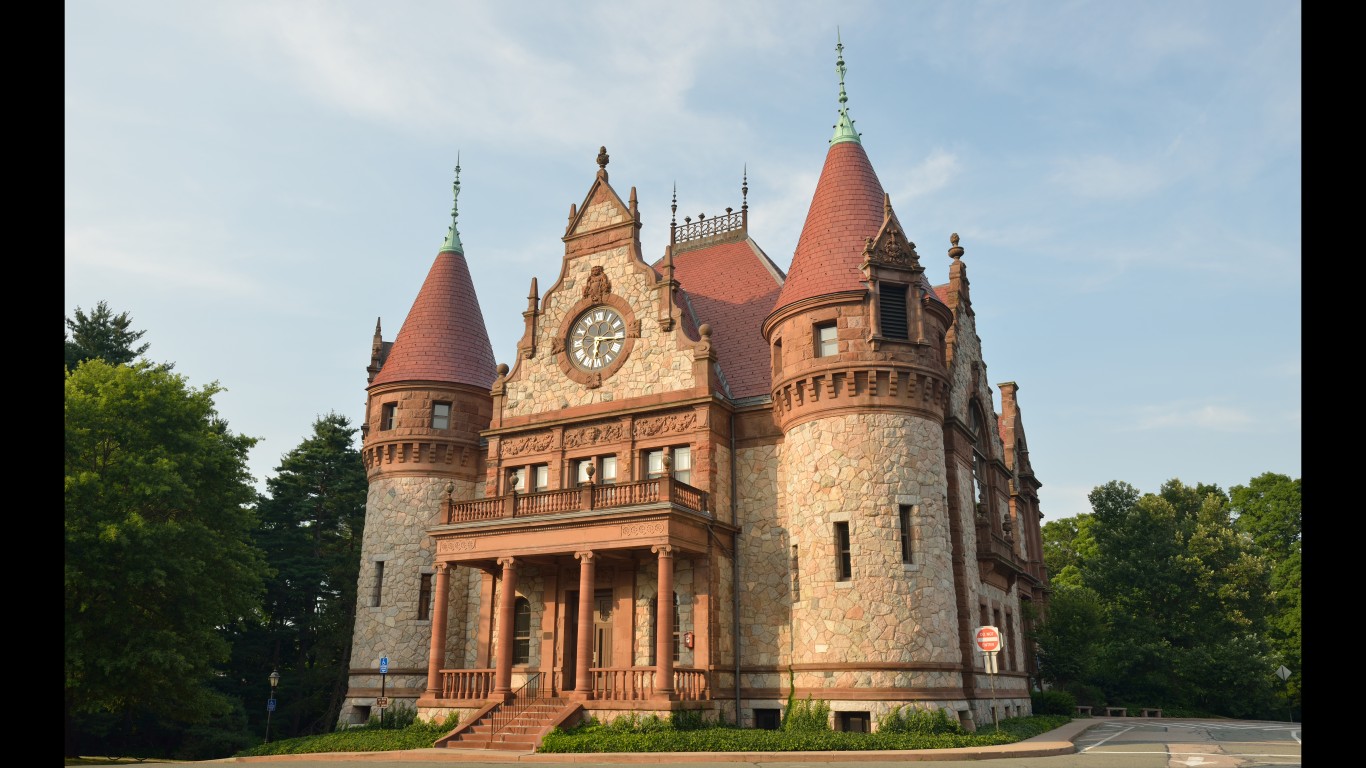
5. Wellesley, Massachusetts
> Adults with at least a bachelor’s degree: 83.8%
> Median household income: $197,132 — 6th highest of 1,771 cities
> Estimated unemployment rate 2015-2019, all workers: 3.9% — 747th lowest of 1,771 cities (tied)
> Estimated unemployment rate 2015-2019, adults with at least a bachelor’s degree: 3.2% — 1,233rd lowest of 1,771 cities (tied)
[in-text-ad]
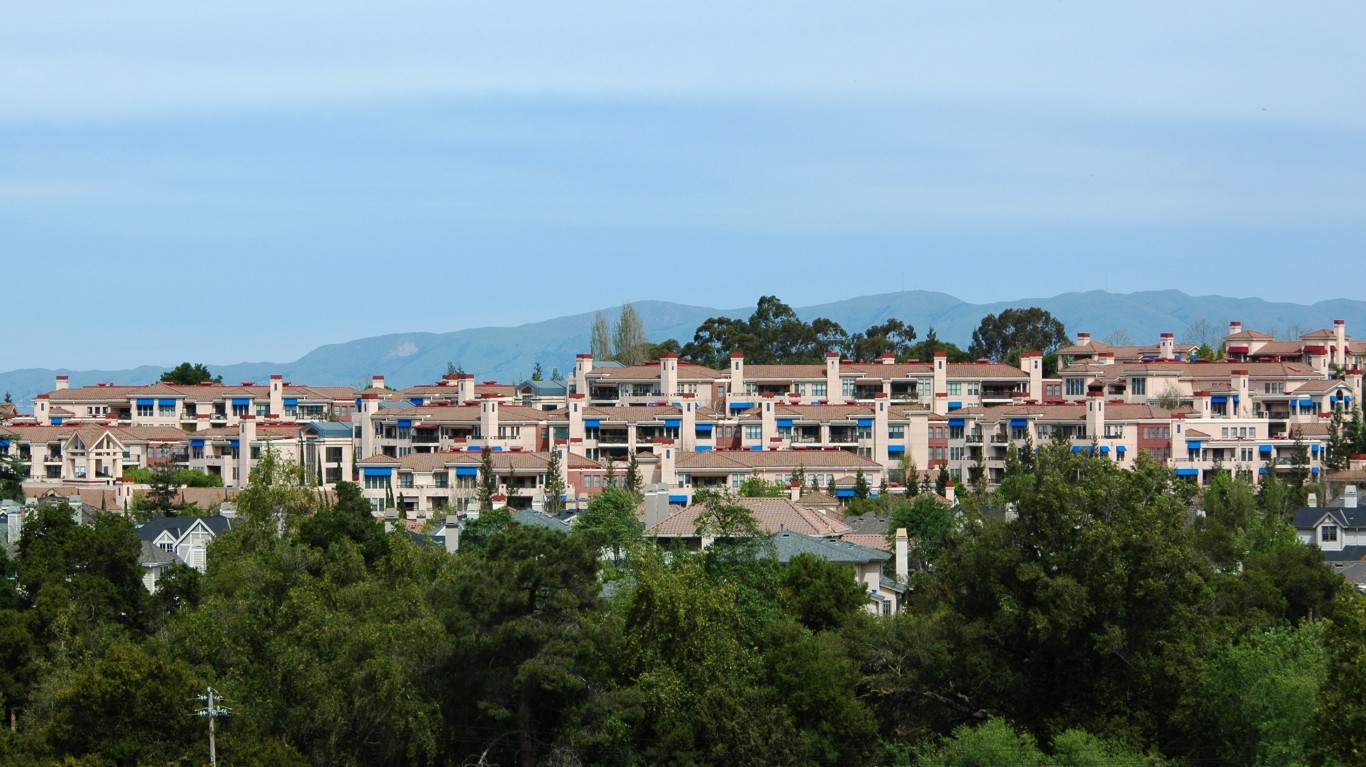
4. Los Altos, California
> Adults with at least a bachelor’s degree: 84.2%
> Median household income: $235,278 — 2nd highest of 1,771 cities
> Estimated unemployment rate 2015-2019, all workers: 3.2% — 237th lowest of 1,771 cities (tied)
> Estimated unemployment rate 2015-2019, adults with at least a bachelor’s degree: 3.5% — 1,351st lowest of 1,771 cities (tied)
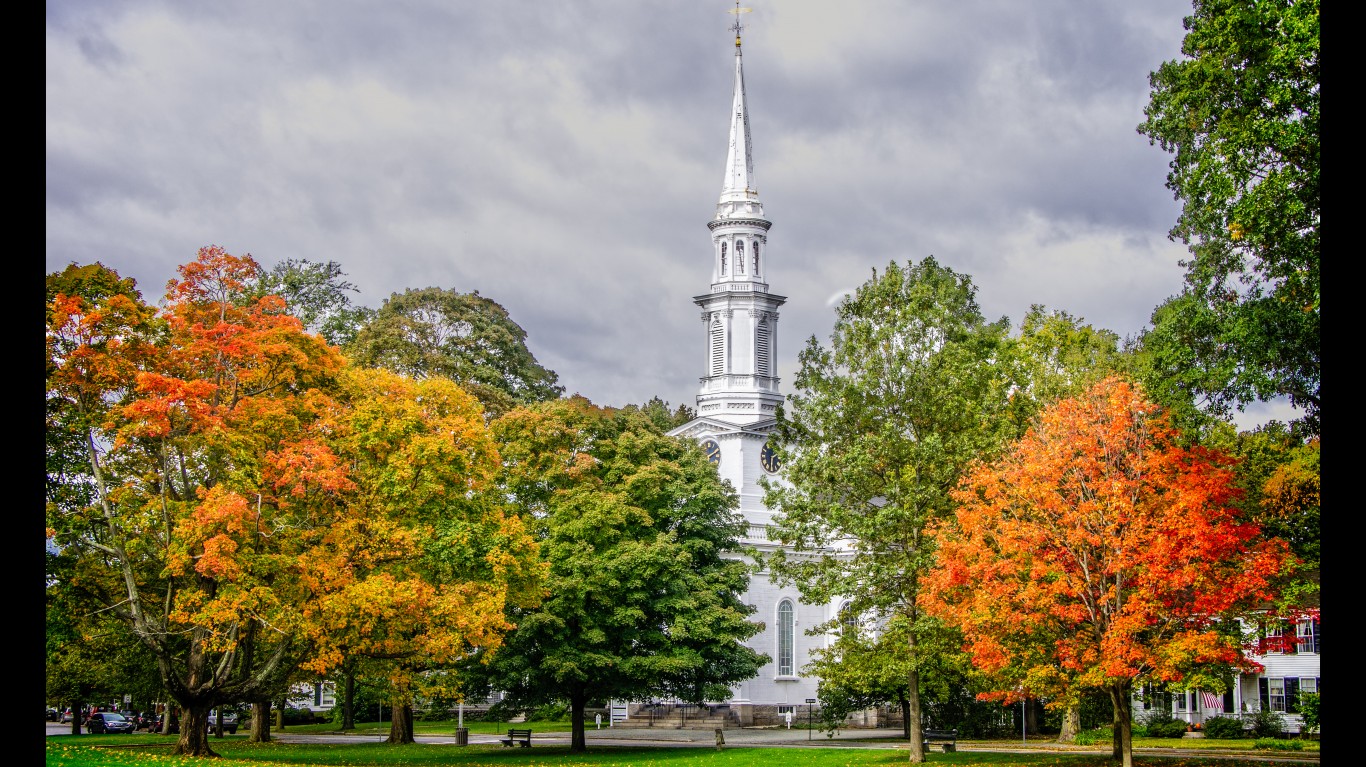
3. Lexington, Massachusetts
> Adults with at least a bachelor’s degree: 84.7%
> Median household income: $186,201 — 9th highest of 1,771 cities
> Estimated unemployment rate 2015-2019, all workers: 3.5% — 348th lowest of 1,771 cities (tied)
> Estimated unemployment rate 2015-2019, adults with at least a bachelor’s degree: 3.8% — 1,456th lowest of 1,771 cities (tied)
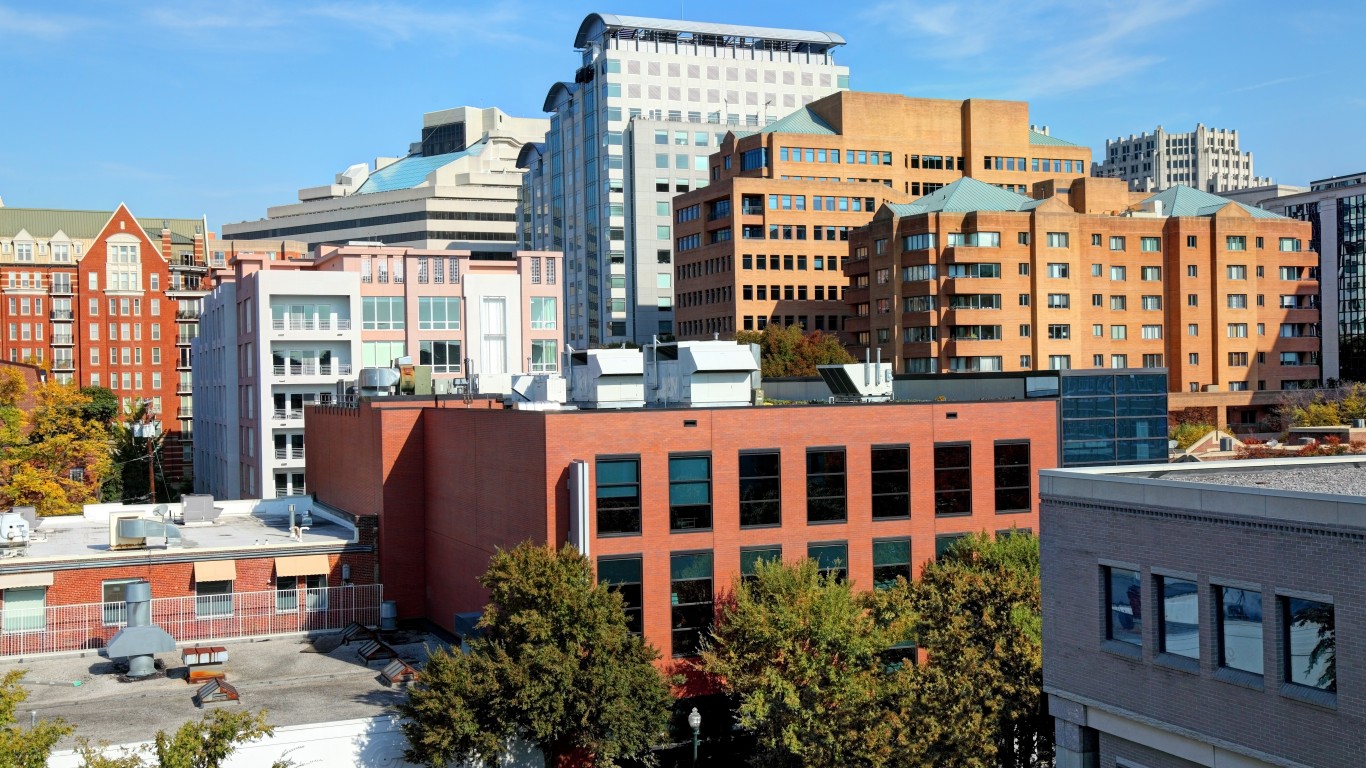
2. Bethesda, Maryland
> Adults with at least a bachelor’s degree: 85.9%
> Median household income: $164,142 — 20th highest of 1,771 cities
> Estimated unemployment rate 2015-2019, all workers: 2.7% — 174th lowest of 1,771 cities (tied)
> Estimated unemployment rate 2015-2019, adults with at least a bachelor’s degree: 2.3% — 680th lowest of 1,771 cities (tied)
[in-text-ad-2]
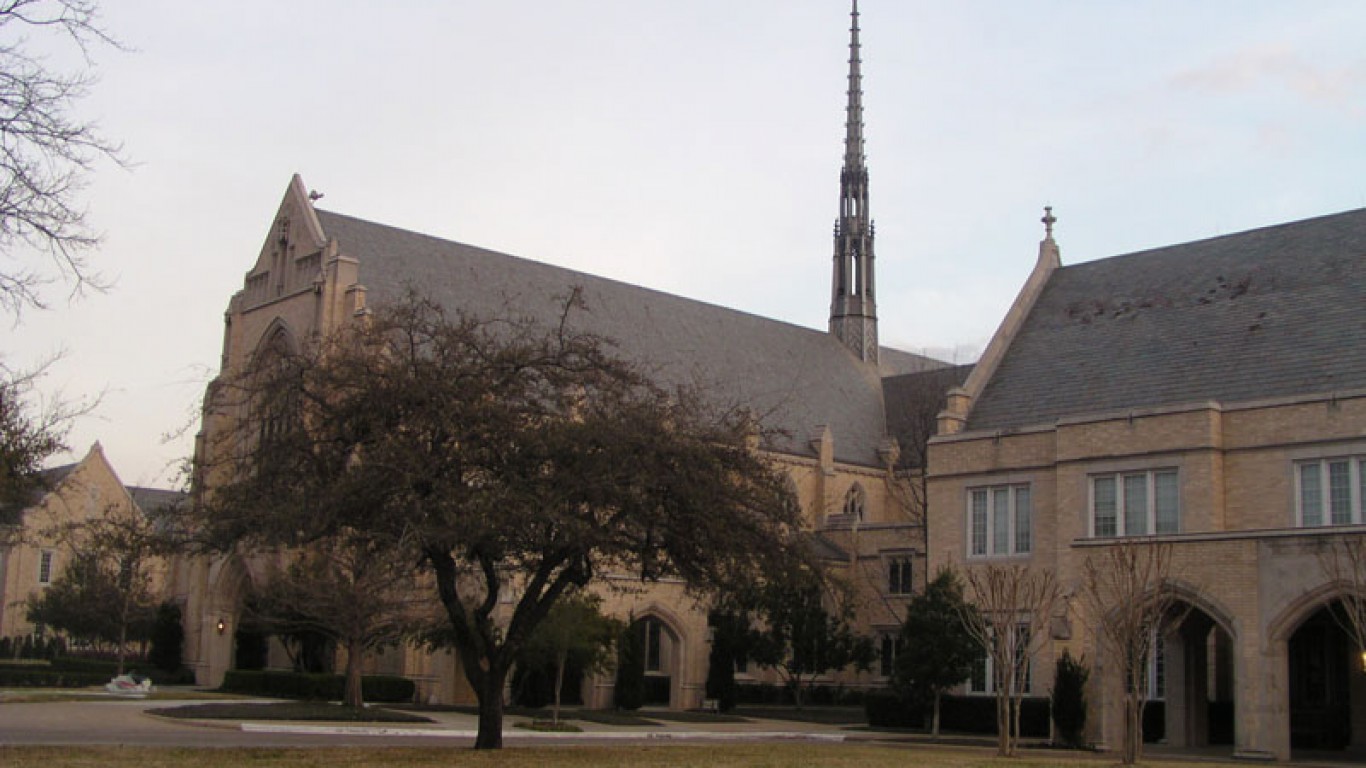
1. University Park, Texas
> Adults with at least a bachelor’s degree: 87.8%
> Median household income: $224,485 — 3rd highest of 1,771 cities
> Estimated unemployment rate 2015-2019, all workers: 2.3% — 308th lowest of 1,771 cities (tied)
> Estimated unemployment rate 2015-2019, adults with at least a bachelor’s degree: 2.4% — 761st lowest of 1,771 cities (tied)
Methodology:
To determine America’s most educated cities, 24/7 Wall St. reviewed five-year estimates of the percentage of adults 25 years and over with at least a bachelor’s degree from the U.S. Census Bureau’s 2019 American Community Survey (ACS). Information on median household income, unemployment rates for the 25-64-year-old population that have at least a bachelor’s degree, and unemployment rates for the 25-64-year-old population for all educational attainment levels are five-year estimates from the 2019 ACS.
We used Census “place” geographies — a category that includes 29,573 incorporated legal entities and Census-designated statistical entities. We only considered the 29,320 places that had boundaries that fell within one of the 50 states or the District of Columbia.
We defined cities based on a population threshold — having more than 25,000 people — and 1,775 of the places fell within this threshold.
Cities were then excluded if bachelor’s degree or higher attainment rates were not available in the 2019 ACS, if the city’s 25 and older population was less than 1,000, or if the sampling error associated with a city’s data was deemed too high.
The sampling error was defined as too high if the coefficient of variation — a statistical assessment of how reliable an estimate is — for a city’s bachelor’s or higher attainment rate was above 15% and greater than two standard deviations above the mean CV for all cities’ bachelor’s or higher attainment rate. We similarly excluded cities that had a sampling error too high for their 25 and over population estimates, using the same definition.
The remaining 1,771 places were ranked based on the share of adults 25 years and over with at least a bachelor’s degree.
Cash Back Credit Cards Have Never Been This Good
Credit card companies are at war, handing out free rewards and benefits to win the best customers. A good cash back card can be worth thousands of dollars a year in free money, not to mention other perks like travel, insurance, and access to fancy lounges. See our top picks for the best credit cards today. You won’t want to miss some of these offers.
Flywheel Publishing has partnered with CardRatings for our coverage of credit card products. Flywheel Publishing and CardRatings may receive a commission from card issuers.
Thank you for reading! Have some feedback for us?
Contact the 24/7 Wall St. editorial team.
 24/7 Wall St.
 24/7 Wall St.
 24/7 Wall St.
 24/7 Wall St.
