
The American Southwest is in the vice of a massive heat wave that covers several states. The all-time U.S. record of 134 degrees Fahrenheit, set in Death Valley, California, on July 10, 1913, could even fall.
This spike coincides with one of the worst droughts since the government began to keep records. It covers states as far north as Montana, as far west as California and Oregon, and as far south as Arizona, New Mexico, and western Texas on the Mexican border, according to the U.S. Drought Monitor.
Massive areas of cropland and cattle ranges could be ruined for decades. Meanwhile, the nation’s 10th largest city — Phoenix — has recently reported temperatures approaching 120 degrees. The highest temp on record in Phoenix is 122 degrees, the highest temperature of any city considered for this list.
Click here to see the hottest cities in America.
Phoenix’s population of 5,059,909 has grown over 10% in the past decade. This makes it among the fastest-growing large cities in the country. The city’s population has more than doubled since 1990, when the figure was 2,238,480, and quadrupled since 1970, when it was 1,039,144. Many people move to Phoenix because of the warm, dry weather and the lack of the kind of cold winter in the northern tier of states. These people currently live in a city that may be barely habitable during some parts of the summer.
Weather.com forecasts temperatures of 118 degrees in Phoenix on Tuesday. Temperatures are expected to stay at that level during the daytime for the next three days. Phoenix is also in one of the epicenters of the drought, in an area the Drought Monitor designates as “exceptional drought.” That is the worst kind possible, described as “Exceptional and widespread crop/pasture losses and shortages of water in reservoirs, streams, and wells creating water emergencies.” Nearby, The Telegraph Fire has burned over 104,755 acres and continues to spread rapidly. It is already one of the largest wildfires in state history.
Julie Malingowski, a meteorologist for the National Weather Service, told The New York Times, “There’s no relief overnight, so if people don’t have proper air-conditioning and can’t cool off, there’s not that respite.” Based on weather patterns, the lack of relief during the hottest days likely will go on for years, or longer.
To determine the hottest cities in the U.S., 24/7 Wall St. reviewed comparative climatic data from the National Centers for Environmental Information (a part of NOAA), which tracks the highest temperature on record and the mean number of days in a year where the maximum temperature is 90 degrees Fahrenheit or more as recorded by select weather observing stations within all 50 states, Puerto Rico, and Pacific Islands.

47. Colorado Springs, CO
> Highest temp on record (1940-2018): 101 F
> Days per year with 90 F+ temp: 19
> Population in 2019: 464,871
[in-text-ad]

46. New Orleans, LA
> Highest temp on record (1940-2018): 102 F
> Days per year with 90 F+ temp: 75
> Population in 2019: 390,845

45. Seattle, WA
> Highest temp on record (1940-2018): 103 F
> Days per year with 90 F+ temp: 3
> Population in 2019: 724,305

44. Boston, MA
> Highest temp on record (1940-2018): 103 F
> Days per year with 90 F+ temp: 13
> Population in 2019: 684,379
[in-text-ad-2]

43. Milwaukee, WI
> Highest temp on record (1940-2018): 103 F
> Days per year with 90 F+ temp: 10
> Population in 2019: 594,548

42. Pittsburgh, PA
> Highest temp on record (1940-2018): 103 F
> Days per year with 90 F+ temp: 9
> Population in 2019: 302,205
[in-text-ad]

41. Chicago, IL
> Highest temp on record (1940-2018): 104 F
> Days per year with 90 F+ temp: 17
> Population in 2019: 2,709,534

40. Philadelphia, PA
> Highest temp on record (1940-2018): 104 F
> Days per year with 90 F+ temp: 25
> Population in 2019: 1,579,075

39. Columbus, OH
> Highest temp on record (1940-2018): 104 F
> Days per year with 90 F+ temp: 19
> Population in 2019: 878,553
[in-text-ad-2]

38. Charlotte, NC
> Highest temp on record (1940-2018): 104 F
> Days per year with 90 F+ temp: 46
> Population in 2019: 857,425

37. Denver, CO
> Highest temp on record (1940-2018): 104 F
> Days per year with 90 F+ temp: 36
> Population in 2019: 705,576
[in-text-ad]

36. Detroit, MI
> Highest temp on record (1940-2018): 104 F
> Days per year with 90 F+ temp: 12
> Population in 2019: 674,841

35. Cleveland, OH
> Highest temp on record (1940-2018): 104 F
> Days per year with 90 F+ temp: 13
> Population in 2019: 385,282

34. Cincinnati, OH
> Highest temp on record (1940-2018): 104 F
> Days per year with 90 F+ temp: 23
> Population in 2019: 301,394
[in-text-ad-2]

33. Jacksonville, FL
> Highest temp on record (1940-2018): 105 F
> Days per year with 90 F+ temp: 82
> Population in 2019: 890,467

32. Indianapolis, IN
> Highest temp on record (1940-2018): 105 F
> Days per year with 90 F+ temp: 19
> Population in 2019: 864,447
[in-text-ad]

31. Raleigh, NC
> Highest temp on record (1940-2018): 105 F
> Days per year with 90 F+ temp: 44
> Population in 2019: 464,485

30. San Francisco, CA
> Highest temp on record (1940-2018): 106 F
> Days per year with 90 F+ temp: 2
> Population in 2019: 874,961

29. Baltimore, MD
> Highest temp on record (1940-2018): 106 F
> Days per year with 90 F+ temp: 31
> Population in 2019: 609,032
[in-text-ad-2]

28. Atlanta, GA
> Highest temp on record (1940-2018): 106 F
> Days per year with 90 F+ temp: 44
> Population in 2019: 488,800

27. Portland, OR
> Highest temp on record (1940-2018): 107 F
> Days per year with 90 F+ temp: 12
> Population in 2019: 645,291
[in-text-ad]

26. Albuquerque, NM
> Highest temp on record (1940-2018): 107 F
> Days per year with 90 F+ temp: 64
> Population in 2019: 559,374

25. Memphis, TN
> Highest temp on record (1940-2018): 108 F
> Days per year with 90 F+ temp: 68
> Population in 2019: 651,932
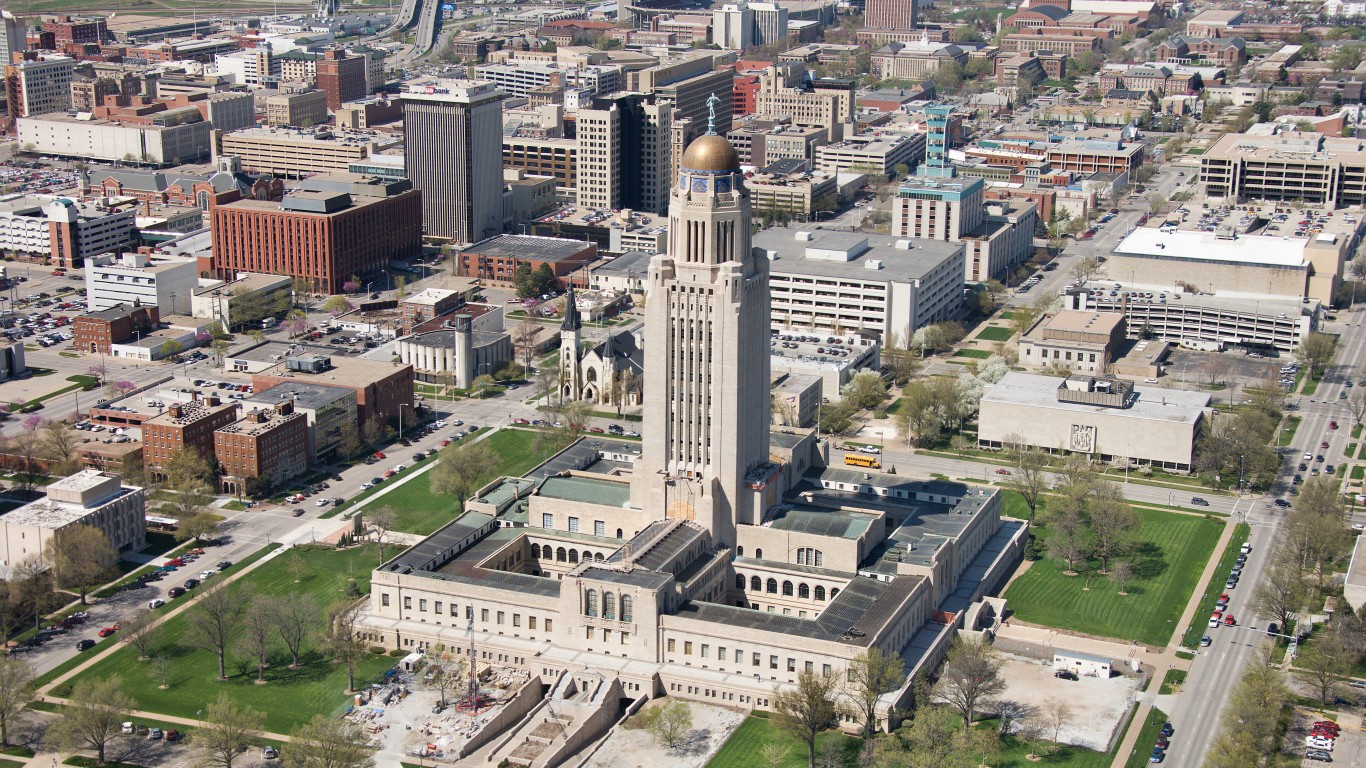
24. Lincoln, NE
> Highest temp on record (1940-2018): 108 F
> Days per year with 90 F+ temp: 42
> Population in 2019: 283,839
[in-text-ad-2]

23. Newark, NJ
> Highest temp on record (1940-2018): 108 F
> Days per year with 90 F+ temp: 23
> Population in 2019: 281,054

22. Houston, TX
> Highest temp on record (1940-2018): 109 F
> Days per year with 90 F+ temp: 104
> Population in 2019: 2,310,432
[in-text-ad]

21. Kansas City, MO
> Highest temp on record (1940-2018): 109 F
> Days per year with 90 F+ temp: 37
> Population in 2019: 486,404

20. Corpus Christi, TX
> Highest temp on record (1940-2018): 109 F
> Days per year with 90 F+ temp: 112
> Population in 2019: 325,780

19. Omaha, NE
> Highest temp on record (1940-2018): 110 F
> Days per year with 90 F+ temp: 34
> Population in 2019: 475,862
[in-text-ad-2]

18. San Antonio, TX
> Highest temp on record (1940-2018): 111 F
> Days per year with 90 F+ temp: 116
> Population in 2019: 1,508,083

17. San Diego, CA
> Highest temp on record (1940-2018): 111 F
> Days per year with 90 F+ temp: 3
> Population in 2019: 1,409,573
[in-text-ad]

16. Long Beach, CA
> Highest temp on record (1940-2018): 111 F
> Days per year with 90 F+ temp: 21
> Population in 2019: 466,776

15. Dallas, TX
> Highest temp on record (1940-2018): 112 F
> Days per year with 90 F+ temp: 103
> Population in 2019: 1,330,612

14. Austin, TX
> Highest temp on record (1940-2018): 112 F
> Days per year with 90 F+ temp: 114
> Population in 2019: 950,807
[in-text-ad-2]

13. Los Angeles, CA
> Highest temp on record (1940-2018): 113 F
> Days per year with 90 F+ temp: 21
> Population in 2019: 3,966,936

12. Oklahoma City, OK
> Highest temp on record (1940-2018): 113 F
> Days per year with 90 F+ temp: 71
> Population in 2019: 643,692
[in-text-ad]

11. Fresno, CA
> Highest temp on record (1940-2018): 113 F
> Days per year with 90 F+ temp: 108
> Population in 2019: 525,010

10. Tulsa, OK
> Highest temp on record (1940-2018): 113 F
> Days per year with 90 F+ temp: 73
> Population in 2019: 402,324

9. Wichita, KS
> Highest temp on record (1940-2018): 113 F
> Days per year with 90 F+ temp: 64
> Population in 2019: 389,877
[in-text-ad-2]

8. El Paso, TX
> Highest temp on record (1940-2018): 114 F
> Days per year with 90 F+ temp: 107
> Population in 2019: 679,813

7. Sacramento, CA
> Highest temp on record (1940-2018): 115 F
> Days per year with 90 F+ temp: 74
> Population in 2019: 500,930
[in-text-ad]

6. Bakersfield, CA
> Highest temp on record (1940-2018): 115 F
> Days per year with 90 F+ temp: 110
> Population in 2019: 377,917

5. Stockton, CA
> Highest temp on record (1940-2018): 115 F
> Days per year with 90 F+ temp: 83
> Population in 2019: 309,228

4. St. Louis, MO
> Highest temp on record (1940-2018): 115 F
> Days per year with 90 F+ temp: 45
> Population in 2019: 308,174
[in-text-ad-2]

3. Las Vegas, NV
> Highest temp on record (1940-2018): 117 F
> Days per year with 90 F+ temp: 135
> Population in 2019: 634,773

2. Tucson, AZ
> Highest temp on record (1940-2018): 117 F
> Days per year with 90 F+ temp: 147
> Population in 2019: 541,482
[in-text-ad]

1. Phoenix, AZ
> Highest temp on record (1940-2018): 122 F
> Days per year with 90 F+ temp: 169
> Population in 2019: 1,633,017
It’s Your Money, Your Future—Own It (sponsor)
Retirement can be daunting, but it doesn’t need to be.
Imagine having an expert in your corner to help you with your financial goals. Someone to help you determine if you’re ahead, behind, or right on track. With SmartAsset, that’s not just a dream—it’s reality. This free tool connects you with pre-screened financial advisors who work in your best interests. It’s quick, it’s easy, so take the leap today and start planning smarter!
Don’t waste another minute; get started right here and help your retirement dreams become a retirement reality.
Thank you for reading! Have some feedback for us?
Contact the 24/7 Wall St. editorial team.
 24/7 Wall St.
 24/7 Wall St.
 24/7 Wall St.
 24/7 Wall St.