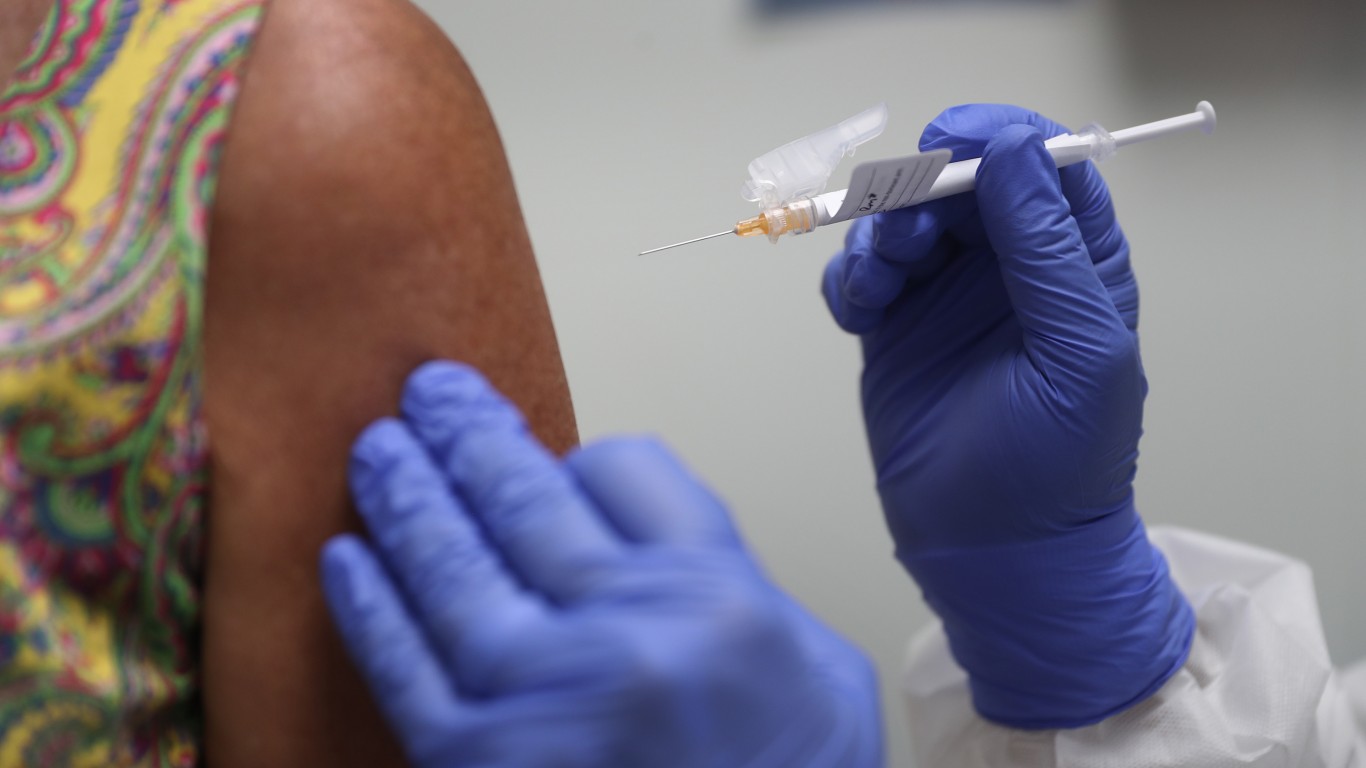
An estimated 161,631,676 Americans have been fully vaccinated, or 49.4% of the population.
So far, vaccination coordination efforts have been largely left to states to manage themselves — and some have proven more efficient at it than others. Depending on the state, the share of the population that has been fully vaccinated ranges from as low as 33.8% all the way up to 66.8%.
Regardless of the share of the population each state has managed to vaccinate, data reveals inefficiencies in vaccination campaigns everywhere in the country as millions of doses are currently sitting idle under the purview of state governments, yet to be administered. As of July 20, only about 86.6% of the 390,736,000 doses of the vaccine that have been distributed to the 50 states and Washington D.C. have been administered. In one state, only 70.4% of delivered doses have gone into the arms of residents.
As the virus mutates and new variants spread, vaccinating the population as rapidly as possible is critical. In total, there have been 10,313 known infections for every 100,000 people nationwide.

Alabama
> Residents who are fully vaccinated as of July 20, 2021: 1,654,644 (33.9% of the pop.)
> Share of vaccine doses administered: 70.4%
> Cumulative COVID-19 cases as of July 20, 2021: 11,476 per 100,000 people (total: 560,917)
> Population: 4,887,871

Alaska
> Residents who are fully vaccinated as of July 20, 2021: 329,206 (44.6% of the pop.)
> Share of vaccine doses administered: 81.6%
> Cumulative COVID-19 cases as of July 20, 2021: 9,418 per 100,000 people (total: 69,453)
> Population: 737,438
These are all the counties in Alaska where COVID-19 is slowing (and where it’s still getting worse).

Arizona
> Residents who are fully vaccinated as of July 20, 2021: 3,245,176 (45.3% of the pop.)
> Share of vaccine doses administered: 83.7%
> Cumulative COVID-19 cases as of July 20, 2021: 12,664 per 100,000 people (total: 908,248)
> Population: 7,171,646

Arkansas
> Residents who are fully vaccinated as of July 20, 2021: 1,069,679 (35.5% of the pop.)
> Share of vaccine doses administered: 80.4%
> Cumulative COVID-19 cases as of July 20, 2021: 12,031 per 100,000 people (total: 362,580)
> Population: 3,013,825

California
> Residents who are fully vaccinated as of July 20, 2021: 20,480,346 (51.8% of the pop.)
> Share of vaccine doses administered: 88.3%
> Cumulative COVID-19 cases as of July 20, 2021: 9,476 per 100,000 people (total: 3,748,365)
> Population: 39,557,045

Colorado
> Residents who are fully vaccinated as of July 20, 2021: 3,086,226 (54.2% of the pop.)
> Share of vaccine doses administered: 89.1%
> Cumulative COVID-19 cases as of July 20, 2021: 9,925 per 100,000 people (total: 565,294)
> Population: 5,695,564

Connecticut
> Residents who are fully vaccinated as of July 20, 2021: 2,225,346 (62.3% of the pop.)
> Share of vaccine doses administered: 93.8%
> Cumulative COVID-19 cases as of July 20, 2021: 9,816 per 100,000 people (total: 350,675)
> Population: 3,572,665

Delaware
> Residents who are fully vaccinated as of July 20, 2021: 504,923 (52.2% of the pop.)
> Share of vaccine doses administered: 81.9%
> Cumulative COVID-19 cases as of July 20, 2021: 11,413 per 100,000 people (total: 110,387)
> Population: 967,171

District of Columbia
> Residents who are fully vaccinated as of July 20, 2021: 381,131 (55.7% of the pop.)
> Share of vaccine doses administered: 82.5%
> Cumulative COVID-19 cases as of July 20, 2021: 7,254 per 100,000 people (total: 49,652)
> Population: 684,498
Click here to see all current COVID-19 data for Washington D.C.

Florida
> Residents who are fully vaccinated as of July 20, 2021: 10,277,618 (48.3% of the pop.)
> Share of vaccine doses administered: 86.1%
> Cumulative COVID-19 cases as of July 20, 2021: 11,300 per 100,000 people (total: 2,406,794)
> Population: 21,299,325

Georgia
> Residents who are fully vaccinated as of July 20, 2021: 4,025,666 (38.3% of the pop.)
> Share of vaccine doses administered: 76.4%
> Cumulative COVID-19 cases as of July 20, 2021: 10,894 per 100,000 people (total: 1,145,976)
> Population: 10,519,475

Hawaii
> Residents who are fully vaccinated as of July 20, 2021: 750,266 (52.8% of the pop.)
> Share of vaccine doses administered: 86.7%
> Cumulative COVID-19 cases as of July 20, 2021: 2,655 per 100,000 people (total: 37,717)
> Population: 1,420,491
These are all the counties in Hawaii where COVID-19 is slowing (and where it’s still getting worse).

Idaho
> Residents who are fully vaccinated as of July 20, 2021: 660,309 (37.6% of the pop.)
> Share of vaccine doses administered: 78.7%
> Cumulative COVID-19 cases as of July 20, 2021: 11,222 per 100,000 people (total: 196,856)
> Population: 1,754,208
These are all the counties in Idaho where COVID-19 is slowing (and where it’s still getting worse).

Illinois
> Residents who are fully vaccinated as of July 20, 2021: 6,053,831 (47.5% of the pop.)
> Share of vaccine doses administered: 89.4%
> Cumulative COVID-19 cases as of July 20, 2021: 10,988 per 100,000 people (total: 1,399,946)
> Population: 12,741,080

Indiana
> Residents who are fully vaccinated as of July 20, 2021: 2,933,840 (43.8% of the pop.)
> Share of vaccine doses administered: 87.2%
> Cumulative COVID-19 cases as of July 20, 2021: 11,359 per 100,000 people (total: 760,163)
> Population: 6,691,878

Iowa
> Residents who are fully vaccinated as of July 20, 2021: 1,549,216 (49.1% of the pop.)
> Share of vaccine doses administered: 87.9%
> Cumulative COVID-19 cases as of July 20, 2021: 11,905 per 100,000 people (total: 375,726)
> Population: 3,156,145
These are all the counties in Iowa where COVID-19 is slowing (and where it’s still getting worse).

Kansas
> Residents who are fully vaccinated as of July 20, 2021: 1,255,255 (43.1% of the pop.)
> Share of vaccine doses administered: 81.0%
> Cumulative COVID-19 cases as of July 20, 2021: 11,107 per 100,000 people (total: 323,385)
> Population: 2,911,505
These are all the counties in Kansas where COVID-19 is slowing (and where it’s still getting worse).

Kentucky
> Residents who are fully vaccinated as of July 20, 2021: 2,003,228 (44.8% of the pop.)
> Share of vaccine doses administered: 89.8%
> Cumulative COVID-19 cases as of July 20, 2021: 10,512 per 100,000 people (total: 469,710)
> Population: 4,468,402

Louisiana
> Residents who are fully vaccinated as of July 20, 2021: 1,684,060 (36.1% of the pop.)
> Share of vaccine doses administered: 84.3%
> Cumulative COVID-19 cases as of July 20, 2021: 10,643 per 100,000 people (total: 495,945)
> Population: 4,659,978

Maine
> Residents who are fully vaccinated as of July 20, 2021: 845,498 (63.2% of the pop.)
> Share of vaccine doses administered: 87.3%
> Cumulative COVID-19 cases as of July 20, 2021: 5,191 per 100,000 people (total: 69,474)
> Population: 1,338,404
These are all the counties in Maine where COVID-19 is slowing (and where it’s still getting worse).

Maryland
> Residents who are fully vaccinated as of July 20, 2021: 3,500,639 (57.9% of the pop.)
> Share of vaccine doses administered: 81.9%
> Cumulative COVID-19 cases as of July 20, 2021: 7,682 per 100,000 people (total: 464,197)
> Population: 6,042,718

Massachusetts
> Residents who are fully vaccinated as of July 20, 2021: 4,357,007 (63.1% of the pop.)
> Share of vaccine doses administered: 91.5%
> Cumulative COVID-19 cases as of July 20, 2021: 10,320 per 100,000 people (total: 712,272)
> Population: 6,902,149

Michigan
> Residents who are fully vaccinated as of July 20, 2021: 4,826,819 (48.3% of the pop.)
> Share of vaccine doses administered: 82.0%
> Cumulative COVID-19 cases as of July 20, 2021: 10,038 per 100,000 people (total: 1,003,432)
> Population: 9,995,915

Minnesota
> Residents who are fully vaccinated as of July 20, 2021: 2,997,756 (53.4% of the pop.)
> Share of vaccine doses administered: 90.5%
> Cumulative COVID-19 cases as of July 20, 2021: 10,827 per 100,000 people (total: 607,524)
> Population: 5,611,179

Mississippi
> Residents who are fully vaccinated as of July 20, 2021: 1,008,740 (33.8% of the pop.)
> Share of vaccine doses administered: 76.4%
> Cumulative COVID-19 cases as of July 20, 2021: 10,943 per 100,000 people (total: 326,804)
> Population: 2,986,530

Missouri
> Residents who are fully vaccinated as of July 20, 2021: 2,472,883 (40.4% of the pop.)
> Share of vaccine doses administered: 83.9%
> Cumulative COVID-19 cases as of July 20, 2021: 10,567 per 100,000 people (total: 647,403)
> Population: 6,126,452

Montana
> Residents who are fully vaccinated as of July 20, 2021: 468,821 (44.1% of the pop.)
> Share of vaccine doses administered: 85.3%
> Cumulative COVID-19 cases as of July 20, 2021: 10,794 per 100,000 people (total: 114,663)
> Population: 1,062,305

Nebraska
> Residents who are fully vaccinated as of July 20, 2021: 944,969 (49.0% of the pop.)
> Share of vaccine doses administered: 89.7%
> Cumulative COVID-19 cases as of July 20, 2021: 11,707 per 100,000 people (total: 225,861)
> Population: 1,929,268

Nevada
> Residents who are fully vaccinated as of July 20, 2021: 1,339,499 (44.1% of the pop.)
> Share of vaccine doses administered: 90.7%
> Cumulative COVID-19 cases as of July 20, 2021: 11,307 per 100,000 people (total: 343,096)
> Population: 3,034,392
These are all the counties in Nevada where COVID-19 is slowing (and where it’s still getting worse).

New Hampshire
> Residents who are fully vaccinated as of July 20, 2021: 785,697 (57.9% of the pop.)
> Share of vaccine doses administered: 83.9%
> Cumulative COVID-19 cases as of July 20, 2021: 7,365 per 100,000 people (total: 99,907)
> Population: 1,356,458

New Jersey
> Residents who are fully vaccinated as of July 20, 2021: 5,077,581 (57.0% of the pop.)
> Share of vaccine doses administered: 85.8%
> Cumulative COVID-19 cases as of July 20, 2021: 11,550 per 100,000 people (total: 1,028,931)
> Population: 8,908,520

New Mexico
> Residents who are fully vaccinated as of July 20, 2021: 1,179,876 (56.3% of the pop.)
> Share of vaccine doses administered: N/A
> Cumulative COVID-19 cases as of July 20, 2021: 9,888 per 100,000 people (total: 207,189)
> Population: 2,095,428

New York
> Residents who are fully vaccinated as of July 20, 2021: 10,915,227 (55.9% of the pop.)
> Share of vaccine doses administered: 91.8%
> Cumulative COVID-19 cases as of July 20, 2021: 10,875 per 100,000 people (total: 2,125,280)
> Population: 19,542,209

North Carolina
> Residents who are fully vaccinated as of July 20, 2021: 4,519,991 (43.5% of the pop.)
> Share of vaccine doses administered: 80.1%
> Cumulative COVID-19 cases as of July 20, 2021: 9,851 per 100,000 people (total: 1,022,876)
> Population: 10,383,620

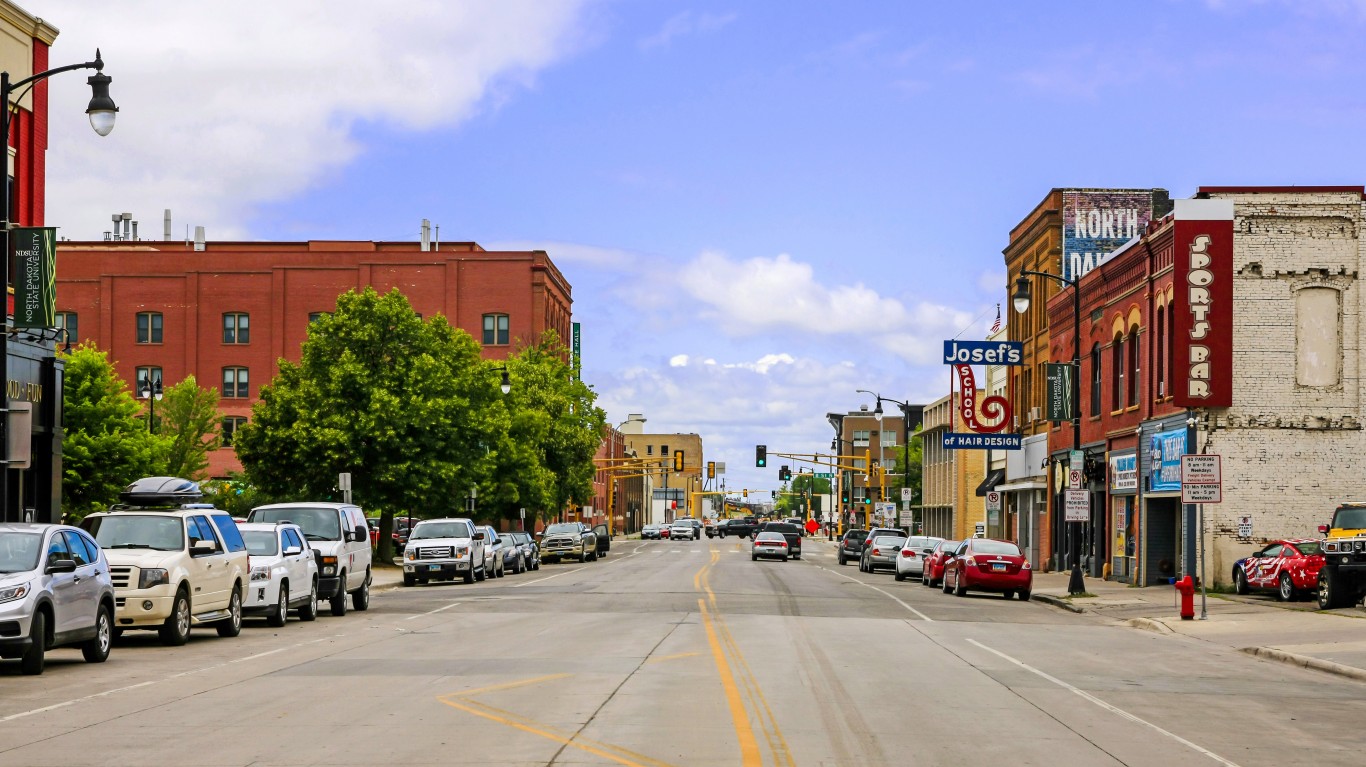
North Dakota
> Residents who are fully vaccinated as of July 20, 2021: 301,939 (39.7% of the pop.)
> Share of vaccine doses administered: 89.8%
> Cumulative COVID-19 cases as of July 20, 2021: 14,605 per 100,000 people (total: 111,008)
> Population: 760,077

Ohio
> Residents who are fully vaccinated as of July 20, 2021: 5,368,516 (45.9% of the pop.)
> Share of vaccine doses administered: 86.8%
> Cumulative COVID-19 cases as of July 20, 2021: 9,557 per 100,000 people (total: 1,117,109)
> Population: 11,689,442
These are all the counties in Ohio where COVID-19 is slowing (and where it’s still getting worse).

Oklahoma
> Residents who are fully vaccinated as of July 20, 2021: 1,566,238 (39.7% of the pop.)
> Share of vaccine doses administered: 82.7%
> Cumulative COVID-19 cases as of July 20, 2021: 11,803 per 100,000 people (total: 465,398)
> Population: 3,943,079

Oregon
> Residents who are fully vaccinated as of July 20, 2021: 2,334,446 (55.7% of the pop.)
> Share of vaccine doses administered: 82.0%
> Cumulative COVID-19 cases as of July 20, 2021: 5,059 per 100,000 people (total: 211,998)
> Population: 4,190,713
These are all the counties in Oregon where COVID-19 is slowing (and where it’s still getting worse).

Pennsylvania
> Residents who are fully vaccinated as of July 20, 2021: 6,575,932 (51.3% of the pop.)
> Share of vaccine doses administered: 89.5%
> Cumulative COVID-19 cases as of July 20, 2021: 9,499 per 100,000 people (total: 1,216,551)
> Population: 12,807,060

Rhode Island
> Residents who are fully vaccinated as of July 20, 2021: 641,930 (60.7% of the pop.)
> Share of vaccine doses administered: 85.1%
> Cumulative COVID-19 cases as of July 20, 2021: 14,468 per 100,000 people (total: 152,971)
> Population: 1,057,315

South Carolina
> Residents who are fully vaccinated as of July 20, 2021: 2,057,399 (40.5% of the pop.)
> Share of vaccine doses administered: 79.8%
> Cumulative COVID-19 cases as of July 20, 2021: 11,849 per 100,000 people (total: 602,412)
> Population: 5,084,127

South Dakota
> Residents who are fully vaccinated as of July 20, 2021: 409,951 (46.5% of the pop.)
> Share of vaccine doses administered: 85.7%
> Cumulative COVID-19 cases as of July 20, 2021: 14,140 per 100,000 people (total: 124,750)
> Population: 882,235

Tennessee
> Residents who are fully vaccinated as of July 20, 2021: 2,628,470 (38.8% of the pop.)
> Share of vaccine doses administered: 86.3%
> Cumulative COVID-19 cases as of July 20, 2021: 12,917 per 100,000 people (total: 874,499)
> Population: 6,770,010

Texas
> Residents who are fully vaccinated as of July 20, 2021: 12,456,699 (43.4% of the pop.)
> Share of vaccine doses administered: 82.0%
> Cumulative COVID-19 cases as of July 20, 2021: 10,554 per 100,000 people (total: 3,029,285)
> Population: 28,701,845
These are all the counties in Texas where COVID-19 is slowing (and where it’s still getting worse).

Utah
> Residents who are fully vaccinated as of July 20, 2021: 1,409,162 (44.6% of the pop.)
> Share of vaccine doses administered: 89.0%
> Cumulative COVID-19 cases as of July 20, 2021: 13,369 per 100,000 people (total: 422,619)
> Population: 3,161,105
These are all the counties in Utah where COVID-19 is slowing (and where it’s still getting worse).

Vermont
> Residents who are fully vaccinated as of July 20, 2021: 418,339 (66.8% of the pop.)
> Share of vaccine doses administered: 92.4%
> Cumulative COVID-19 cases as of July 20, 2021: 3,661 per 100,000 people (total: 22,929)
> Population: 626,299

Virginia
> Residents who are fully vaccinated as of July 20, 2021: 4,580,737 (53.8% of the pop.)
> Share of vaccine doses administered: 89.8%
> Cumulative COVID-19 cases as of July 20, 2021: 8,042 per 100,000 people (total: 684,956)
> Population: 8,517,685

Washington
> Residents who are fully vaccinated as of July 20, 2021: 4,320,331 (57.3% of the pop.)
> Share of vaccine doses administered: 92.5%
> Cumulative COVID-19 cases as of July 20, 2021: 6,105 per 100,000 people (total: 460,067)
> Population: 7,535,591

West Virginia
> Residents who are fully vaccinated as of July 20, 2021: 696,124 (38.5% of the pop.)
> Share of vaccine doses administered: 76.9%
> Cumulative COVID-19 cases as of July 20, 2021: 9,133 per 100,000 people (total: 164,933)
> Population: 1,805,832

Wisconsin
> Residents who are fully vaccinated as of July 20, 2021: 2,979,114 (51.2% of the pop.)
> Share of vaccine doses administered: 97.1%
> Cumulative COVID-19 cases as of July 20, 2021: 11,694 per 100,000 people (total: 679,826)
> Population: 5,813,568

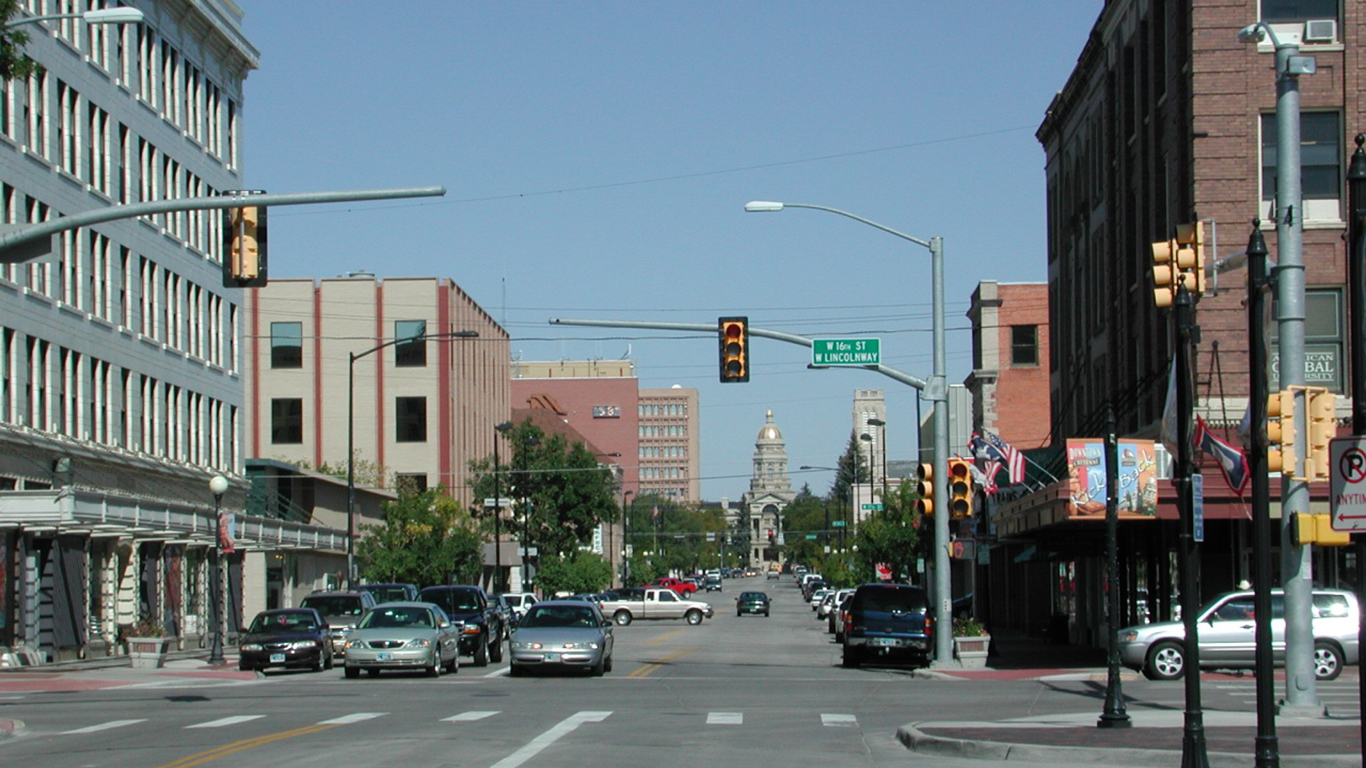
Wyoming
> Residents who are fully vaccinated as of July 20, 2021: 208,489 (36.1% of the pop.)
> Share of vaccine doses administered: 84.1%
> Cumulative COVID-19 cases as of July 20, 2021: 10,995 per 100,000 people (total: 63,523)
> Population: 577,737
Click here to see all coronavirus data for every state.
Are You Ahead, or Behind on Retirement? (sponsor)
If you’re one of the over 4 Million Americans set to retire this year, you may want to pay attention.
Finding a financial advisor who puts your interest first can be the difference between a rich retirement and barely getting by, and today it’s easier than ever. SmartAsset’s free tool matches you with up to three fiduciary financial advisors that serve your area in minutes. Each advisor has been carefully vetted, and must act in your best interests. Start your search now.
Don’t waste another minute; get started right here and help your retirement dreams become a retirement reality.
Thank you for reading! Have some feedback for us?
Contact the 24/7 Wall St. editorial team.
