The U.S. population growth rate hit its lowest level since the Great Depression, according to the 2020 U.S. Census. Over the past decade, the Great Recession and COVID-19 pandemic slowed immigration as well as caused many Americans to hold off on having kids.
Population growth did not stagnate everywhere in the U.S., however. In fact, in nearly every state at least one major metro area reported a faster population growth rate from 2010 to 2020 than the comparable national rate of 6.7%.
To determine the fastest growing city in each state, 24/7 Wall St. reviewed population data from the U.S. Census Bureau’s Population and Housing Estimates Program. Metropolitan areas were ranked based on total population change from 2010 to 2020.
While all but one state had at least one major metro area with a growing population over the past decade, the states with the biggest booming metro areas were primarily concentrated in the South and the West.
Still, there were 11 states where not a single metro area reported population growth even on par with the U.S. rate. Population growth in these cities was slower than the U.S. rate. Eight of those states were in the Northeast.
As a large share of the nation’s baby boomer generation hits retirement age, many in this age group are leaving colder areas up north in favor of warmer weather in the South and West. These areas often also have the added benefit of having relatively low costs of living. This is what it costs to retire in every state.
Click here to see the fastest growing city in each state.
To determine the fastest growing city in each state, 24/7 Wall St. reviewed population data from the U.S. Census Bureau’s Population and Housing Estimates Program. Metropolitan areas were ranked based on total population change from 2010 to 2020. Data on the components of population growth — births, deaths, international and domestic migration — also came from the PEP. Supplemental data on employment used to calculate employment growth from 2010 to 2020 came from the Bureau of Labor Statistics. Seasonally-adjusted unemployment rate for May 2021 also came from the BLS. Data on median household income came from the Census Bureau’s 2019 American Community Survey and are one-year estimates.

Alabama: Daphne-Fairhope-Foley, AL
> 2010-2020 pop. growth: 25.8% (state: 3.0%)
> May 2021 unemployment: 2.9% (state: 3.4%)
> 2010-2020 employment growth: 25.0% (state: 5.1%)
> Median household income: $56,439 (state: $51,734)
[in-text-ad]

Alaska: Anchorage, AK
> 2010-2020 pop. growth: 4.2% (state: 2.9%)
> May 2021 unemployment: 6.4% (state: 6.6%)
> 2010-2020 employment growth: -4.8% (state: -7.3%)
> Median household income: $80,676 (state: $75,463)

Arizona: Phoenix-Mesa-Chandler, AZ
> 2010-2020 pop. growth: 20.7% (state: 16.1%)
> May 2021 unemployment: 6.1% (state: 6.7%)
> 2010-2020 employment growth: 25.2% (state: 19.4%)
> Median household income: $67,896 (state: $62,055)

Arkansas: Fayetteville-Springdale-Rogers, AR
> 2010-2020 pop. growth: 24.7% (state: 3.9%)
> May 2021 unemployment: 3.4% (state: 4.4%)
> 2010-2020 employment growth: 30.7% (state: 6.8%)
> Median household income: $61,674 (state: $48,952)
[in-text-ad-2]

California: Stockton, CA
> 2010-2020 pop. growth: 12.1% (state: 5.7%)
> May 2021 unemployment: 8.7% (state: 7.7%)
> 2010-2020 employment growth: 26.0% (state: 13.0%)
> Median household income: $68,997 (state: $80,440)

Colorado: Greeley, CO
> 2010-2020 pop. growth: 32.1% (state: 15.5%)
> May 2021 unemployment: 6.6% (state: 6.2%)
> 2010-2020 employment growth: 34.6% (state: 19.1%)
> Median household income: $78,615 (state: $77,127)
[in-text-ad]

Connecticut: Bridgeport-Stamford-Norwalk, CT
> 2010-2020 pop. growth: 2.8% (state: -0.5%)
> May 2021 unemployment: 5.9% (state: 8.1%)
> 2010-2020 employment growth: -5.5% (state: -3.3%)
> Median household income: $97,053 (state: $78,833)

Delaware: Dover, DE
> 2010-2020 pop. growth: 13.1% (state: 9.9%)
> May 2021 unemployment: 6.6% (state: 5.9%)
> 2010-2020 employment growth: 4.2% (state: 6.2%)
> Median household income: $58,001 (state: $70,176)
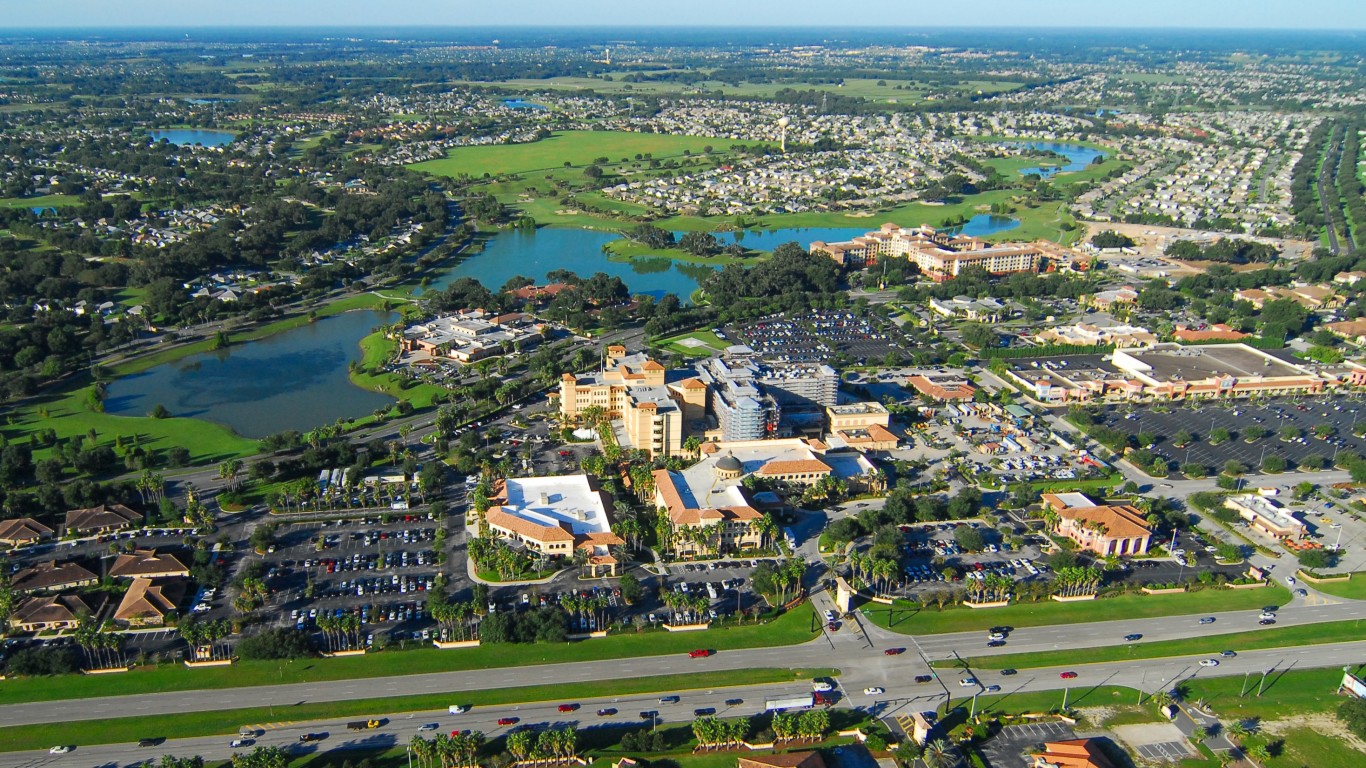
Florida: The Villages, FL
> 2010-2020 pop. growth: 48.8% (state: 15.6%)
> May 2021 unemployment: 6.6% (state: 4.9%)
> 2010-2020 employment growth: 50.0% (state: 18.4%)
> Median household income: $60,287 (state: $59,227)
[in-text-ad-2]

Georgia: Atlanta-Sandy Springs-Alpharetta, GA
> 2010-2020 pop. growth: 15.2% (state: 10.5%)
> May 2021 unemployment: 4.2% (state: 4.1%)
> 2010-2020 employment growth: 18.6% (state: 14.2%)
> Median household income: $71,742 (state: $61,980)

Hawaii: Kahului-Wailuku-Lahaina, HI
> 2010-2020 pop. growth: 8.4% (state: 3.4%)
> May 2021 unemployment: 11.3% (state: 8.0%)
> 2010-2020 employment growth: -7.5% (state: -5.3%)
> Median household income: $80,754 (state: $83,102)
[in-text-ad]

Idaho: Boise City, ID
> 2010-2020 pop. growth: 24.9% (state: 16.5%)
> May 2021 unemployment: 3.5% (state: 3.0%)
> 2010-2020 employment growth: 35.7% (state: 25.2%)
> Median household income: $66,466 (state: $60,999)

Illinois: Champaign-Urbana, IL
> 2010-2020 pop. growth: 3.6% (state: -1.9%)
> May 2021 unemployment: 4.4% (state: 7.1%)
> 2010-2020 employment growth: 4.5% (state: 1.4%)
> Median household income: $53,081 (state: $69,187)

Indiana: Lafayette-West Lafayette, IN
> 2010-2020 pop. growth: 10.9% (state: 4.2%)
> May 2021 unemployment: 4.0% (state: 4.0%)
> 2010-2020 employment growth: 7.5% (state: 6.7%)
> Median household income: $49,908 (state: $57,603)
[in-text-ad-2]

Iowa: Des Moines-West Des Moines, IA
> 2010-2020 pop. growth: 16.7% (state: 3.8%)
> May 2021 unemployment: 4.0% (state: 3.9%)
> 2010-2020 employment growth: 13.0% (state: 2.5%)
> Median household income: $71,164 (state: $61,691)

Kansas: Lawrence, KS
> 2010-2020 pop. growth: 10.6% (state: 2.1%)
> May 2021 unemployment: 3.6% (state: 3.5%)
> 2010-2020 employment growth: -3.6% (state: 2.1%)
> Median household income: $64,233 (state: $62,087)
[in-text-ad]

Kentucky: Bowling Green, KY
> 2010-2020 pop. growth: 14.0% (state: 3.2%)
> May 2021 unemployment: 3.9% (state: 4.5%)
> 2010-2020 employment growth: 9.3% (state: 4.3%)
> Median household income: $51,198 (state: $52,295)

Louisiana: Hammond, LA
> 2010-2020 pop. growth: 13.0% (state: 2.5%)
> May 2021 unemployment: 8.0% (state: 7.1%)
> 2010-2020 employment growth: 4.7% (state: -2.7%)
> Median household income: $47,825 (state: $51,073)

Maine: Portland-South Portland, ME
> 2010-2020 pop. growth: 5.7% (state: 1.6%)
> May 2021 unemployment: 3.9% (state: 4.8%)
> 2010-2020 employment growth: 5.4% (state: 0.5%)
> Median household income: $71,913 (state: $58,924)
[in-text-ad-2]

Maryland: Salisbury, MD-DE
> 2010-2020 pop. growth: 13.3% (state: 4.9%)
> May 2021 unemployment: 5.8% (state: 6.1%)
> 2010-2020 employment growth: 5.8% (state: 2.4%)
> Median household income: $61,283 (state: $86,738)

Massachusetts: Boston-Cambridge-Newton, MA-NH
> 2010-2020 pop. growth: 7.2% (state: 5.3%)
> May 2021 unemployment: 5.9% (state: 5.0%)
> 2010-2020 employment growth: 5.8% (state: 4.5%)
> Median household income: $94,430 (state: $85,843)
[in-text-ad]

Michigan: Grand Rapids-Kentwood, MI
> 2010-2020 pop. growth: 8.8% (state: 0.8%)
> May 2021 unemployment: 4.4% (state: 5.0%)
> 2010-2020 employment growth: 14.7% (state: 4.3%)
> Median household income: $65,739 (state: $59,584)

Minnesota: Minneapolis-St. Paul-Bloomington, MN-WI
> 2010-2020 pop. growth: 9.7% (state: 6.7%)
> May 2021 unemployment: 4.0% (state: 4.0%)
> 2010-2020 employment growth: 7.8% (state: 5.2%)
> Median household income: $83,698 (state: $74,593)

Mississippi: Gulfport-Biloxi, MS
> 2010-2020 pop. growth: 7.8% (state: 0.0%)
> May 2021 unemployment: 6.4% (state: 6.1%)
> 2010-2020 employment growth: -3.7% (state: 1.5%)
> Median household income: $50,642 (state: $45,792)
[in-text-ad-2]

Missouri: Columbia, MO
> 2010-2020 pop. growth: 10.3% (state: 2.7%)
> May 2021 unemployment: 3.0% (state: 4.2%)
> 2010-2020 employment growth: 6.9% (state: 3.9%)
> Median household income: $57,359 (state: $57,409)

Montana: Missoula, MT
> 2010-2020 pop. growth: 11.3% (state: 9.2%)
> May 2021 unemployment: 3.8% (state: 3.6%)
> 2010-2020 employment growth: 9.8% (state: 9.7%)
> Median household income: $57,347 (state: $57,153)
[in-text-ad]

Nebraska: Lincoln, NE
> 2010-2020 pop. growth: 11.8% (state: 6.1%)
> May 2021 unemployment: 2.3% (state: 2.6%)
> 2010-2020 employment growth: 7.4% (state: 4.7%)
> Median household income: $61,539 (state: $63,229)

Nevada: Las Vegas-Henderson-Paradise, NV
> 2010-2020 pop. growth: 18.7% (state: 16.2%)
> May 2021 unemployment: 8.9% (state: 7.8%)
> 2010-2020 employment growth: 13.1% (state: 14.0%)
> Median household income: $62,107 (state: $63,276)

New Hampshire: Manchester-Nashua, NH
> 2010-2020 pop. growth: 4.5% (state: 3.8%)
> May 2021 unemployment: 1.4% (state: 2.9%)
> 2010-2020 employment growth: 6.8% (state: 2.7%)
> Median household income: $83,626 (state: $77,933)
[in-text-ad-2]

New Jersey: Trenton-Princeton, NJ
> 2010-2020 pop. growth: -0.1% (state: 1.0%)
> May 2021 unemployment: 6.0% (state: 7.2%)
> 2010-2020 employment growth: 11.0% (state: 0.1%)
> Median household income: $79,492 (state: $85,751)
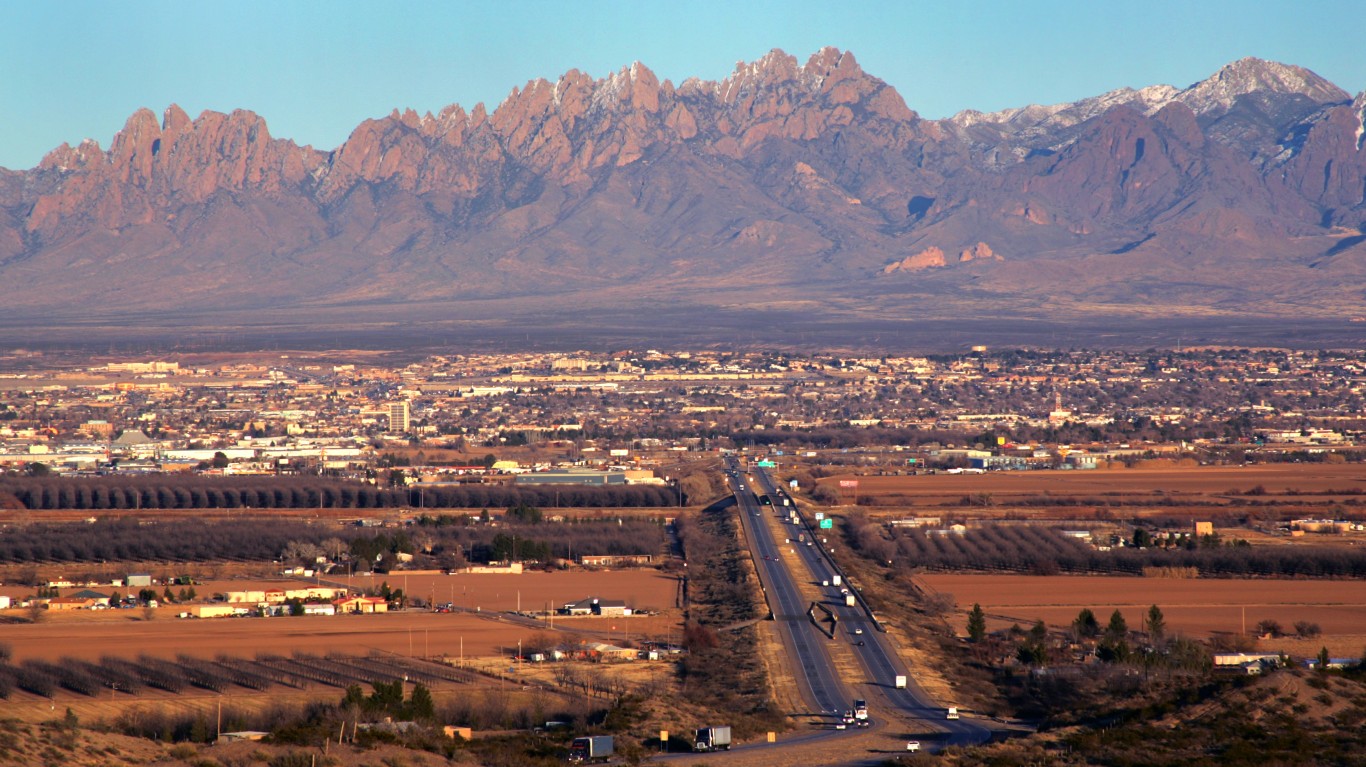
New Mexico: Las Cruces, NM
> 2010-2020 pop. growth: 5.8% (state: 2.3%)
> May 2021 unemployment: 7.6% (state: 7.9%)
> 2010-2020 employment growth: 1.3% (state: -0.6%)
> Median household income: $43,038 (state: $51,945)
[in-text-ad]

New York: Poughkeepsie-Newburgh-Middletown, NY
> 2010-2020 pop. growth: 1.2% (state: -0.2%)
> May 2021 unemployment: N/A (state: 7.8%)
> 2010-2020 employment growth: N/A (state: 2.7%)
> Median household income: $85,152 (state: $72,108)

North Carolina: Raleigh-Cary, NC
> 2010-2020 pop. growth: 25.6% (state: 11.2%)
> May 2021 unemployment: 3.8% (state: 4.8%)
> 2010-2020 employment growth: 25.6% (state: 13.3%)
> Median household income: $80,096 (state: $57,341)

North Dakota: Fargo, ND-MN
> 2010-2020 pop. growth: 19.1% (state: 13.8%)
> May 2021 unemployment: 3.2% (state: 4.0%)
> 2010-2020 employment growth: 14.8% (state: 9.3%)
> Median household income: $62,820 (state: $64,577)
[in-text-ad-2]

Ohio: Columbus, OH
> 2010-2020 pop. growth: 12.5% (state: 1.4%)
> May 2021 unemployment: 4.9% (state: 5.0%)
> 2010-2020 employment growth: 15.6% (state: 4.3%)
> Median household income: $67,207 (state: $58,642)

Oklahoma: Oklahoma City, OK
> 2010-2020 pop. growth: 13.8% (state: 6.1%)
> May 2021 unemployment: 3.8% (state: 3.9%)
> 2010-2020 employment growth: 10.8% (state: 4.2%)
> Median household income: $60,605 (state: $54,449)
[in-text-ad]

Oregon: Bend, OR
> 2010-2020 pop. growth: 27.9% (state: 10.7%)
> May 2021 unemployment: 6.2% (state: 5.8%)
> 2010-2020 employment growth: 35.4% (state: 13.7%)
> Median household income: $71,643 (state: $67,058)

Pennsylvania: Lebanon, PA
> 2010-2020 pop. growth: 6.0% (state: 0.6%)
> May 2021 unemployment: 5.6% (state: 7.0%)
> 2010-2020 employment growth: 1.8% (state: -0.3%)
> Median household income: $61,204 (state: $63,463)

Rhode Island: Providence-Warwick, RI-MA
> 2010-2020 pop. growth: 1.4% (state: 0.4%)
> May 2021 unemployment: 5.9% (state: 6.0%)
> 2010-2020 employment growth: 0.6% (state: -0.4%)
> Median household income: $70,967 (state: $71,169)
[in-text-ad-2]

South Carolina: Myrtle Beach-Conway-North Myrtle Beach, SC-NC
> 2010-2020 pop. growth: 36.6% (state: 12.8%)
> May 2021 unemployment: 5.4% (state: 4.6%)
> 2010-2020 employment growth: 15.0% (state: 14.8%)
> Median household income: $56,977 (state: $56,227)

South Dakota: Sioux Falls, SD
> 2010-2020 pop. growth: 19.8% (state: 9.6%)
> May 2021 unemployment: 2.7% (state: 2.8%)
> 2010-2020 employment growth: 17.1% (state: 5.7%)
> Median household income: $65,566 (state: $59,533)
[in-text-ad]

Tennessee: Nashville-Davidson–Murfreesboro–Franklin, TN
> 2010-2020 pop. growth: 19.1% (state: 8.5%)
> May 2021 unemployment: 4.3% (state: 5.0%)
> 2010-2020 employment growth: 31.0% (state: 14.5%)
> Median household income: $70,262 (state: $56,071)

Texas: Austin-Round Rock-Georgetown, TX
> 2010-2020 pop. growth: 33.7% (state: 16.8%)
> May 2021 unemployment: 4.7% (state: 6.6%)
> 2010-2020 employment growth: 38.3% (state: 18.2%)
> Median household income: $80,954 (state: $64,034)

Utah: St. George, UT
> 2010-2020 pop. growth: 33.9% (state: 17.6%)
> May 2021 unemployment: 2.8% (state: 2.7%)
> 2010-2020 employment growth: 54.7% (state: 29.6%)
> Median household income: $63,595 (state: $75,780)
[in-text-ad-2]

Vermont: Burlington-South Burlington, VT
> 2010-2020 pop. growth: 4.7% (state: -0.4%)
> May 2021 unemployment: 1.4% (state: 3.0%)
> 2010-2020 employment growth: 1.0% (state: -3.8%)
> Median household income: $74,909 (state: $63,001)

Virginia: Winchester, VA-WV
> 2010-2020 pop. growth: 10.6% (state: 7.4%)
> May 2021 unemployment: 3.6% (state: 4.5%)
> 2010-2020 employment growth: 18.7% (state: 5.7%)
> Median household income: $76,583 (state: $76,456)
[in-text-ad]

Washington: Kennewick-Richland, WA
> 2010-2020 pop. growth: 19.8% (state: 14.4%)
> May 2021 unemployment: 5.8% (state: 5.2%)
> 2010-2020 employment growth: 11.4% (state: 15.8%)
> Median household income: $68,283 (state: $78,687)

West Virginia: Morgantown, WV
> 2010-2020 pop. growth: 8.1% (state: -3.7%)
> May 2021 unemployment: 4.3% (state: 5.5%)
> 2010-2020 employment growth: 4.0% (state: -6.0%)
> Median household income: $56,395 (state: $48,850)

Wisconsin: Madison, WI
> 2010-2020 pop. growth: 10.7% (state: 2.6%)
> May 2021 unemployment: 3.2% (state: 3.9%)
> 2010-2020 employment growth: 8.6% (state: 3.4%)
> Median household income: $75,545 (state: $64,168)
[in-text-ad-2]

Wyoming: Cheyenne, WY
> 2010-2020 pop. growth: 9.5% (state: 3.3%)
> May 2021 unemployment: 4.9% (state: 5.4%)
> 2010-2020 employment growth: 6.7% (state: -4.0%)
> Median household income: $70,567 (state: $65,003)
Cash Back Credit Cards Have Never Been This Good
Credit card companies are at war, handing out free rewards and benefits to win the best customers. A good cash back card can be worth thousands of dollars a year in free money, not to mention other perks like travel, insurance, and access to fancy lounges. See our top picks for the best credit cards today. You won’t want to miss some of these offers.
Flywheel Publishing has partnered with CardRatings for our coverage of credit card products. Flywheel Publishing and CardRatings may receive a commission from card issuers.
Thank you for reading! Have some feedback for us?
Contact the 24/7 Wall St. editorial team.
 24/7 Wall St.
 24/7 Wall St.