Special Report
States That Had the Best Economic Security in 2020

Published:
Last Updated:

North Dakota was the state with the best economic security in the nation in 2020, according to a new report released this summer by digital health company Sharecare and the Boston University School of Public Health.
The report, based on more than 450,000 surveys across the U.S. last year, evaluates various dimensions of well-being. Well-being has emerged as an important concept in public policy in recent years because it can illustrate how people perceive their own lives — a measurement that is not always captured by the many indicators of living conditions. (Here is the worst city to live in every state.)
24/7 Wall St. concentrated on Sharecare’s economic security measure — one of several sets of measures used in the overall ranking. The level of economic security is based on figures from publicly available datasets. The states in our slideshow are ordered from worst to best economic security. We included for each state: median household income, poverty rate, and the percentage of the population without health insurance from the U.S. Census Bureau’s 2019 American Community Survey.
Click here to see the states that had the best economic security in 2020.

50. West Virginia
> Economic security score: 43.49
> Median household income: $48,850 — 2nd lowest
> Poverty rate: 16.0% — 6th highest
> Population without health insurance: 6.7% — 18th lowest
> Overall well-being score: 63.53 — 12th lowest
[in-text-ad]

49. New Mexico
> Economic security score: 43.80
> Median household income: $51,945 — 6th lowest
> Poverty rate: 18.2% — 3rd highest
> Population without health insurance: 10.0% — 16th highest
> Overall well-being score: 61.37 — 2nd lowest
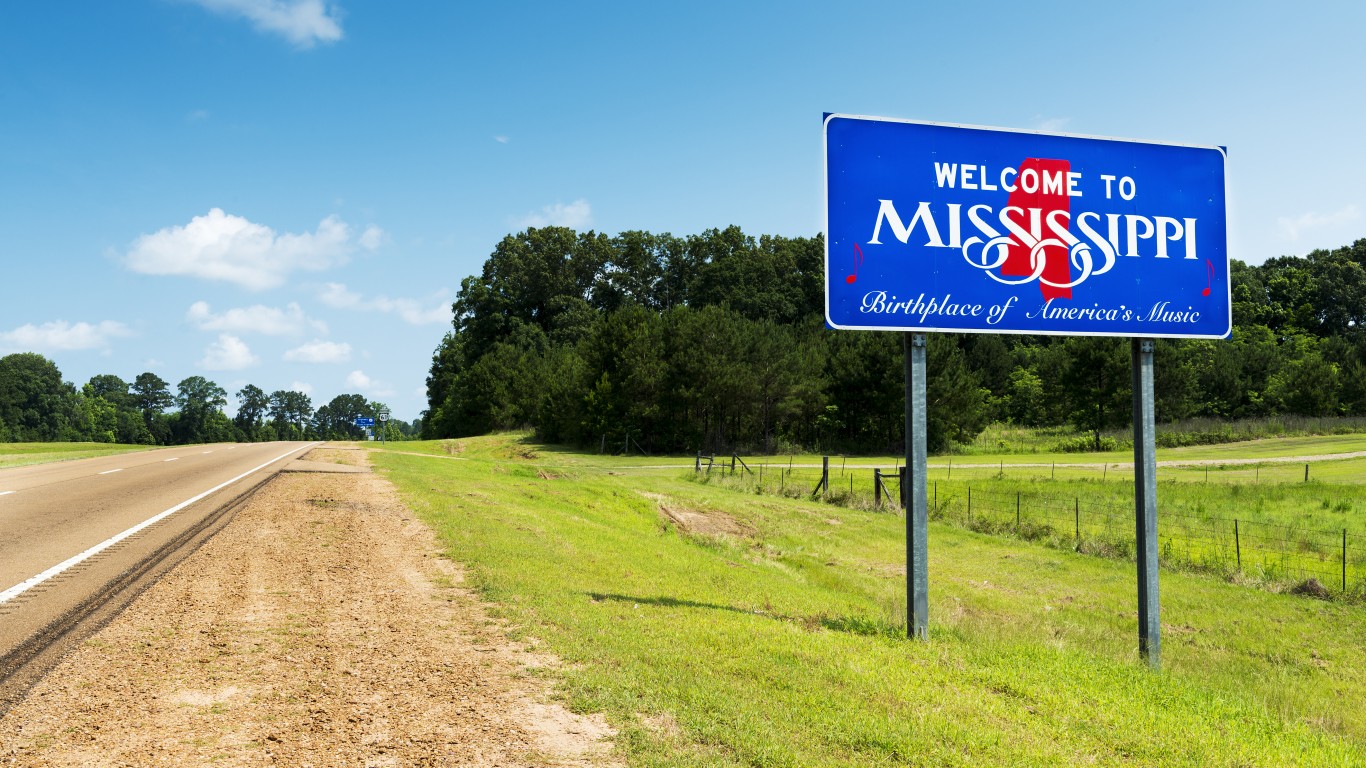
48. Mississippi
> Economic security score: 45.82
> Median household income: $45,792 — the lowest
> Poverty rate: 19.6% — the highest
> Population without health insurance: 13.0% — 5th highest
> Overall well-being score: 61.29 — the lowest

47. Kentucky
> Economic security score: 46.55
> Median household income: $52,295 — 7th lowest
> Poverty rate: 16.3% — 4th highest
> Population without health insurance: 6.4% — 14th lowest
> Overall well-being score: 62.32 — 3rd lowest
[in-text-ad-2]

46. Louisiana
> Economic security score: 47.42
> Median household income: $51,073 — 4th lowest
> Poverty rate: 19.0% — 2nd highest
> Population without health insurance: 8.9% — 21st highest
> Overall well-being score: 62.36 — 5th lowest

45. Arkansas
> Economic security score: 48.01
> Median household income: $48,952 — 3rd lowest
> Poverty rate: 16.2% — 5th highest
> Population without health insurance: 9.1% — 20th highest
> Overall well-being score: 62.37 — 6th lowest
[in-text-ad]

44. Arizona
> Economic security score: 48.87
> Median household income: $62,055 — 23rd lowest
> Poverty rate: 13.5% — 13th highest
> Population without health insurance: 11.3% — 9th highest
> Overall well-being score: 64.05 — 24th lowest

43. Alabama
> Economic security score: 48.88
> Median household income: $51,734 — 5th lowest
> Poverty rate: 15.5% — 7th highest
> Population without health insurance: 9.7% — 17th highest
> Overall well-being score: 63.72 — 15th lowest

42. Michigan
> Economic security score: 49.81
> Median household income: $59,584 — 19th lowest
> Poverty rate: 13.0% — 17th highest
> Population without health insurance: 5.8% — 10th lowest
> Overall well-being score: 64.01 — 21st lowest
[in-text-ad-2]

41. California
> Economic security score: 50.22
> Median household income: $80,440 — 5th highest
> Poverty rate: 11.8% — 25th highest
> Population without health insurance: 7.7% — 22nd lowest
> Overall well-being score: 64.77 — 14th highest

40. New York
> Economic security score: 50.28
> Median household income: $72,108 — 14th highest
> Poverty rate: 13.0% — 16th highest
> Population without health insurance: 5.2% — 7th lowest
> Overall well-being score: 64.70 — 16th highest
[in-text-ad]

39. Oregon
> Economic security score: 50.40
> Median household income: $67,058 — 18th highest
> Poverty rate: 11.4% — 23rd lowest
> Population without health insurance: 7.2% — 20th lowest
> Overall well-being score: 64.42 — 21st highest

38. South Carolina
> Economic security score: 50.54
> Median household income: $56,227 — 10th lowest
> Poverty rate: 13.8% — 10th highest
> Population without health insurance: 10.8% — 11th highest
> Overall well-being score: 64.11 — 25th lowest

37. Tennessee
> Economic security score: 50.76
> Median household income: $56,071 — 9th lowest
> Poverty rate: 13.9% — 9th highest
> Population without health insurance: 10.1% — 14th highest
> Overall well-being score: 63.02 — 7th lowest
[in-text-ad-2]

36. Florida
> Economic security score: 51.15
> Median household income: $59,227 — 17th lowest
> Poverty rate: 12.7% — 19th highest
> Population without health insurance: 13.2% — 4th highest
> Overall well-being score: 63.98 — 20th lowest
35. Ohio
> Economic security score: 51.54
> Median household income: $58,642 — 15th lowest
> Poverty rate: 13.1% — 15th highest
> Population without health insurance: 6.6% — 16th lowest
> Overall well-being score: 64.22 — 23rd highest
[in-text-ad]

34. Nevada
> Economic security score: 52.00
> Median household income: $63,276 — 24th highest
> Poverty rate: 12.5% — 21st highest
> Population without health insurance: 11.4% — 8th highest
> Overall well-being score: 63.81 — 17th lowest

33. Rhode Island
> Economic security score: 52.04
> Median household income: $71,169 — 15th highest
> Poverty rate: 10.8% — 18th lowest
> Population without health insurance: 4.1% — 2nd lowest
> Overall well-being score: 64.11 — 25th highest

32. North Carolina
> Economic security score: 52.21
> Median household income: $57,341 — 12th lowest
> Poverty rate: 13.6% — 12th highest
> Population without health insurance: 11.3% — 10th highest
> Overall well-being score: 64.02 — 22nd lowest
[in-text-ad-2]

31. Delaware
> Economic security score: 52.48
> Median household income: $70,176 — 16th highest
> Poverty rate: 11.3% — 22nd lowest
> Population without health insurance: 6.6% — 15th lowest
> Overall well-being score: 64.86 — 12th highest

30. Georgia
> Economic security score: 52.68
> Median household income: $61,980 — 22nd lowest
> Poverty rate: 13.3% — 14th highest
> Population without health insurance: 13.4% — 3rd highest
> Overall well-being score: 64.50 — 20th highest
[in-text-ad]

29. Oklahoma
> Economic security score: 52.71
> Median household income: $54,449 — 8th lowest
> Poverty rate: 15.2% — 8th highest
> Population without health insurance: 14.3% — 2nd highest
> Overall well-being score: 62.36 — 4th lowest
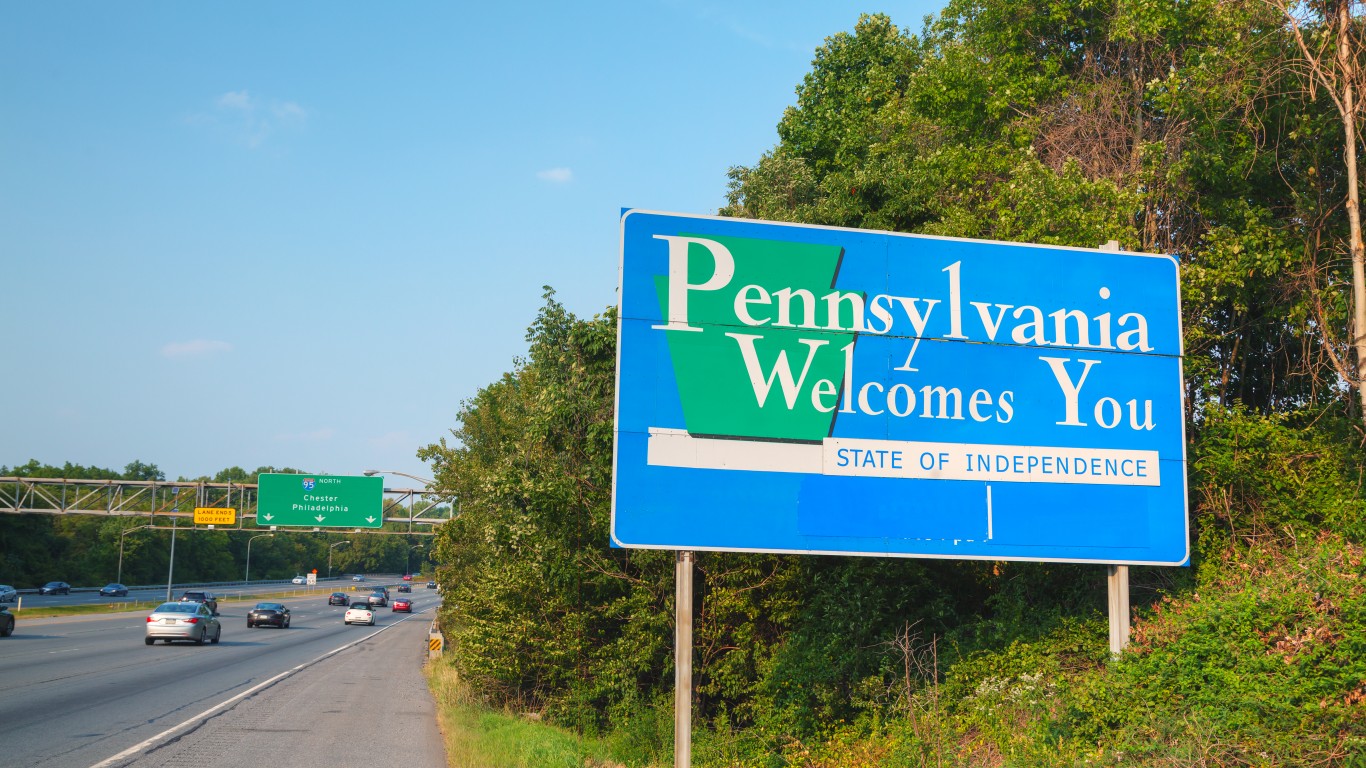
28. Pennsylvania
> Economic security score: 52.91
> Median household income: $63,463 — 23rd highest
> Poverty rate: 12.0% — 22nd highest
> Population without health insurance: 5.8% — 9th lowest
> Overall well-being score: 64.70 — 15th highest

27. Illinois
> Economic security score: 53.12
> Median household income: $69,187 — 17th highest
> Poverty rate: 11.5% — 25th lowest
> Population without health insurance: 7.4% — 21st lowest
> Overall well-being score: 64.64 — 17th highest
[in-text-ad-2]

26. Indiana
> Economic security score: 53.68
> Median household income: $57,603 — 14th lowest
> Poverty rate: 11.9% — 24th highest
> Population without health insurance: 8.7% — 22nd highest
> Overall well-being score: 63.69 — 14th lowest

25. Vermont
> Economic security score: 53.79
> Median household income: $63,001 — 25th lowest
> Poverty rate: 10.2% — 15th lowest
> Population without health insurance: 4.5% — 4th lowest
> Overall well-being score: 63.27 — 8th lowest
[in-text-ad]

24. Washington
> Economic security score: 53.84
> Median household income: $78,687 — 7th highest
> Poverty rate: 9.8% — 9th lowest
> Population without health insurance: 6.6% — 17th lowest
> Overall well-being score: 65.24 — 9th highest

23. Maine
> Economic security score: 53.84
> Median household income: $58,924 — 16th lowest
> Poverty rate: 10.9% — 19th lowest
> Population without health insurance: 8.0% — 25th highest
> Overall well-being score: 64.52 — 19th highest

22. Alaska
> Economic security score: 53.92
> Median household income: $75,463 — 12th highest
> Poverty rate: 10.1% — 13th lowest
> Population without health insurance: 12.2% — 7th highest
> Overall well-being score: 64.78 — 13th highest
[in-text-ad-2]

21. Massachusetts
> Economic security score: 53.99
> Median household income: $85,843 — 2nd highest
> Poverty rate: 9.4% — 8th lowest
> Population without health insurance: 3.0% — the lowest
> Overall well-being score: 65.59 — 5th highest

20. Missouri
> Economic security score: 54.08
> Median household income: $57,409 — 13th lowest
> Poverty rate: 12.9% — 18th highest
> Population without health insurance: 10.0% — 15th highest
> Overall well-being score: 63.77 — 16th lowest
[in-text-ad]

19. Montana
> Economic security score: 54.12
> Median household income: $57,153 — 11th lowest
> Poverty rate: 12.6% — 20th highest
> Population without health insurance: 8.3% — 24th highest
> Overall well-being score: 63.34 — 9th lowest

18. Connecticut
> Economic security score: 54.30
> Median household income: $78,833 — 6th highest
> Poverty rate: 10.0% — 12th lowest
> Population without health insurance: 5.9% — 11th lowest
> Overall well-being score: 65.40 — 7th highest

17. Texas
> Economic security score: 54.79
> Median household income: $64,034 — 22nd highest
> Poverty rate: 13.6% — 11th highest
> Population without health insurance: 18.4% — the highest
> Overall well-being score: 63.43 — 11th lowest
[in-text-ad-2]

16. Idaho
> Economic security score: 54.98
> Median household income: $60,999 — 20th lowest
> Poverty rate: 11.2% — 21st lowest
> Population without health insurance: 10.8% — 12th highest
> Overall well-being score: 63.35 — 10th lowest

15. New Jersey
> Economic security score: 55.38
> Median household income: $85,751 — 3rd highest
> Poverty rate: 9.2% — 5th lowest
> Population without health insurance: 7.9% — 23rd lowest
> Overall well-being score: 65.80 — 3rd highest
[in-text-ad]

14. Hawaii
> Economic security score: 55.94
> Median household income: $83,102 — 4th highest
> Poverty rate: 9.3% — 6th lowest
> Population without health insurance: 4.2% — 3rd lowest
> Overall well-being score: 66.40 — the highest

13. Maryland
> Economic security score: 56.25
> Median household income: $86,738 — the highest
> Poverty rate: 9.0% — 4th lowest
> Population without health insurance: 6.0% — 12th lowest
> Overall well-being score: 66.09 — 2nd highest

12. Colorado
> Economic security score: 56.33
> Median household income: $77,127 — 9th highest
> Poverty rate: 9.3% — 7th lowest
> Population without health insurance: 8.0% — 25th lowest
> Overall well-being score: 65.08 — 10th highest
[in-text-ad-2]

11. Wisconsin
> Economic security score: 56.49
> Median household income: $64,168 — 21st highest
> Poverty rate: 10.4% — 16th lowest
> Population without health insurance: 5.7% — 8th lowest
> Overall well-being score: 64.55 — 18th highest

10. Iowa
> Economic security score: 56.85
> Median household income: $61,691 — 21st lowest
> Poverty rate: 11.2% — 20th lowest
> Population without health insurance: 5.0% — 6th lowest
> Overall well-being score: 63.91 — 18th lowest
[in-text-ad]

9. Virginia
> Economic security score: 57.12
> Median household income: $76,456 — 10th highest
> Poverty rate: 9.9% — 11th lowest
> Population without health insurance: 7.9% — 24th lowest
> Overall well-being score: 65.27 — 8th highest

8. Kansas
> Economic security score: 57.49
> Median household income: $62,087 — 24th lowest
> Poverty rate: 11.4% — 24th lowest
> Population without health insurance: 9.2% — 19th highest
> Overall well-being score: 64.36 — 22nd highest

7. Minnesota
> Economic security score: 57.76
> Median household income: $74,593 — 13th highest
> Poverty rate: 9.0% — 3rd lowest
> Population without health insurance: 4.9% — 5th lowest
> Overall well-being score: 65.65 — 4th highest
[in-text-ad-2]

6. South Dakota
> Economic security score: 57.95
> Median household income: $59,533 — 18th lowest
> Poverty rate: 11.9% — 23rd highest
> Population without health insurance: 10.2% — 13th highest
> Overall well-being score: 63.96 — 19th lowest

5. Wyoming
> Economic security score: 57.98
> Median household income: $65,003 — 19th highest
> Poverty rate: 10.1% — 14th lowest
> Population without health insurance: 12.3% — 6th highest
> Overall well-being score: 63.69 — 13th lowest
[in-text-ad]

4. New Hampshire
> Economic security score: 59.21
> Median household income: $77,933 — 8th highest
> Poverty rate: 7.3% — the lowest
> Population without health insurance: 6.3% — 13th lowest
> Overall well-being score: 65.58 — 6th highest

3. Utah
> Economic security score: 59.86
> Median household income: $75,780 — 11th highest
> Poverty rate: 8.9% — 2nd lowest
> Population without health insurance: 9.7% — 18th highest
> Overall well-being score: 64.99 — 11th highest

2. Nebraska
> Economic security score: 59.92
> Median household income: $63,229 — 25th highest
> Poverty rate: 9.9% — 10th lowest
> Population without health insurance: 8.3% — 23rd highest
> Overall well-being score: 64.04 — 23rd lowest
[in-text-ad-2]

1. North Dakota
> Economic security score: 60.43
> Median household income: $64,577 — 20th highest
> Poverty rate: 10.6% — 17th lowest
> Population without health insurance: 6.9% — 19th lowest
> Overall well-being score: 64.13 — 24th highest
If you’re one of the over 4 Million Americans set to retire this year, you may want to pay attention. Many people have worked their whole lives preparing to retire without ever knowing the answer to the most important question: am I ahead, or behind on my goals?
Don’t make the same mistake. It’s an easy question to answer. A quick conversation with a financial advisor can help you unpack your savings, spending, and goals for your money. With Zoe Financial’s free matching tool, you can connect with trusted financial advisors in minutes.
Why wait? Click here to get started today!
Thank you for reading! Have some feedback for us?
Contact the 24/7 Wall St. editorial team.