
The share of adults nationwide who meet or exceed federal exercise guidelines — 150 minutes of moderate aerobic exercise or 75 minutes of vigorous physical activity a week — is on the rise. Nearly a quarter of adult Americans met the requirements in 2017, compared to just over 18% a decade earlier, according to the Centers for Disease Control and Prevention. The news is encouraging, and residents of several cities are leading the pack.
24/7 Tempo reviewed data on physical activity in all 382 metro areas in the U.S. from the 2021 report by the County Health Rankings & Roadmaps, a collaboration between the Robert Wood Johnson Foundation and the University of Wisconsin Population Health Institute, to determine the cities with the highest shares of people exercising on a regular basis. About 77.3% of adult Americans report they are physically active in their leisure time.
There is one emerging trend. Metropolitan areas in Western states have relatively higher shares of adults who report regular leisure-time physical activity. Such activity includes working out and other activities people engage in outside of work and in their free time.
Fourteen of the 20 cities where the highest shares of adults exercise are either in California, Oregon, Washington, and Colorado. In contrast, many cities where the lowest percentage of adults are physically active are in the South.
Even little time spent exercising is better than none. The share of adult residents who are overweight or obese is notably higher in metropolitan areas where people are less active. In only five of the 50 most active cities, the adult obesity rate is higher than the national rate of 29.7%.
In cities where the highest share of adults exercise regularly, residents also tend to feel healthier. Of the 50 cities on this list, just 11 cities have a higher share of adults reporting being in poor or fair health than the 16.5% of adults nationwide who do. The opposite tends to be true in cities where a higher share of adults who don’t exercise.
Income also may be a factor in whether people spend time working out. Wealthier people are more likely to exercise perhaps because they can afford gym memberships and working out apparel. Of the 50 cities where the highest share of people are physically active, only 16 have a median household income below the national median of over $65,000.
One of the most accessible exercises, which also happens to be completely free — is walking. It’s easy to forget that walking is actually an aerobic activity — here are 30 reasons why walking is the best exercise.
Click here to see the 50 most physically active cities in America
To determine the most active cities in the U.S, 24/7 Tempo reviewed the most recent 2021 dataset collected by County Health Rankings & Roadmaps, a collaboration between the Robert Wood Johnson Foundation and the University of Wisconsin Population Health Institute. All 382 U.S. metro areas were considered.
Obesity rates — the share of adult residents who report a body mass index of 30 or greater — as well as prevalence of diabetes, access to places for physical activities such as gyms, share of adult population who report being in poor or fair health, and the number of physically unhealthy days a month on average also came from 2021 CHR.
Population figures, as well as median household income came from the Census Bureau’s American Community Survey 2019 1-Year Estimates.

50. Minneapolis-St. Paul-Bloomington, Minnesota
> Adults who exercise regularly: 82.4% (US rate: 77.3%)
> Pop. with access to places for physical activity: 94.8% — No. 27 out of 382 metro areas (US rate: 84.2%)
> Adult obesity rate: 27.1% — No. 322 out of 382 metro areas (US rate: 29.7%)
> Pop. over 20 with diabetes: 7.8% — No. 352 out of 382 metro areas (US rate: 10.5%)
> Adults in poor or fair health: 12.0% — No. 377 out of 382 metro areas (US rate: 16.5%)
> Physically unhealthy days: 3.2 a month — No. 372 out of 382 metro areas (US avg: 3.7 a month)
> Median household income: $83,698 — No. 18 out of 382 metro areas (US median: $65,712)
[in-text-ad]

49. Napa, California
> Adults who exercise regularly: 82.4% (US rate: 77.3%)
> Pop. with access to places for physical activity: 89.8% — No. 71 out of 382 metro areas (US rate: 84.2%)
> Adult obesity rate: 24.1% — No. 358 out of 382 metro areas (US rate: 29.7%)
> Pop. over 20 with diabetes: 9.8% — No. 261 out of 382 metro areas (US rate: 10.5%)
> Adults in poor or fair health: 15.9% — No. 298 out of 382 metro areas (US rate: 16.5%)
> Physically unhealthy days: 3.7 a month — No. 314 out of 382 metro areas (US avg: 3.7 a month)
> Median household income: $92,769 — No. 7 out of 382 metro areas (US median: $65,712)
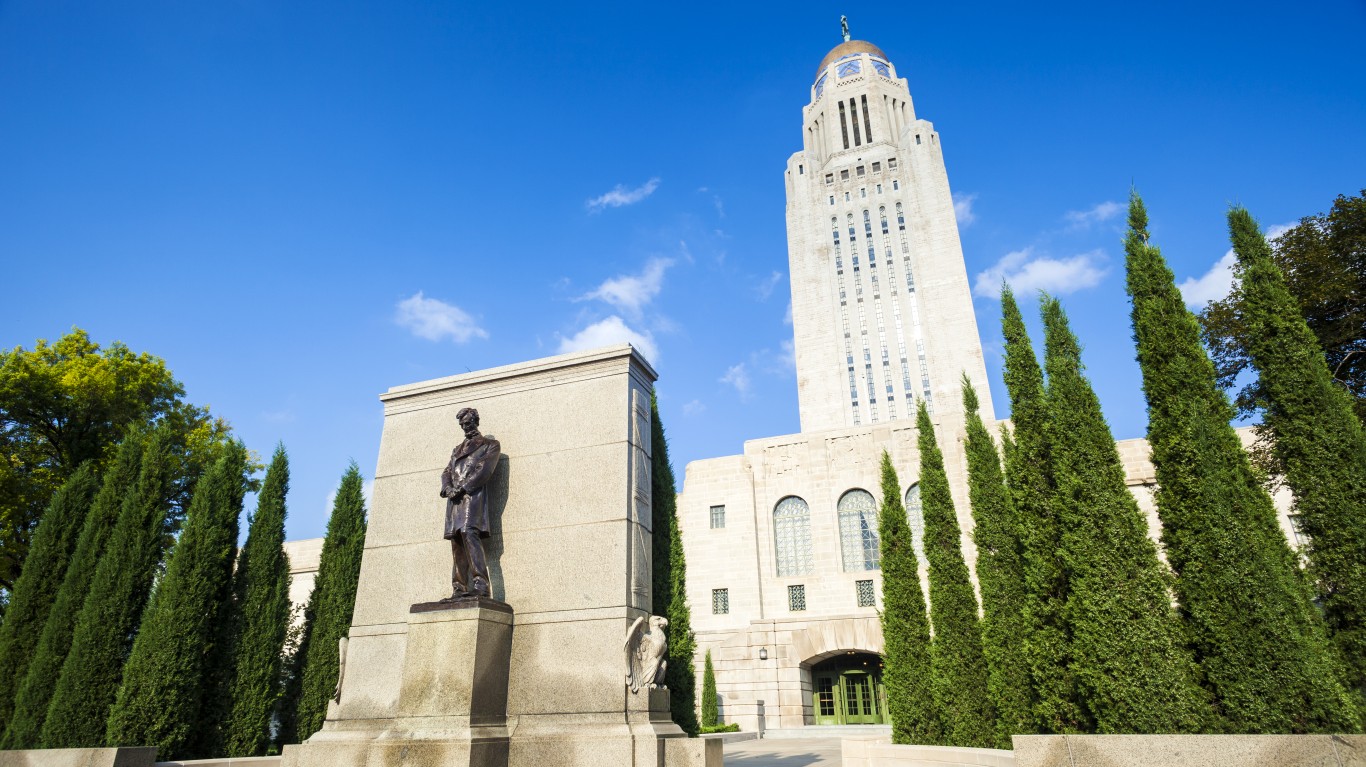
48. Lincoln, Nebraska
> Adults who exercise regularly: 82.4% (US rate: 77.3%)
> Pop. with access to places for physical activity: 94.8% — No. 28 out of 382 metro areas (US rate: 84.2%)
> Adult obesity rate: 30.0% — No. 261 out of 382 metro areas (US rate: 29.7%)
> Pop. over 20 with diabetes: 8.2% — No. 340 out of 382 metro areas (US rate: 10.5%)
> Adults in poor or fair health: 12.5% — No. 373 out of 382 metro areas (US rate: 16.5%)
> Physically unhealthy days: 3.1 a month — No. 374 out of 382 metro areas (US avg: 3.7 a month)
> Median household income: $61,539 — No. 150 out of 382 metro areas (US median: $65,712)

47. Raleigh-Cary, North Carolina
> Adults who exercise regularly: 82.5% (US rate: 77.3%)
> Pop. with access to places for physical activity: 85.5% — No. 125 out of 382 metro areas (US rate: 84.2%)
> Adult obesity rate: 29.3% — No. 276 out of 382 metro areas (US rate: 29.7%)
> Pop. over 20 with diabetes: 9.3% — No. 289 out of 382 metro areas (US rate: 10.5%)
> Adults in poor or fair health: 14.9% — No. 330 out of 382 metro areas (US rate: 16.5%)
> Physically unhealthy days: 3.4 a month — No. 361 out of 382 metro areas (US avg: 3.7 a month)
> Median household income: $80,096 — No. 27 out of 382 metro areas (US median: $65,712)
[in-text-ad-2]
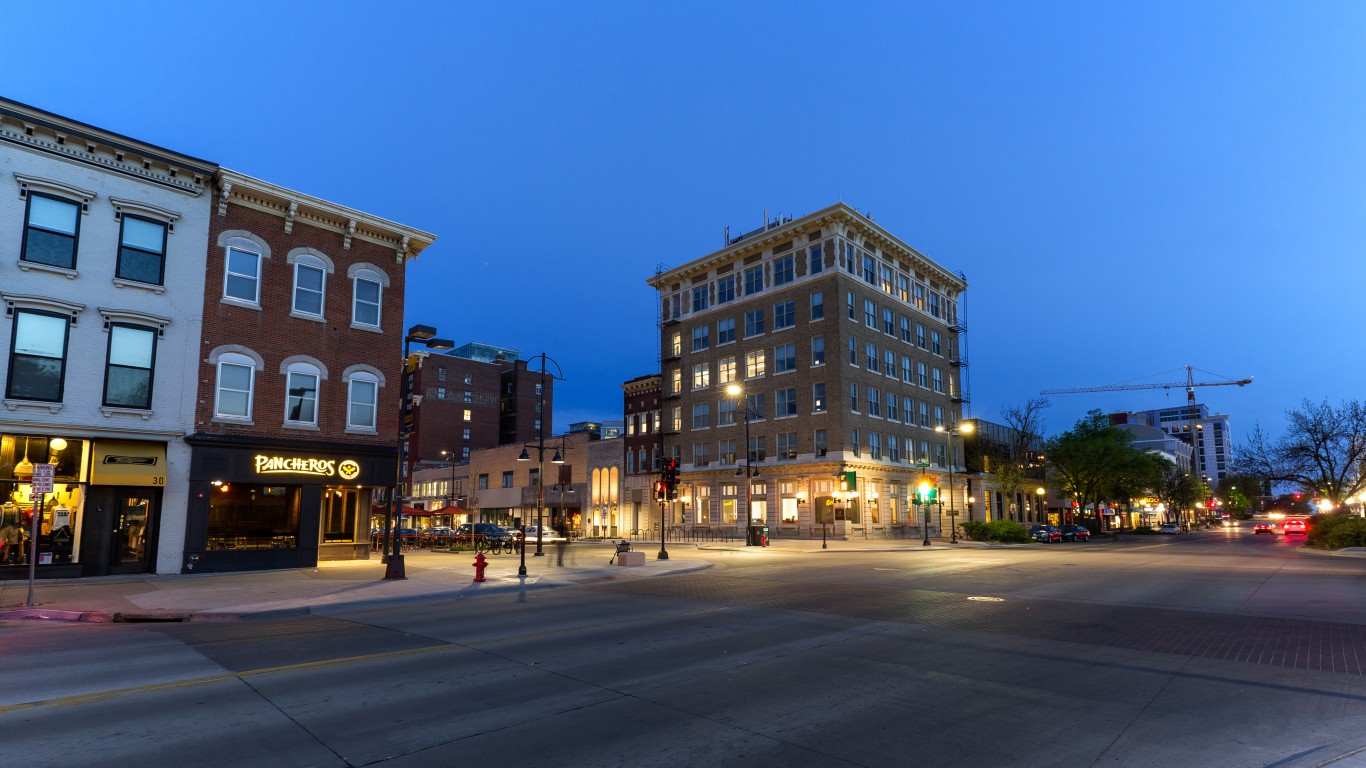
46. Iowa City, Iowa
> Adults who exercise regularly: 82.6% (US rate: 77.3%)
> Pop. with access to places for physical activity: 91.1% — No. 56 out of 382 metro areas (US rate: 84.2%)
> Adult obesity rate: 27.7% — No. 315 out of 382 metro areas (US rate: 29.7%)
> Pop. over 20 with diabetes: 7.0% — No. 367 out of 382 metro areas (US rate: 10.5%)
> Adults in poor or fair health: 12.9% — No. 369 out of 382 metro areas (US rate: 16.5%)
> Physically unhealthy days: 3.1 a month — No. 376 out of 382 metro areas (US avg: 3.7 a month)
> Median household income: $63,761 — No. 118 out of 382 metro areas (US median: $65,712)

45. Portland-South Portland, Maine
> Adults who exercise regularly: 82.6% (US rate: 77.3%)
> Pop. with access to places for physical activity: 81.4% — No. 184 out of 382 metro areas (US rate: 84.2%)
> Adult obesity rate: 25.9% — No. 340 out of 382 metro areas (US rate: 29.7%)
> Pop. over 20 with diabetes: 8.9% — No. 313 out of 382 metro areas (US rate: 10.5%)
> Adults in poor or fair health: 13.2% — No. 364 out of 382 metro areas (US rate: 16.5%)
> Physically unhealthy days: 3.4 a month — No. 359 out of 382 metro areas (US avg: 3.7 a month)
> Median household income: $71,913 — No. 59 out of 382 metro areas (US median: $65,712)
[in-text-ad]

44. St. George, Utah
> Adults who exercise regularly: 82.6% (US rate: 77.3%)
> Pop. with access to places for physical activity: 81.4% — No. 185 out of 382 metro areas (US rate: 84.2%)
> Adult obesity rate: 24.0% — No. 360 out of 382 metro areas (US rate: 29.7%)
> Pop. over 20 with diabetes: 8.6% — No. 328 out of 382 metro areas (US rate: 10.5%)
> Adults in poor or fair health: 15.9% — No. 300 out of 382 metro areas (US rate: 16.5%)
> Physically unhealthy days: 4.0 a month — No. 263 out of 382 metro areas (US avg: 3.7 a month)
> Median household income: $63,595 — No. 120 out of 382 metro areas (US median: $65,712)

43. Bremerton-Silverdale-Port Orchard, Washington
> Adults who exercise regularly: 82.7% (US rate: 77.3%)
> Pop. with access to places for physical activity: 85.2% — No. 129 out of 382 metro areas (US rate: 84.2%)
> Adult obesity rate: 30.2% — No. 253 out of 382 metro areas (US rate: 29.7%)
> Pop. over 20 with diabetes: 8.9% — No. 314 out of 382 metro areas (US rate: 10.5%)
> Adults in poor or fair health: 15.2% — No. 321 out of 382 metro areas (US rate: 16.5%)
> Physically unhealthy days: 4.1 a month — No. 210 out of 382 metro areas (US avg: 3.7 a month)
> Median household income: $79,624 — No. 28 out of 382 metro areas (US median: $65,712)

42. Bridgeport-Stamford-Norwalk, Connecticut
> Adults who exercise regularly: 82.7% (US rate: 77.3%)
> Pop. with access to places for physical activity: 96.8% — No. 13 out of 382 metro areas (US rate: 84.2%)
> Adult obesity rate: 21.2% — No. 375 out of 382 metro areas (US rate: 29.7%)
> Pop. over 20 with diabetes: 7.3% — No. 360 out of 382 metro areas (US rate: 10.5%)
> Adults in poor or fair health: 11.9% — No. 378 out of 382 metro areas (US rate: 16.5%)
> Physically unhealthy days: 3.2 a month — No. 369 out of 382 metro areas (US avg: 3.7 a month)
> Median household income: $97,053 — No. 4 out of 382 metro areas (US median: $65,712)
[in-text-ad-2]

41. Ogden-Clearfield, Utah
> Adults who exercise regularly: 82.7% (US rate: 77.3%)
> Pop. with access to places for physical activity: 89.4% — No. 75 out of 382 metro areas (US rate: 84.2%)
> Adult obesity rate: 29.2% — No. 283 out of 382 metro areas (US rate: 29.7%)
> Pop. over 20 with diabetes: 8.4% — No. 336 out of 382 metro areas (US rate: 10.5%)
> Adults in poor or fair health: 14.1% — No. 347 out of 382 metro areas (US rate: 16.5%)
> Physically unhealthy days: 3.7 a month — No. 312 out of 382 metro areas (US avg: 3.7 a month)
> Median household income: $79,251 — No. 30 out of 382 metro areas (US median: $65,712)

40. Barnstable Town, Massachusetts
> Adults who exercise regularly: 82.8% (US rate: 77.3%)
> Pop. with access to places for physical activity: 91.6% — No. 50 out of 382 metro areas (US rate: 84.2%)
> Adult obesity rate: 22.5% — No. 368 out of 382 metro areas (US rate: 29.7%)
> Pop. over 20 with diabetes: 10.1% — No. 238 out of 382 metro areas (US rate: 10.5%)
> Adults in poor or fair health: 12.7% — No. 371 out of 382 metro areas (US rate: 16.5%)
> Physically unhealthy days: 3.4 a month — No. 355 out of 382 metro areas (US avg: 3.7 a month)
> Median household income: $85,042 — No. 16 out of 382 metro areas (US median: $65,712)
[in-text-ad]

39. Austin-Round Rock-Georgetown, Texas
> Adults who exercise regularly: 82.9% (US rate: 77.3%)
> Pop. with access to places for physical activity: 87.1% — No. 102 out of 382 metro areas (US rate: 84.2%)
> Adult obesity rate: 26.9% — No. 327 out of 382 metro areas (US rate: 29.7%)
> Pop. over 20 with diabetes: 7.9% — No. 350 out of 382 metro areas (US rate: 10.5%)
> Adults in poor or fair health: 16.3% — No. 284 out of 382 metro areas (US rate: 16.5%)
> Physically unhealthy days: 3.5 a month — No. 344 out of 382 metro areas (US avg: 3.7 a month)
> Median household income: $80,954 — No. 23 out of 382 metro areas (US median: $65,712)

38. Redding, California
> Adults who exercise regularly: 83.0% (US rate: 77.3%)
> Pop. with access to places for physical activity: 77.9% — No. 227 out of 382 metro areas (US rate: 84.2%)
> Adult obesity rate: 26.6% — No. 333 out of 382 metro areas (US rate: 29.7%)
> Pop. over 20 with diabetes: 12.4% — No. 110 out of 382 metro areas (US rate: 10.5%)
> Adults in poor or fair health: 17.2% — No. 244 out of 382 metro areas (US rate: 16.5%)
> Physically unhealthy days: 4.6 a month — No. 79 out of 382 metro areas (US avg: 3.7 a month)
> Median household income: $63,091 — No. 126 out of 382 metro areas (US median: $65,712)

37. Salt Lake City, Utah
> Adults who exercise regularly: 83.1% (US rate: 77.3%)
> Pop. with access to places for physical activity: 90.3% — No. 66 out of 382 metro areas (US rate: 84.2%)
> Adult obesity rate: 26.8% — No. 330 out of 382 metro areas (US rate: 29.7%)
> Pop. over 20 with diabetes: 7.3% — No. 361 out of 382 metro areas (US rate: 10.5%)
> Adults in poor or fair health: 16.3% — No. 283 out of 382 metro areas (US rate: 16.5%)
> Physically unhealthy days: 3.8 a month — No. 298 out of 382 metro areas (US avg: 3.7 a month)
> Median household income: $80,196 — No. 26 out of 382 metro areas (US median: $65,712)
[in-text-ad-2]

36. Burlington-South Burlington, Vermont
> Adults who exercise regularly: 83.4% (US rate: 77.3%)
> Pop. with access to places for physical activity: 77.9% — No. 228 out of 382 metro areas (US rate: 84.2%)
> Adult obesity rate: 25.4% — No. 347 out of 382 metro areas (US rate: 29.7%)
> Pop. over 20 with diabetes: 7.7% — No. 353 out of 382 metro areas (US rate: 10.5%)
> Adults in poor or fair health: 11.8% — No. 380 out of 382 metro areas (US rate: 16.5%)
> Physically unhealthy days: 3.7 a month — No. 323 out of 382 metro areas (US avg: 3.7 a month)
> Median household income: $74,909 — No. 51 out of 382 metro areas (US median: $65,712)

35. Mount Vernon-Anacortes, Washington
> Adults who exercise regularly: 83.4% (US rate: 77.3%)
> Pop. with access to places for physical activity: 80.6% — No. 192 out of 382 metro areas (US rate: 84.2%)
> Adult obesity rate: 30.2% — No. 255 out of 382 metro areas (US rate: 29.7%)
> Pop. over 20 with diabetes: 9.8% — No. 261 out of 382 metro areas (US rate: 10.5%)
> Adults in poor or fair health: 16.4% — No. 280 out of 382 metro areas (US rate: 16.5%)
> Physically unhealthy days: 4.1 a month — No. 226 out of 382 metro areas (US avg: 3.7 a month)
> Median household income: $67,175 — No. 93 out of 382 metro areas (US median: $65,712)
[in-text-ad]

34. Ames, Iowa
> Adults who exercise regularly: 83.5% (US rate: 77.3%)
> Pop. with access to places for physical activity: 93.1% — No. 36 out of 382 metro areas (US rate: 84.2%)
> Adult obesity rate: 28.9% — No. 287 out of 382 metro areas (US rate: 29.7%)
> Pop. over 20 with diabetes: 7.9% — No. 347 out of 382 metro areas (US rate: 10.5%)
> Adults in poor or fair health: 12.8% — No. 370 out of 382 metro areas (US rate: 16.5%)
> Physically unhealthy days: 3.3 a month — No. 366 out of 382 metro areas (US avg: 3.7 a month)
> Median household income: $62,181 — No. 142 out of 382 metro areas (US median: $65,712)

33. Flagstaff, Arizona
> Adults who exercise regularly: 83.5% (US rate: 77.3%)
> Pop. with access to places for physical activity: 82.9% — No. 161 out of 382 metro areas (US rate: 84.2%)
> Adult obesity rate: 24.5% — No. 353 out of 382 metro areas (US rate: 29.7%)
> Pop. over 20 with diabetes: 7.7% — No. 354 out of 382 metro areas (US rate: 10.5%)
> Adults in poor or fair health: 17.9% — No. 218 out of 382 metro areas (US rate: 16.5%)
> Physically unhealthy days: 4.3 a month — No. 138 out of 382 metro areas (US avg: 3.7 a month)
> Median household income: $58,085 — No. 207 out of 382 metro areas (US median: $65,712)

32. Kennewick-Richland, Washington
> Adults who exercise regularly: 83.6% (US rate: 77.3%)
> Pop. with access to places for physical activity: 72.3% — No. 284 out of 382 metro areas (US rate: 84.2%)
> Adult obesity rate: 33.5% — No. 143 out of 382 metro areas (US rate: 29.7%)
> Pop. over 20 with diabetes: 9.6% — No. 280 out of 382 metro areas (US rate: 10.5%)
> Adults in poor or fair health: 19.3% — No. 161 out of 382 metro areas (US rate: 16.5%)
> Physically unhealthy days: 4.4 a month — No. 130 out of 382 metro areas (US avg: 3.7 a month)
> Median household income: $68,283 — No. 85 out of 382 metro areas (US median: $65,712)
[in-text-ad-2]
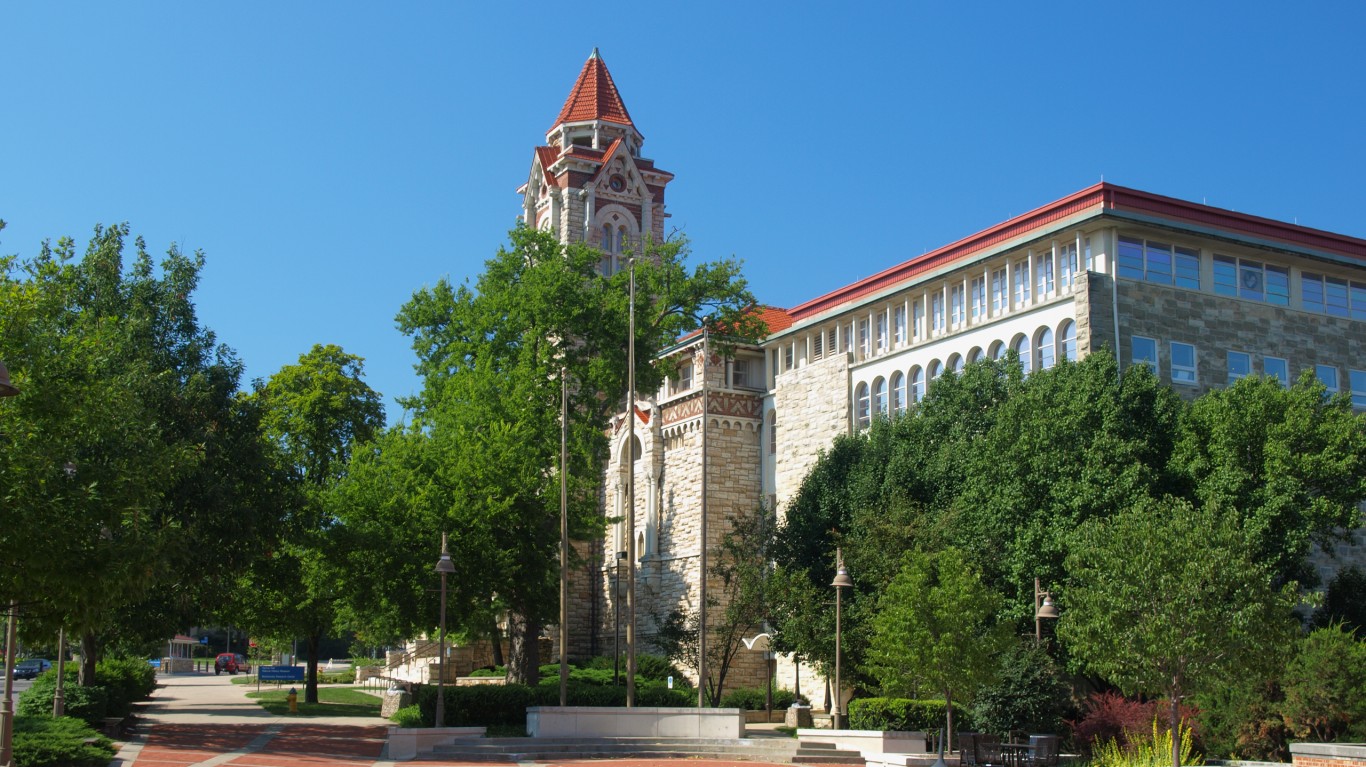
31. Lawrence, Kansas
> Adults who exercise regularly: 83.7% (US rate: 77.3%)
> Pop. with access to places for physical activity: 91.0% — No. 57 out of 382 metro areas (US rate: 84.2%)
> Adult obesity rate: 28.0% — No. 310 out of 382 metro areas (US rate: 29.7%)
> Pop. over 20 with diabetes: 7.0% — No. 365 out of 382 metro areas (US rate: 10.5%)
> Adults in poor or fair health: 14.8% — No. 331 out of 382 metro areas (US rate: 16.5%)
> Physically unhealthy days: 3.5 a month — No. 347 out of 382 metro areas (US avg: 3.7 a month)
> Median household income: $64,233 — No. 114 out of 382 metro areas (US median: $65,712)

30. Eugene-Springfield, Oregon
> Adults who exercise regularly: 83.7% (US rate: 77.3%)
> Pop. with access to places for physical activity: 88.5% — No. 81 out of 382 metro areas (US rate: 84.2%)
> Adult obesity rate: 28.6% — No. 296 out of 382 metro areas (US rate: 29.7%)
> Pop. over 20 with diabetes: 9.4% — No. 287 out of 382 metro areas (US rate: 10.5%)
> Adults in poor or fair health: 18.4% — No. 199 out of 382 metro areas (US rate: 16.5%)
> Physically unhealthy days: 4.8 a month — No. 59 out of 382 metro areas (US avg: 3.7 a month)
> Median household income: $57,325 — No. 222 out of 382 metro areas (US median: $65,712)
[in-text-ad]

29. Albuquerque, New Mexico
> Adults who exercise regularly: 83.8% (US rate: 77.3%)
> Pop. with access to places for physical activity: 84.9% — No. 135 out of 382 metro areas (US rate: 84.2%)
> Adult obesity rate: 25.5% — No. 344 out of 382 metro areas (US rate: 29.7%)
> Pop. over 20 with diabetes: 7.9% — No. 351 out of 382 metro areas (US rate: 10.5%)
> Adults in poor or fair health: 19.2% — No. 166 out of 382 metro areas (US rate: 16.5%)
> Physically unhealthy days: 4.2 a month — No. 179 out of 382 metro areas (US avg: 3.7 a month)
> Median household income: $58,512 — No. 201 out of 382 metro areas (US median: $65,712)
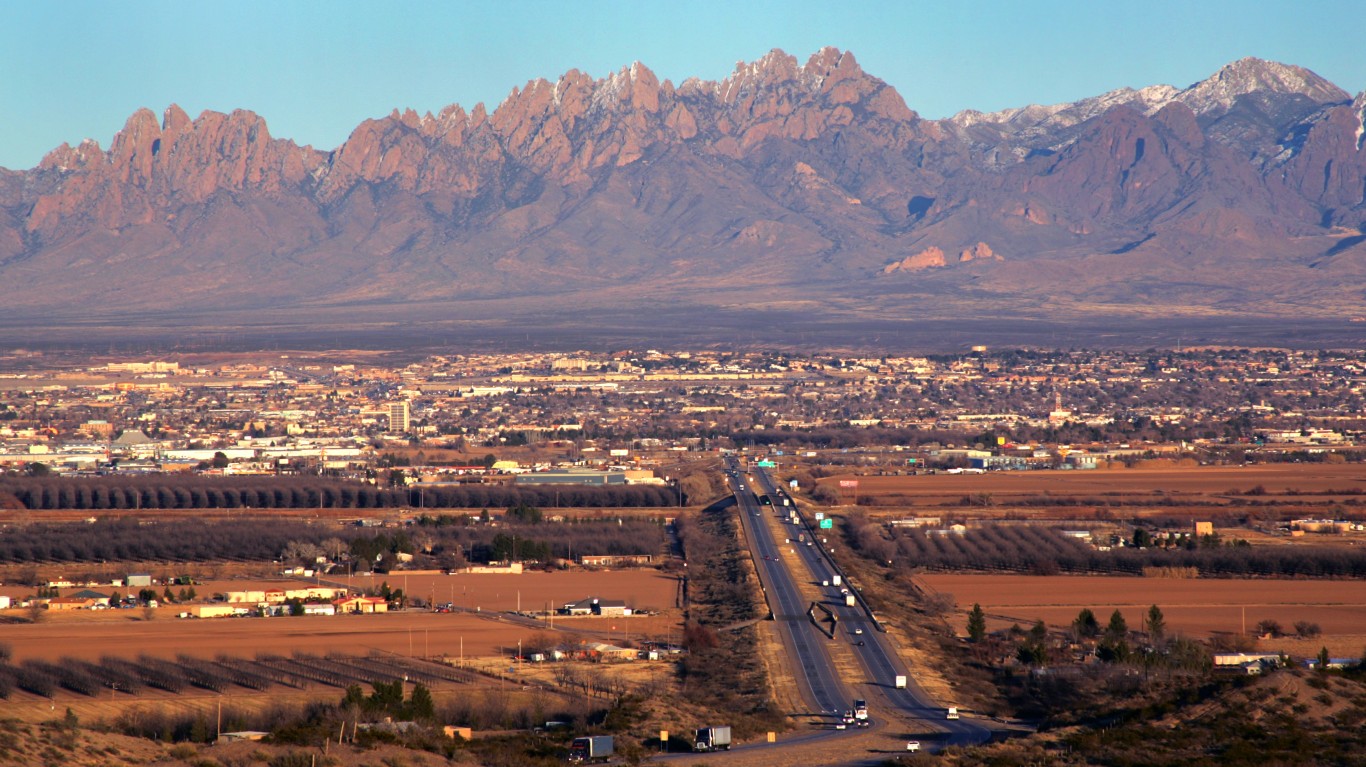
28. Las Cruces, New Mexico
> Adults who exercise regularly: 83.9% (US rate: 77.3%)
> Pop. with access to places for physical activity: 78.0% — No. 225 out of 382 metro areas (US rate: 84.2%)
> Adult obesity rate: 26.4% — No. 335 out of 382 metro areas (US rate: 29.7%)
> Pop. over 20 with diabetes: 9.6% — No. 277 out of 382 metro areas (US rate: 10.5%)
> Adults in poor or fair health: 23.5% — No. 33 out of 382 metro areas (US rate: 16.5%)
> Physically unhealthy days: 4.4 a month — No. 116 out of 382 metro areas (US avg: 3.7 a month)
> Median household income: $43,038 — No. 374 out of 382 metro areas (US median: $65,712)
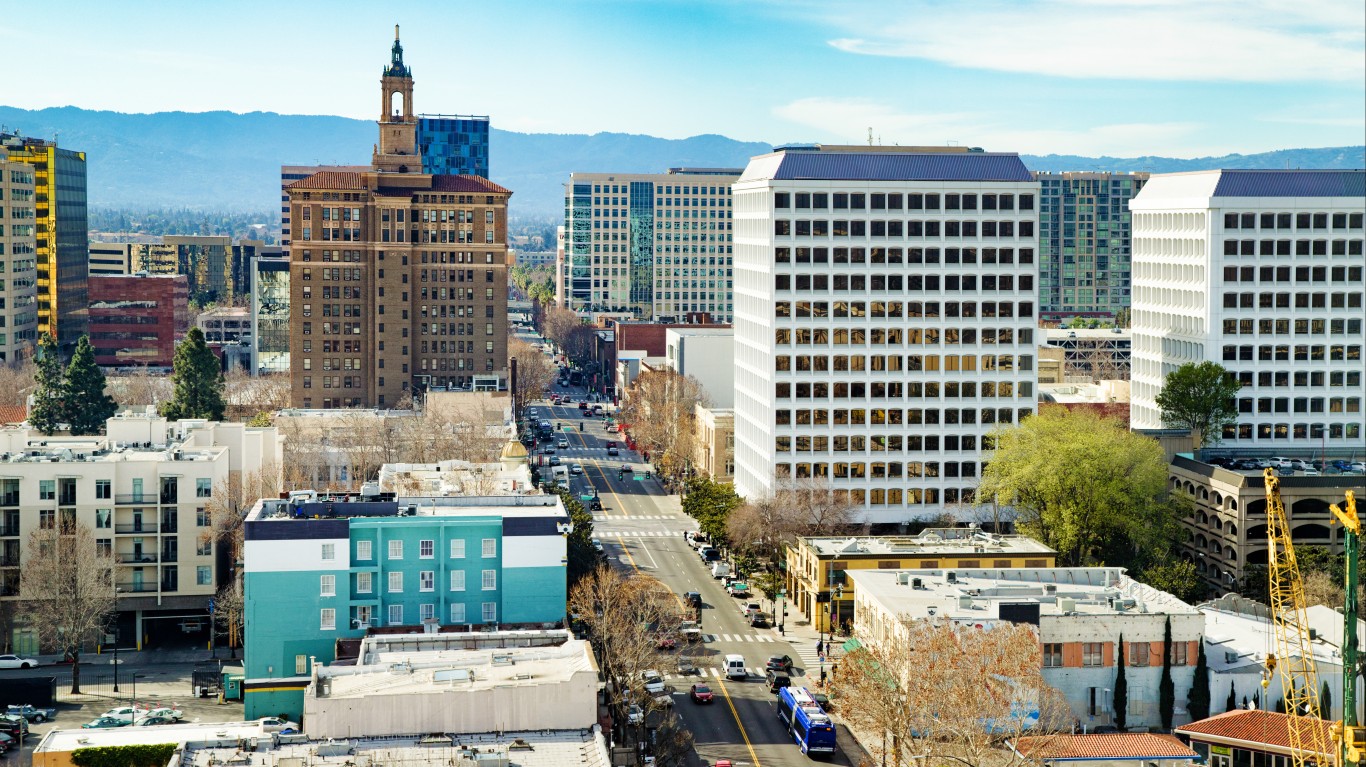
27. San Jose-Sunnyvale-Santa Clara, California
> Adults who exercise regularly: 83.9% (US rate: 77.3%)
> Pop. with access to places for physical activity: 98.1% — No. 7 out of 382 metro areas (US rate: 84.2%)
> Adult obesity rate: 20.4% — No. 377 out of 382 metro areas (US rate: 29.7%)
> Pop. over 20 with diabetes: 8.5% — No. 332 out of 382 metro areas (US rate: 10.5%)
> Adults in poor or fair health: 14.5% — No. 337 out of 382 metro areas (US rate: 16.5%)
> Physically unhealthy days: 3.7 a month — No. 318 out of 382 metro areas (US avg: 3.7 a month)
> Median household income: $130,865 — No. 1 out of 382 metro areas (US median: $65,712)
[in-text-ad-2]

26. Walla Walla, Washington
> Adults who exercise regularly: 83.9% (US rate: 77.3%)
> Pop. with access to places for physical activity: 80.5% — No. 194 out of 382 metro areas (US rate: 84.2%)
> Adult obesity rate: 29.3% — No. 280 out of 382 metro areas (US rate: 29.7%)
> Pop. over 20 with diabetes: 12.1% — No. 124 out of 382 metro areas (US rate: 10.5%)
> Adults in poor or fair health: 17.8% — No. 226 out of 382 metro areas (US rate: 16.5%)
> Physically unhealthy days: 4.2 a month — No. 206 out of 382 metro areas (US avg: 3.7 a month)
> Median household income: $61,285 — No. 155 out of 382 metro areas (US median: $65,712)

25. Los Angeles-Long Beach-Anaheim, California
> Adults who exercise regularly: 84.0% (US rate: 77.3%)
> Pop. with access to places for physical activity: 98.1% — No. 6 out of 382 metro areas (US rate: 84.2%)
> Adult obesity rate: 21.6% — No. 373 out of 382 metro areas (US rate: 29.7%)
> Pop. over 20 with diabetes: 8.8% — No. 318 out of 382 metro areas (US rate: 10.5%)
> Adults in poor or fair health: 20.2% — No. 115 out of 382 metro areas (US rate: 16.5%)
> Physically unhealthy days: 4.3 a month — No. 165 out of 382 metro areas (US avg: 3.7 a month)
> Median household income: $77,774 — No. 35 out of 382 metro areas (US median: $65,712)
[in-text-ad]

24. Medford, Oregon
> Adults who exercise regularly: 84.1% (US rate: 77.3%)
> Pop. with access to places for physical activity: 82.6% — No. 168 out of 382 metro areas (US rate: 84.2%)
> Adult obesity rate: 26.8% — No. 328 out of 382 metro areas (US rate: 29.7%)
> Pop. over 20 with diabetes: 10.7% — No. 204 out of 382 metro areas (US rate: 10.5%)
> Adults in poor or fair health: 19.4% — No. 154 out of 382 metro areas (US rate: 16.5%)
> Physically unhealthy days: 4.8 a month — No. 45 out of 382 metro areas (US avg: 3.7 a month)
> Median household income: $56,450 — No. 236 out of 382 metro areas (US median: $65,712)

23. Santa Rosa-Petaluma, California
> Adults who exercise regularly: 84.3% (US rate: 77.3%)
> Pop. with access to places for physical activity: 93.7% — No. 34 out of 382 metro areas (US rate: 84.2%)
> Adult obesity rate: 23.9% — No. 362 out of 382 metro areas (US rate: 29.7%)
> Pop. over 20 with diabetes: 8.3% — No. 338 out of 382 metro areas (US rate: 10.5%)
> Adults in poor or fair health: 15.1% — No. 323 out of 382 metro areas (US rate: 16.5%)
> Physically unhealthy days: 4.0 a month — No. 255 out of 382 metro areas (US avg: 3.7 a month)
> Median household income: $87,828 — No. 12 out of 382 metro areas (US median: $65,712)
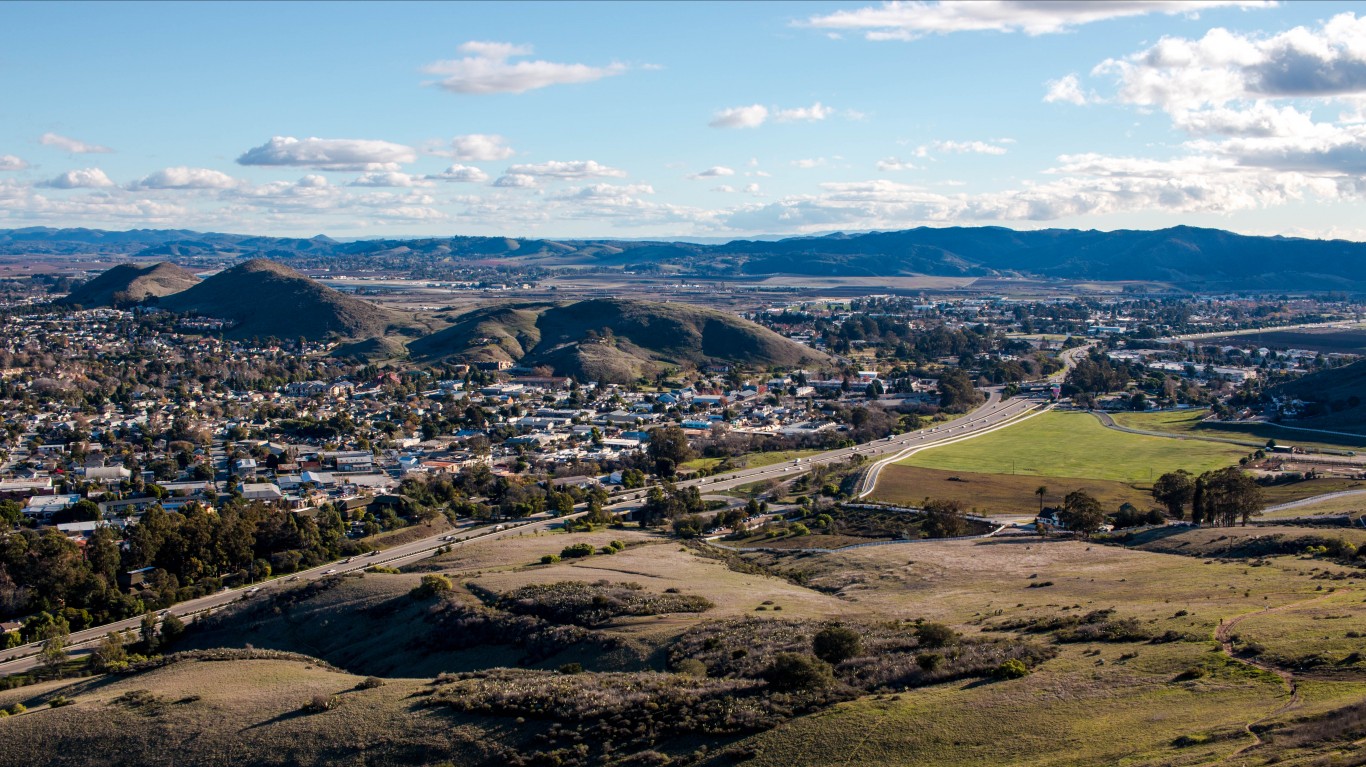
22. San Luis Obispo-Paso Robles, California
> Adults who exercise regularly: 84.4% (US rate: 77.3%)
> Pop. with access to places for physical activity: 87.6% — No. 92 out of 382 metro areas (US rate: 84.2%)
> Adult obesity rate: 28.6% — No. 297 out of 382 metro areas (US rate: 29.7%)
> Pop. over 20 with diabetes: 9.1% — No. 301 out of 382 metro areas (US rate: 10.5%)
> Adults in poor or fair health: 15.2% — No. 319 out of 382 metro areas (US rate: 16.5%)
> Physically unhealthy days: 4.0 a month — No. 247 out of 382 metro areas (US avg: 3.7 a month)
> Median household income: $77,265 — No. 37 out of 382 metro areas (US median: $65,712)
[in-text-ad-2]

21. Colorado Springs, Colorado
> Adults who exercise regularly: 84.4% (US rate: 77.3%)
> Pop. with access to places for physical activity: 88.1% — No. 87 out of 382 metro areas (US rate: 84.2%)
> Adult obesity rate: 22.9% — No. 367 out of 382 metro areas (US rate: 29.7%)
> Pop. over 20 with diabetes: 6.6% — No. 369 out of 382 metro areas (US rate: 10.5%)
> Adults in poor or fair health: 13.6% — No. 355 out of 382 metro areas (US rate: 16.5%)
> Physically unhealthy days: 3.5 a month — No. 348 out of 382 metro areas (US avg: 3.7 a month)
> Median household income: $72,633 — No. 54 out of 382 metro areas (US median: $65,712)

20. Madison, Wisconsin
> Adults who exercise regularly: 84.5% (US rate: 77.3%)
> Pop. with access to places for physical activity: 88.9% — No. 79 out of 382 metro areas (US rate: 84.2%)
> Adult obesity rate: 25.9% — No. 339 out of 382 metro areas (US rate: 29.7%)
> Pop. over 20 with diabetes: 6.6% — No. 370 out of 382 metro areas (US rate: 10.5%)
> Adults in poor or fair health: 12.5% — No. 374 out of 382 metro areas (US rate: 16.5%)
> Physically unhealthy days: 3.4 a month — No. 362 out of 382 metro areas (US avg: 3.7 a month)
> Median household income: $75,545 — No. 48 out of 382 metro areas (US median: $65,712)
[in-text-ad]

19. Bend, Oregon
> Adults who exercise regularly: 84.5% (US rate: 77.3%)
> Pop. with access to places for physical activity: 90.4% — No. 65 out of 382 metro areas (US rate: 84.2%)
> Adult obesity rate: 25.5% — No. 346 out of 382 metro areas (US rate: 29.7%)
> Pop. over 20 with diabetes: 8.5% — No. 335 out of 382 metro areas (US rate: 10.5%)
> Adults in poor or fair health: 15.1% — No. 325 out of 382 metro areas (US rate: 16.5%)
> Physically unhealthy days: 4.1 a month — No. 223 out of 382 metro areas (US avg: 3.7 a month)
> Median household income: $71,643 — No. 61 out of 382 metro areas (US median: $65,712)

18. Portland-Vancouver-Hillsboro, Oregon
> Adults who exercise regularly: 84.6% (US rate: 77.3%)
> Pop. with access to places for physical activity: 94.3% — No. 30 out of 382 metro areas (US rate: 84.2%)
> Adult obesity rate: 28.0% — No. 308 out of 382 metro areas (US rate: 29.7%)
> Pop. over 20 with diabetes: 9.0% — No. 307 out of 382 metro areas (US rate: 10.5%)
> Adults in poor or fair health: 15.8% — No. 303 out of 382 metro areas (US rate: 16.5%)
> Physically unhealthy days: 4.2 a month — No. 202 out of 382 metro areas (US avg: 3.7 a month)
> Median household income: $78,439 — No. 34 out of 382 metro areas (US median: $65,712)

17. Seattle-Tacoma-Bellevue, Washington
> Adults who exercise regularly: 84.8% (US rate: 77.3%)
> Pop. with access to places for physical activity: 91.7% — No. 48 out of 382 metro areas (US rate: 84.2%)
> Adult obesity rate: 26.1% — No. 336 out of 382 metro areas (US rate: 29.7%)
> Pop. over 20 with diabetes: 8.6% — No. 331 out of 382 metro areas (US rate: 10.5%)
> Adults in poor or fair health: 14.0% — No. 351 out of 382 metro areas (US rate: 16.5%)
> Physically unhealthy days: 3.6 a month — No. 334 out of 382 metro areas (US avg: 3.7 a month)
> Median household income: $94,027 — No. 6 out of 382 metro areas (US median: $65,712)
[in-text-ad-2]
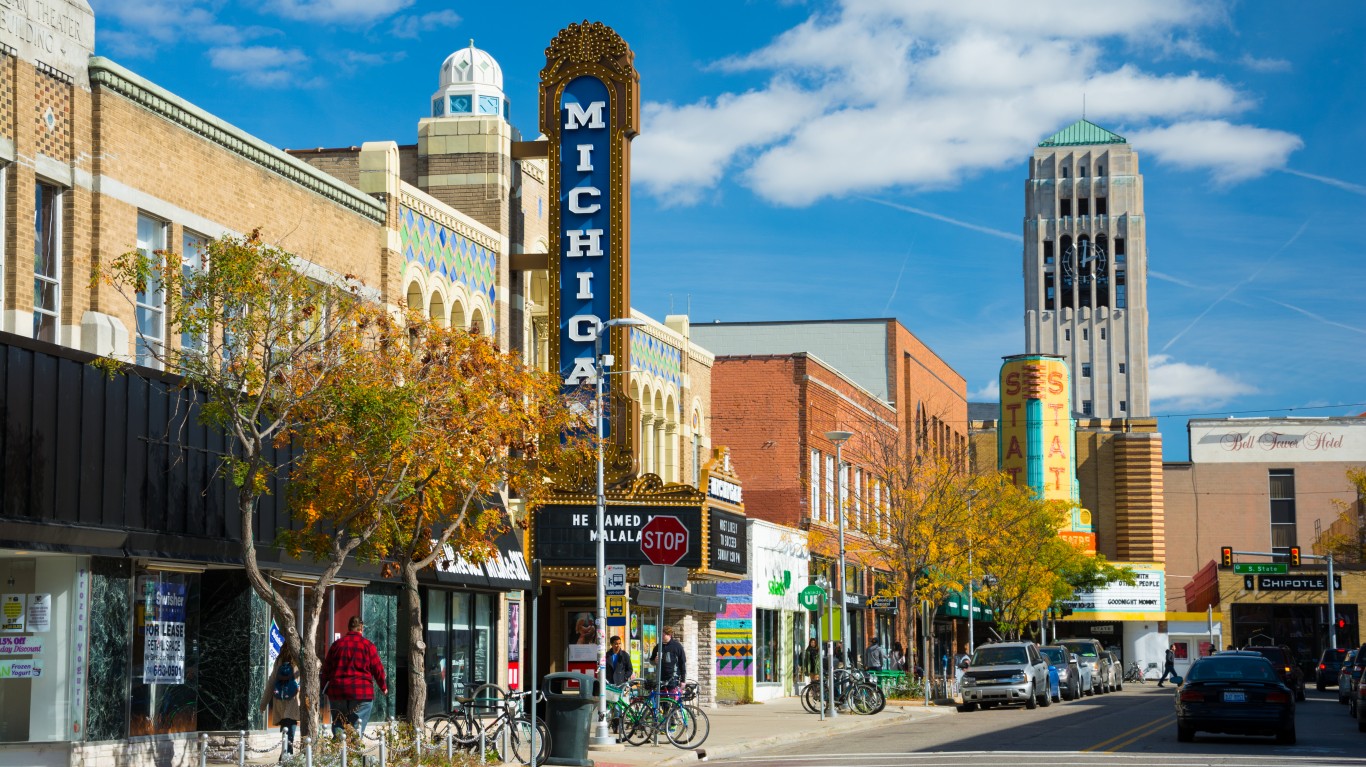
16. Ann Arbor, Michigan
> Adults who exercise regularly: 84.9% (US rate: 77.3%)
> Pop. with access to places for physical activity: 90.2% — No. 69 out of 382 metro areas (US rate: 84.2%)
> Adult obesity rate: 25.5% — No. 345 out of 382 metro areas (US rate: 29.7%)
> Pop. over 20 with diabetes: 7.5% — No. 357 out of 382 metro areas (US rate: 10.5%)
> Adults in poor or fair health: 14.4% — No. 340 out of 382 metro areas (US rate: 16.5%)
> Physically unhealthy days: 3.8 a month — No. 310 out of 382 metro areas (US avg: 3.7 a month)
> Median household income: $76,576 — No. 41 out of 382 metro areas (US median: $65,712)

15. San Francisco-Oakland-Berkeley, California
> Adults who exercise regularly: 85.0% (US rate: 77.3%)
> Pop. with access to places for physical activity: 98.9% — No. 5 out of 382 metro areas (US rate: 84.2%)
> Adult obesity rate: 21.7% — No. 370 out of 382 metro areas (US rate: 29.7%)
> Pop. over 20 with diabetes: 7.4% — No. 359 out of 382 metro areas (US rate: 10.5%)
> Adults in poor or fair health: 14.0% — No. 350 out of 382 metro areas (US rate: 16.5%)
> Physically unhealthy days: 3.6 a month — No. 330 out of 382 metro areas (US avg: 3.7 a month)
> Median household income: $114,696 — No. 2 out of 382 metro areas (US median: $65,712)
[in-text-ad]

14. Grand Junction, Colorado
> Adults who exercise regularly: 85.0% (US rate: 77.3%)
> Pop. with access to places for physical activity: 77.4% — No. 232 out of 382 metro areas (US rate: 84.2%)
> Adult obesity rate: 25.8% — No. 342 out of 382 metro areas (US rate: 29.7%)
> Pop. over 20 with diabetes: 8.6% — No. 328 out of 382 metro areas (US rate: 10.5%)
> Adults in poor or fair health: 15.6% — No. 312 out of 382 metro areas (US rate: 16.5%)
> Physically unhealthy days: 3.9 a month — No. 283 out of 382 metro areas (US avg: 3.7 a month)
> Median household income: $60,500 — No. 176 out of 382 metro areas (US median: $65,712)

13. Logan, Utah
> Adults who exercise regularly: 85.1% (US rate: 77.3%)
> Pop. with access to places for physical activity: 84.0% — No. 150 out of 382 metro areas (US rate: 84.2%)
> Adult obesity rate: 25.0% — No. 350 out of 382 metro areas (US rate: 29.7%)
> Pop. over 20 with diabetes: 6.1% — No. 377 out of 382 metro areas (US rate: 10.5%)
> Adults in poor or fair health: 15.2% — No. 320 out of 382 metro areas (US rate: 16.5%)
> Physically unhealthy days: 4.0 a month — No. 249 out of 382 metro areas (US avg: 3.7 a month)
> Median household income: $61,467 — No. 152 out of 382 metro areas (US median: $65,712)

12. San Diego-Chula Vista-Carlsbad, California
> Adults who exercise regularly: 85.1% (US rate: 77.3%)
> Pop. with access to places for physical activity: 97.0% — No. 12 out of 382 metro areas (US rate: 84.2%)
> Adult obesity rate: 20.3% — No. 378 out of 382 metro areas (US rate: 29.7%)
> Pop. over 20 with diabetes: 7.6% — No. 355 out of 382 metro areas (US rate: 10.5%)
> Adults in poor or fair health: 15.8% — No. 302 out of 382 metro areas (US rate: 16.5%)
> Physically unhealthy days: 3.9 a month — No. 269 out of 382 metro areas (US avg: 3.7 a month)
> Median household income: $83,985 — No. 17 out of 382 metro areas (US median: $65,712)
[in-text-ad-2]
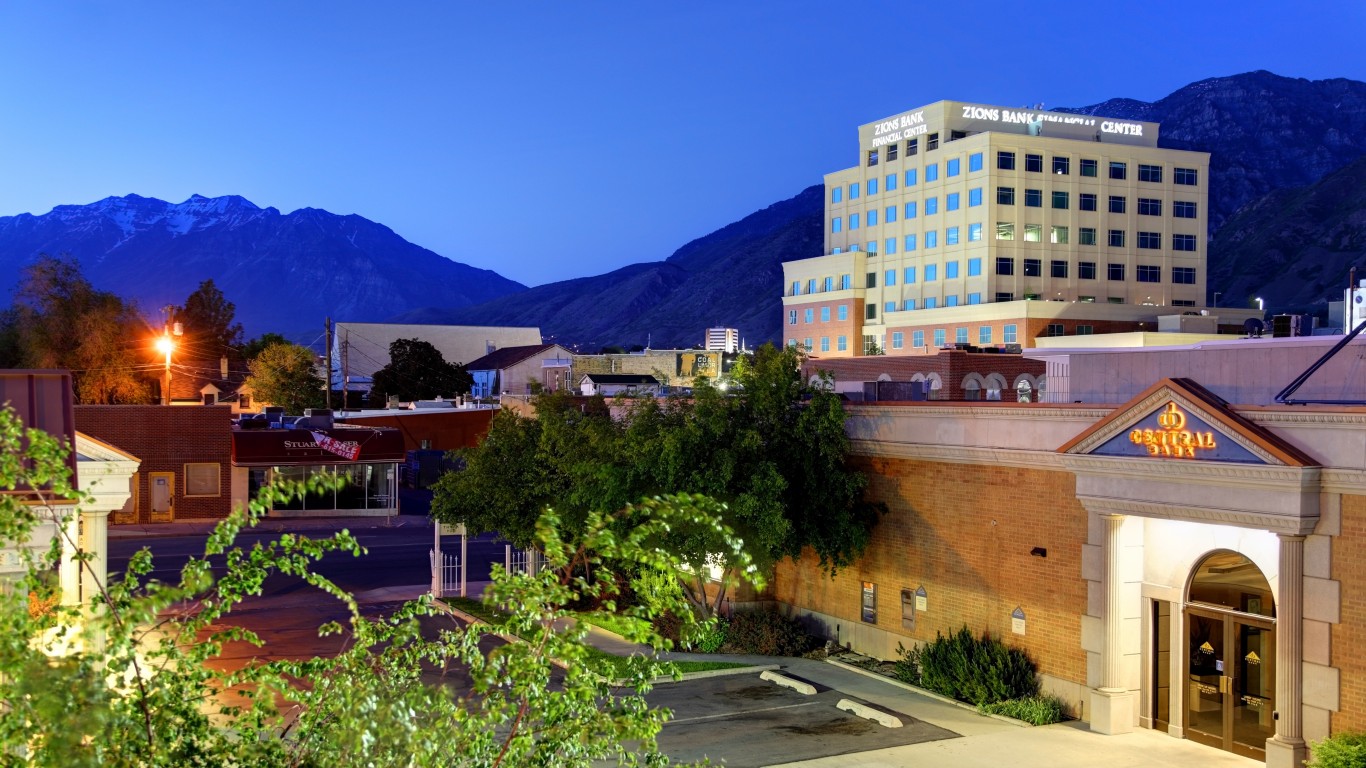
11. Provo-Orem, Utah
> Adults who exercise regularly: 85.1% (US rate: 77.3%)
> Pop. with access to places for physical activity: 84.3% — No. 144 out of 382 metro areas (US rate: 84.2%)
> Adult obesity rate: 25.8% — No. 341 out of 382 metro areas (US rate: 29.7%)
> Pop. over 20 with diabetes: 6.2% — No. 374 out of 382 metro areas (US rate: 10.5%)
> Adults in poor or fair health: 13.3% — No. 362 out of 382 metro areas (US rate: 16.5%)
> Physically unhealthy days: 3.8 a month — No. 303 out of 382 metro areas (US avg: 3.7 a month)
> Median household income: $79,152 — No. 31 out of 382 metro areas (US median: $65,712)
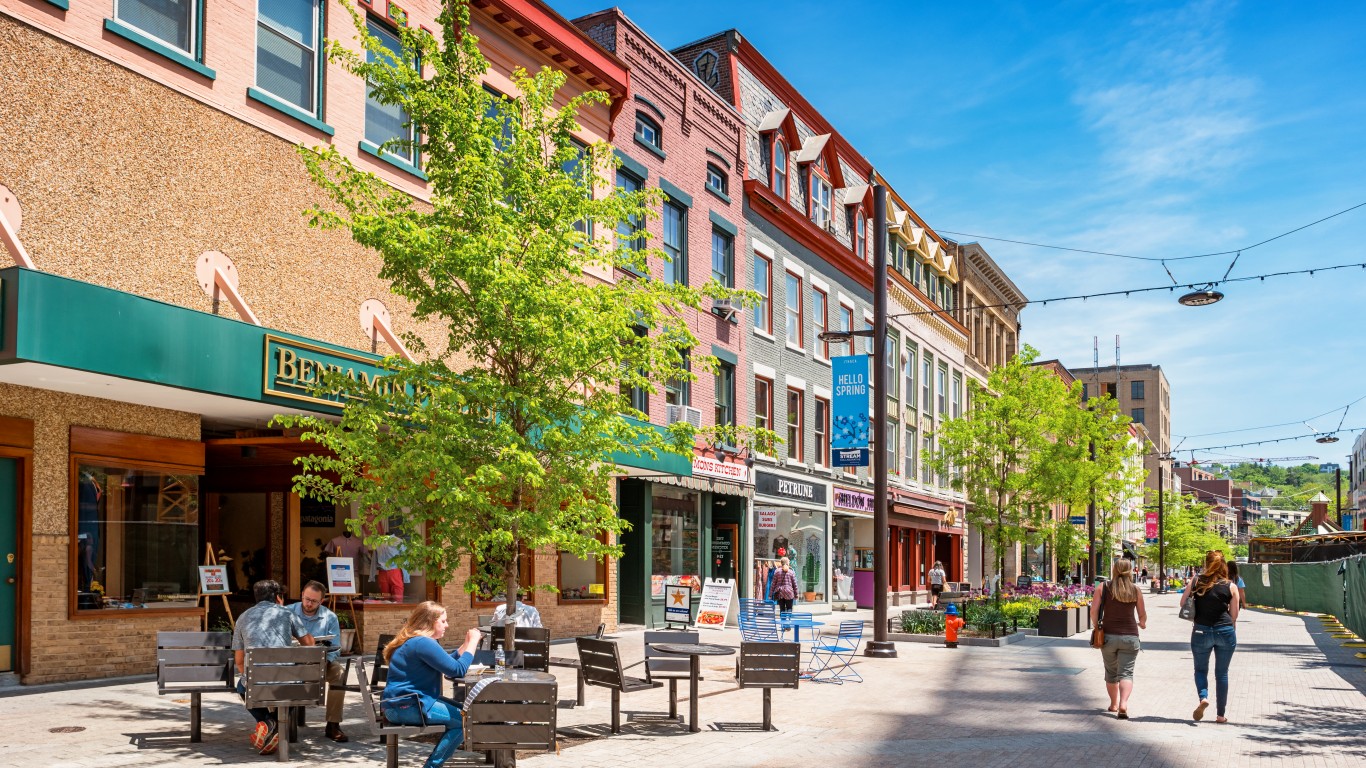
10. Ithaca, New York
> Adults who exercise regularly: 85.4% (US rate: 77.3%)
> Pop. with access to places for physical activity: 86.2% — No. 115 out of 382 metro areas (US rate: 84.2%)
> Adult obesity rate: 23.0% — No. 366 out of 382 metro areas (US rate: 29.7%)
> Pop. over 20 with diabetes: 6.5% — No. 371 out of 382 metro areas (US rate: 10.5%)
> Adults in poor or fair health: 13.5% — No. 360 out of 382 metro areas (US rate: 16.5%)
> Physically unhealthy days: 3.5 a month — No. 345 out of 382 metro areas (US avg: 3.7 a month)
> Median household income: $58,626 — No. 199 out of 382 metro areas (US median: $65,712)
[in-text-ad]

9. Olympia-Lacey-Tumwater, Washington
> Adults who exercise regularly: 85.6% (US rate: 77.3%)
> Pop. with access to places for physical activity: 74.6% — No. 267 out of 382 metro areas (US rate: 84.2%)
> Adult obesity rate: 30.1% — No. 258 out of 382 metro areas (US rate: 29.7%)
> Pop. over 20 with diabetes: 10.2% — No. 231 out of 382 metro areas (US rate: 10.5%)
> Adults in poor or fair health: 15.4% — No. 315 out of 382 metro areas (US rate: 16.5%)
> Physically unhealthy days: 3.8 a month — No. 292 out of 382 metro areas (US avg: 3.7 a month)
> Median household income: $78,512 — No. 33 out of 382 metro areas (US median: $65,712)
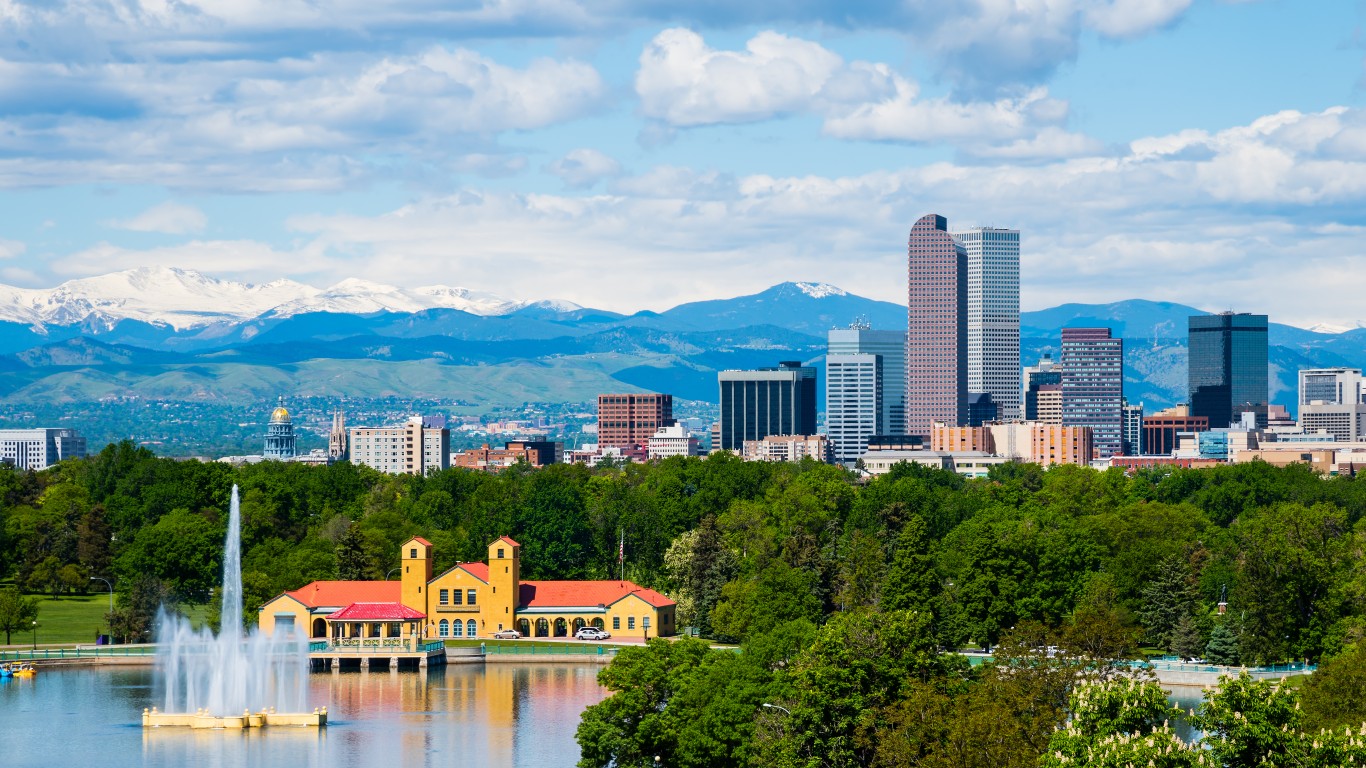
8. Denver-Aurora-Lakewood, Colorado
> Adults who exercise regularly: 85.8% (US rate: 77.3%)
> Pop. with access to places for physical activity: 96.6% — No. 16 out of 382 metro areas (US rate: 84.2%)
> Adult obesity rate: 21.6% — No. 371 out of 382 metro areas (US rate: 29.7%)
> Pop. over 20 with diabetes: 6.3% — No. 373 out of 382 metro areas (US rate: 10.5%)
> Adults in poor or fair health: 13.7% — No. 354 out of 382 metro areas (US rate: 16.5%)
> Physically unhealthy days: 3.3 a month — No. 365 out of 382 metro areas (US avg: 3.7 a month)
> Median household income: $85,641 — No. 15 out of 382 metro areas (US median: $65,712)

7. Santa Maria-Santa Barbara, California
> Adults who exercise regularly: 86.0% (US rate: 77.3%)
> Pop. with access to places for physical activity: 92.2% — No. 44 out of 382 metro areas (US rate: 84.2%)
> Adult obesity rate: 24.2% — No. 357 out of 382 metro areas (US rate: 29.7%)
> Pop. over 20 with diabetes: 8.0% — No. 345 out of 382 metro areas (US rate: 10.5%)
> Adults in poor or fair health: 19.3% — No. 158 out of 382 metro areas (US rate: 16.5%)
> Physically unhealthy days: 4.2 a month — No. 190 out of 382 metro areas (US avg: 3.7 a month)
> Median household income: $75,653 — No. 46 out of 382 metro areas (US median: $65,712)
[in-text-ad-2]

6. Corvallis, Oregon
> Adults who exercise regularly: 86.1% (US rate: 77.3%)
> Pop. with access to places for physical activity: 90.3% — No. 68 out of 382 metro areas (US rate: 84.2%)
> Adult obesity rate: 21.6% — No. 372 out of 382 metro areas (US rate: 29.7%)
> Pop. over 20 with diabetes: 5.7% — No. 380 out of 382 metro areas (US rate: 10.5%)
> Adults in poor or fair health: 16.1% — No. 290 out of 382 metro areas (US rate: 16.5%)
> Physically unhealthy days: 4.1 a month — No. 238 out of 382 metro areas (US avg: 3.7 a month)
> Median household income: $70,835 — No. 67 out of 382 metro areas (US median: $65,712)

5. Bellingham, Washington
> Adults who exercise regularly: 87.3% (US rate: 77.3%)
> Pop. with access to places for physical activity: 85.1% — No. 132 out of 382 metro areas (US rate: 84.2%)
> Adult obesity rate: 28.0% — No. 309 out of 382 metro areas (US rate: 29.7%)
> Pop. over 20 with diabetes: 7.9% — No. 347 out of 382 metro areas (US rate: 10.5%)
> Adults in poor or fair health: 15.0% — No. 327 out of 382 metro areas (US rate: 16.5%)
> Physically unhealthy days: 4.2 a month — No. 175 out of 382 metro areas (US avg: 3.7 a month)
> Median household income: $69,372 — No. 77 out of 382 metro areas (US median: $65,712)
[in-text-ad]
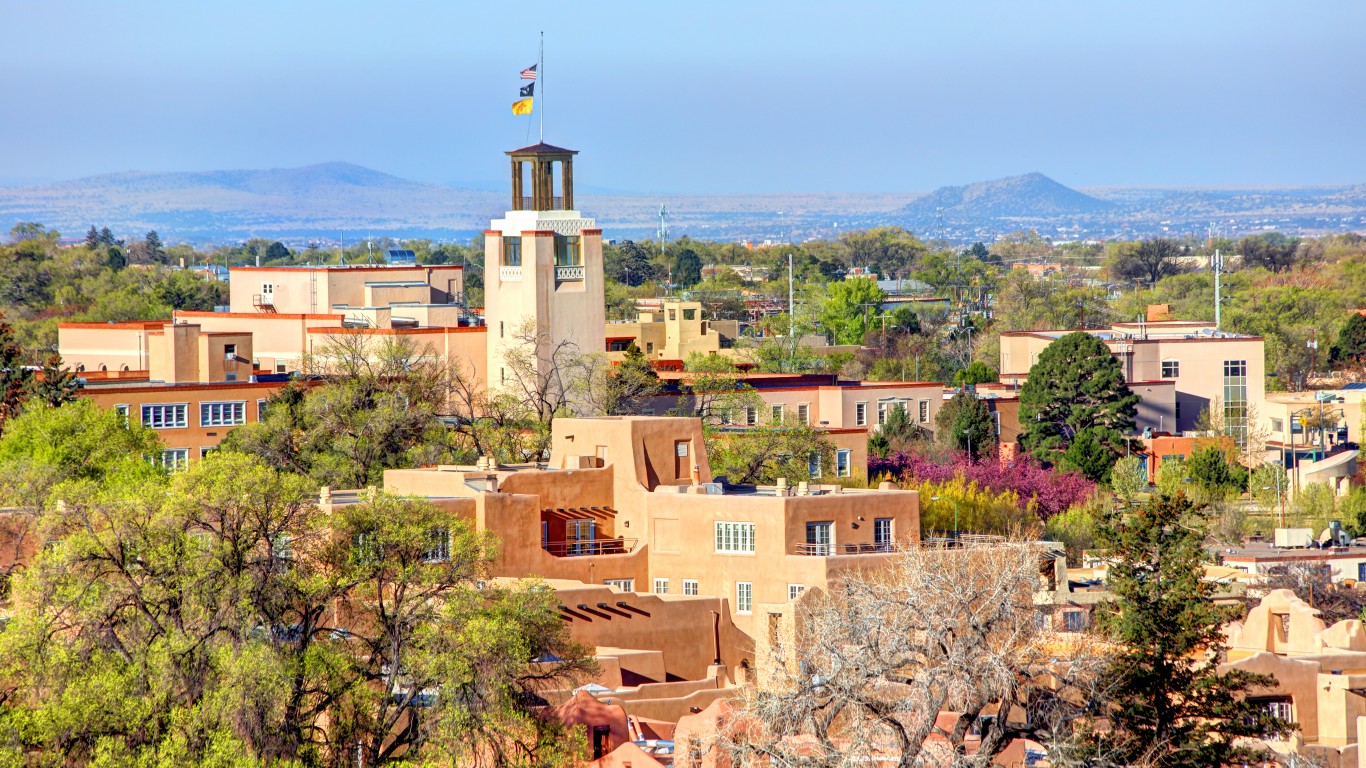
4. Santa Fe, New Mexico
> Adults who exercise regularly: 87.3% (US rate: 77.3%)
> Pop. with access to places for physical activity: 78.7% — No. 217 out of 382 metro areas (US rate: 84.2%)
> Adult obesity rate: 16.1% — No. 381 out of 382 metro areas (US rate: 29.7%)
> Pop. over 20 with diabetes: 6.1% — No. 376 out of 382 metro areas (US rate: 10.5%)
> Adults in poor or fair health: 17.8% — No. 219 out of 382 metro areas (US rate: 16.5%)
> Physically unhealthy days: 4.0 a month — No. 252 out of 382 metro areas (US avg: 3.7 a month)
> Median household income: $61,298 — No. 154 out of 382 metro areas (US median: $65,712)
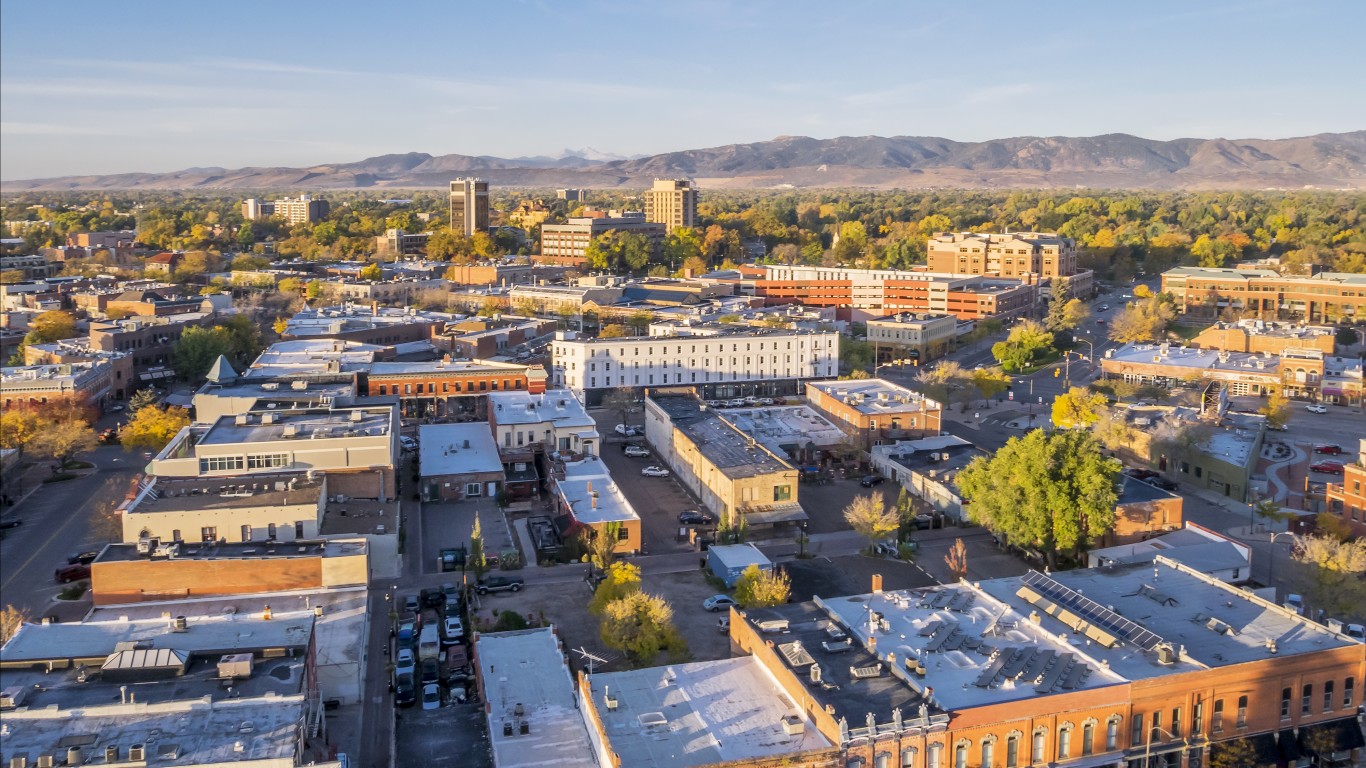
3. Fort Collins, Colorado
> Adults who exercise regularly: 88.4% (US rate: 77.3%)
> Pop. with access to places for physical activity: 92.8% — No. 39 out of 382 metro areas (US rate: 84.2%)
> Adult obesity rate: 20.9% — No. 376 out of 382 metro areas (US rate: 29.7%)
> Pop. over 20 with diabetes: 5.4% — No. 382 out of 382 metro areas (US rate: 10.5%)
> Adults in poor or fair health: 11.2% — No. 381 out of 382 metro areas (US rate: 16.5%)
> Physically unhealthy days: 3.2 a month — No. 371 out of 382 metro areas (US avg: 3.7 a month)
> Median household income: $75,186 — No. 50 out of 382 metro areas (US median: $65,712)

2. Santa Cruz-Watsonville, California
> Adults who exercise regularly: 88.9% (US rate: 77.3%)
> Pop. with access to places for physical activity: 94.0% — No. 32 out of 382 metro areas (US rate: 84.2%)
> Adult obesity rate: 19.3% — No. 380 out of 382 metro areas (US rate: 29.7%)
> Pop. over 20 with diabetes: 6.2% — No. 375 out of 382 metro areas (US rate: 10.5%)
> Adults in poor or fair health: 16.3% — No. 285 out of 382 metro areas (US rate: 16.5%)
> Physically unhealthy days: 4.0 a month — No. 265 out of 382 metro areas (US avg: 3.7 a month)
> Median household income: $89,269 — No. 9 out of 382 metro areas (US median: $65,712)
[in-text-ad-2]

1. Boulder, Colorado
> Adults who exercise regularly: 91.1% (US rate: 77.3%)
> Pop. with access to places for physical activity: 96.2% — No. 18 out of 382 metro areas (US rate: 84.2%)
> Adult obesity rate: 14.3% — No. 382 out of 382 metro areas (US rate: 29.7%)
> Pop. over 20 with diabetes: 5.5% — No. 381 out of 382 metro areas (US rate: 10.5%)
> Adults in poor or fair health: 11.2% — No. 382 out of 382 metro areas (US rate: 16.5%)
> Physically unhealthy days: 3.0 a month — No. 378 out of 382 metro areas (US avg: 3.7 a month)
> Median household income: $88,535 — No. 10 out of 382 metro areas (US median: $65,712)
Credit Card Companies Are Doing Something Nuts
Credit card companies are at war. The biggest issuers are handing out free rewards and benefits to win the best customers.
It’s possible to find cards paying unlimited 1.5%, 2%, and even more today. That’s free money for qualified borrowers, and the type of thing that would be crazy to pass up. Those rewards can add up to thousands of dollars every year in free money, and include other benefits as well.
We’ve assembled some of the best credit cards for users today. Don’t miss these offers because they won’t be this good forever.
Flywheel Publishing has partnered with CardRatings for our coverage of credit card products. Flywheel Publishing and CardRatings may receive a commission from card issuers.
Thank you for reading! Have some feedback for us?
Contact the 24/7 Wall St. editorial team.
 24/7 Wall St.

