Special Report
This Is the City Where Homes Are Selling Fastest
Published:
Last Updated:

The U.S. real estate market is on fire. This is driven by low mortgage rates, solid incomes among middle and upper-class Americans, and the desire of people to move out of America’s largest cities, particularly on the East and West Coasts, often due to worries about the spread of COVID-19.
Realtor.com data shows median list prices have increased by over 12% from June 2020 to June 2021. In some markets, the number is much higher. Inventory in many markets has dropped due to brisk sales. This tightening has driven some home prices even higher and caused bidding wars for some houses. The demand for homes, however, is uneven from city to city.
Realtor.com looked at the markets where homes are selling the fastest. Its analysis for June covers nearly 400 major metropolitan areas. The median number of days a home was on the market during the month was 37.0.
The market with the fastest home sales pace is Ogden-Clearfield, Utah where the median number of days on the market is 9.0. The northern Utah metro area has seen its population grow by 8.2% in the last five years, well more than double the U.S. growth rate of 2.9%. The median listing price is $497,775.
Click here to see the city where homes are selling fastest.
To determine the city where homes are selling the fastest, 24/7 Wall St. reviewed data on real estate from market site realtor.com, a subsidiary of Move, Inc. Metropolitan areas were ranked based on the median days on the market as of June 2021, the median number of days between the initial listing of a property and either its closing date or the date it is taken off the market. Data on median list price, median square footage, and number of active listings also came from realtor.com. Supplemental data on population and median household income came from the U.S. Census Bureau’s 2019 American Community Survey.
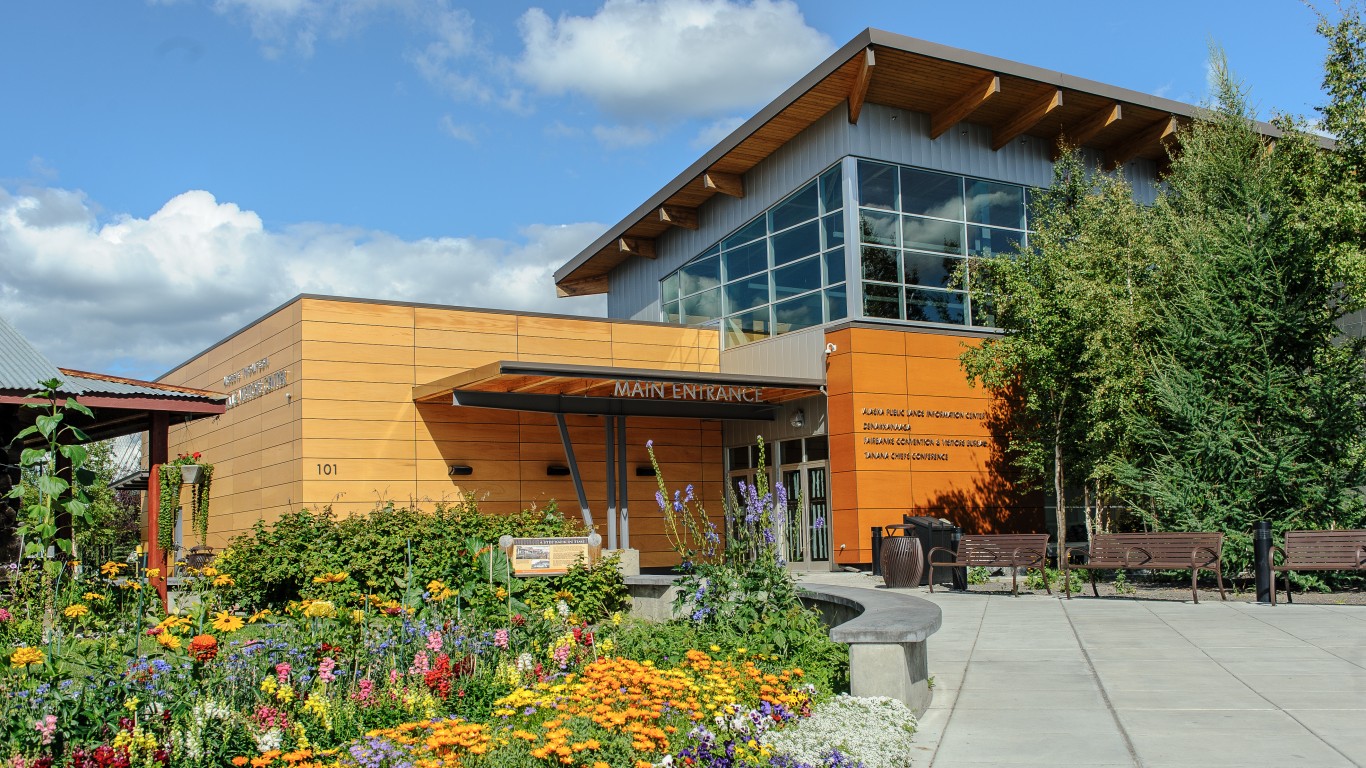
28. Fairbanks, AK (tied)
> Median days on market: 17.0
> Change in median days on market, June 2020 – June 2021: +7.1%
> Median listing price, June 2021: $249,950 (+7.1% from June 2020)
> 5-yr. population change -2.5%
[in-text-ad]

28. Logan, UT-ID (tied)
> Median days on market: 17.0
> Change in median days on market, June 2020 – June 2021: +56.0%
> Median listing price, June 2021: $529,950 (+56.0% from June 2020)
> 5-yr. population change +8.3%

28. Fresno, CA (tied)
> Median days on market: 17.0
> Change in median days on market, June 2020 – June 2021: +15.9%
> Median listing price, June 2021: $400,000 (+15.9% from June 2020)
> 5-yr. population change +3.4%

23. Portland-South Portland, ME (tied)
> Median days on market: 16.5
> Change in median days on market, June 2020 – June 2021: +14.0%
> Median listing price, June 2021: $472,900 (+14.0% from June 2020)
> 5-yr. population change +2.9%
[in-text-ad-2]

23. Worcester, MA-CT (tied)
> Median days on market: 16.5
> Change in median days on market, June 2020 – June 2021: +11.9%
> Median listing price, June 2021: $429,000 (+11.9% from June 2020)
> 5-yr. population change +1.8%
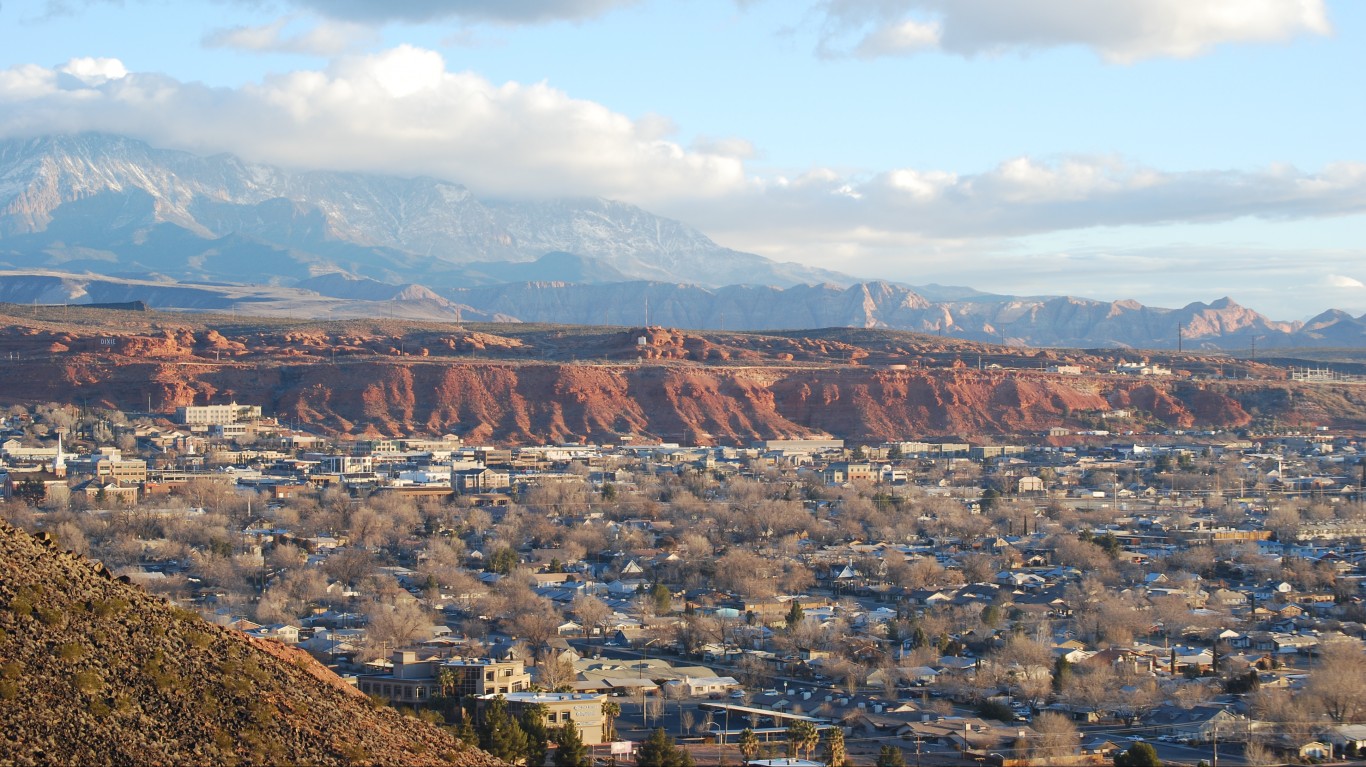
23. St. George, UT (tied)
> Median days on market: 16.5
> Change in median days on market, June 2020 – June 2021: +43.4%
> Median listing price, June 2021: $649,000 (+43.4% from June 2020)
> 5-yr. population change +16.9%
[in-text-ad]

23. Elkhart-Goshen, IN (tied)
> Median days on market: 16.5
> Change in median days on market, June 2020 – June 2021: -10.5%
> Median listing price, June 2021: $238,450 (-10.5% from June 2020)
> 5-yr. population change +2.2%

23. Jefferson City, MO (tied)
> Median days on market: 16.5
> Change in median days on market, June 2020 – June 2021: +0.0%
> Median listing price, June 2021: $199,900 (+0.0% from June 2020)
> 5-yr. population change +0.9%

21. Austin-Round Rock-Georgetown, TX (tied)
> Median days on market: 16.0
> Change in median days on market, June 2020 – June 2021: +34.4%
> Median listing price, June 2021: $523,950 (+34.4% from June 2020)
> 5-yr. population change +14.6%
[in-text-ad-2]
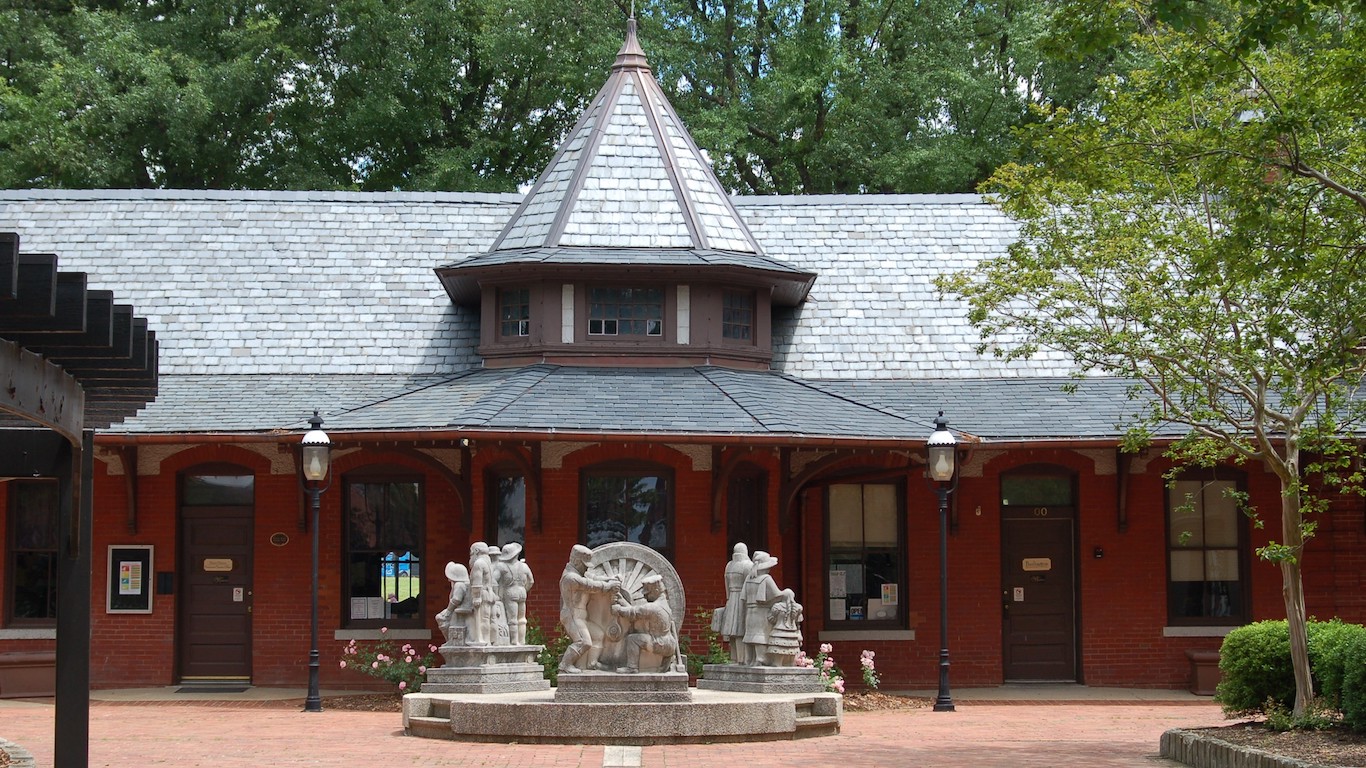
21. Burlington, NC (tied)
> Median days on market: 16.0
> Change in median days on market, June 2020 – June 2021: -1.1%
> Median listing price, June 2021: $279,230 (-1.1% from June 2020)
> 5-yr. population change +8.8%

19. Columbia, SC (tied)
> Median days on market: 15.5
> Change in median days on market, June 2020 – June 2021: +2.0%
> Median listing price, June 2021: $254,950 (+2.0% from June 2020)
> 5-yr. population change +4.8%
[in-text-ad]

19. Vallejo, CA (tied)
> Median days on market: 15.5
> Change in median days on market, June 2020 – June 2021: +16.1%
> Median listing price, June 2021: $577,000 (+16.1% from June 2020)
> 5-yr. population change +3.8%

14. Columbus, OH (tied)
> Median days on market: 15.0
> Change in median days on market, June 2020 – June 2021: -9.8%
> Median listing price, June 2021: $299,900 (-9.8% from June 2020)
> 5-yr. population change +6.4%

14. Rapid City, SD (tied)
> Median days on market: 15.0
> Change in median days on market, June 2020 – June 2021: +2.0%
> Median listing price, June 2021: $365,500 (+2.0% from June 2020)
> 5-yr. population change -1.2%
[in-text-ad-2]
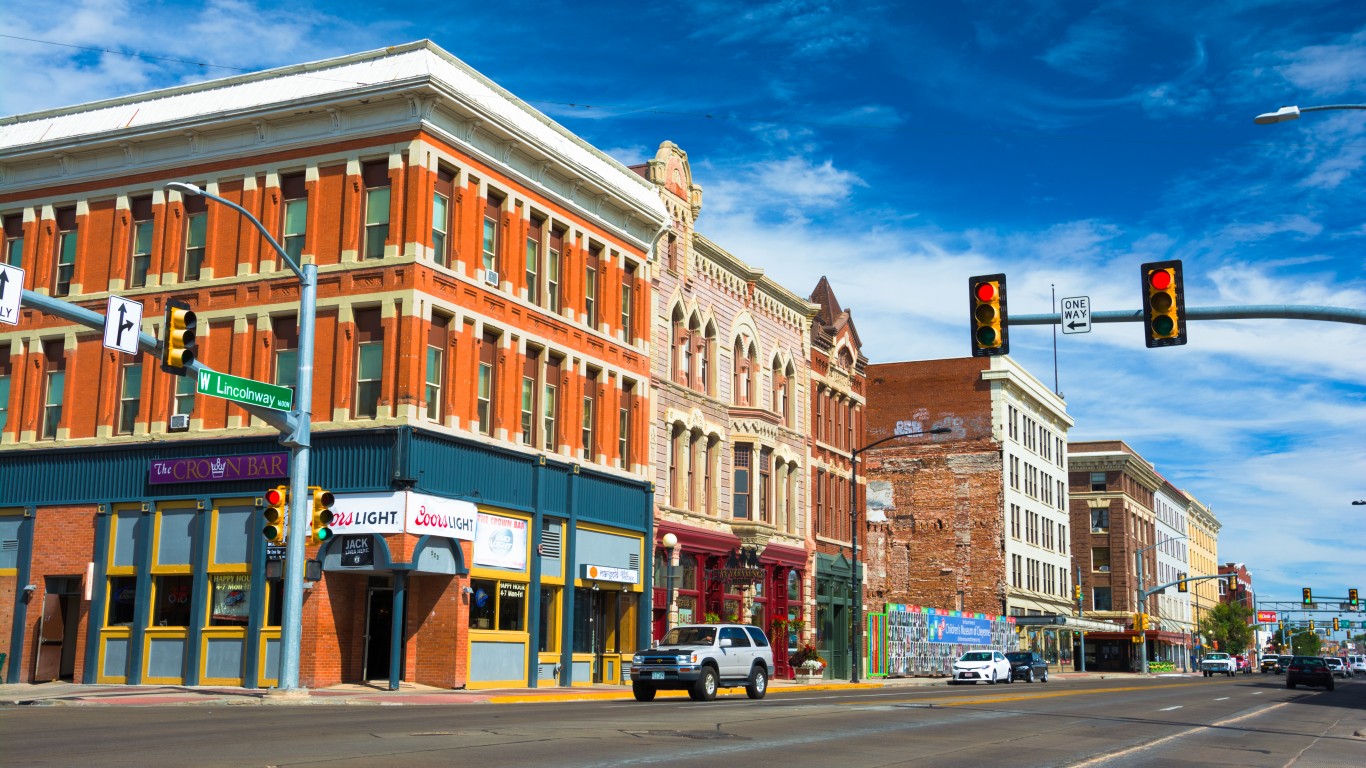
14. Cheyenne, WY (tied)
> Median days on market: 15.0
> Change in median days on market, June 2020 – June 2021: +10.1%
> Median listing price, June 2021: $407,450 (+10.1% from June 2020)
> 5-yr. population change +3.2%
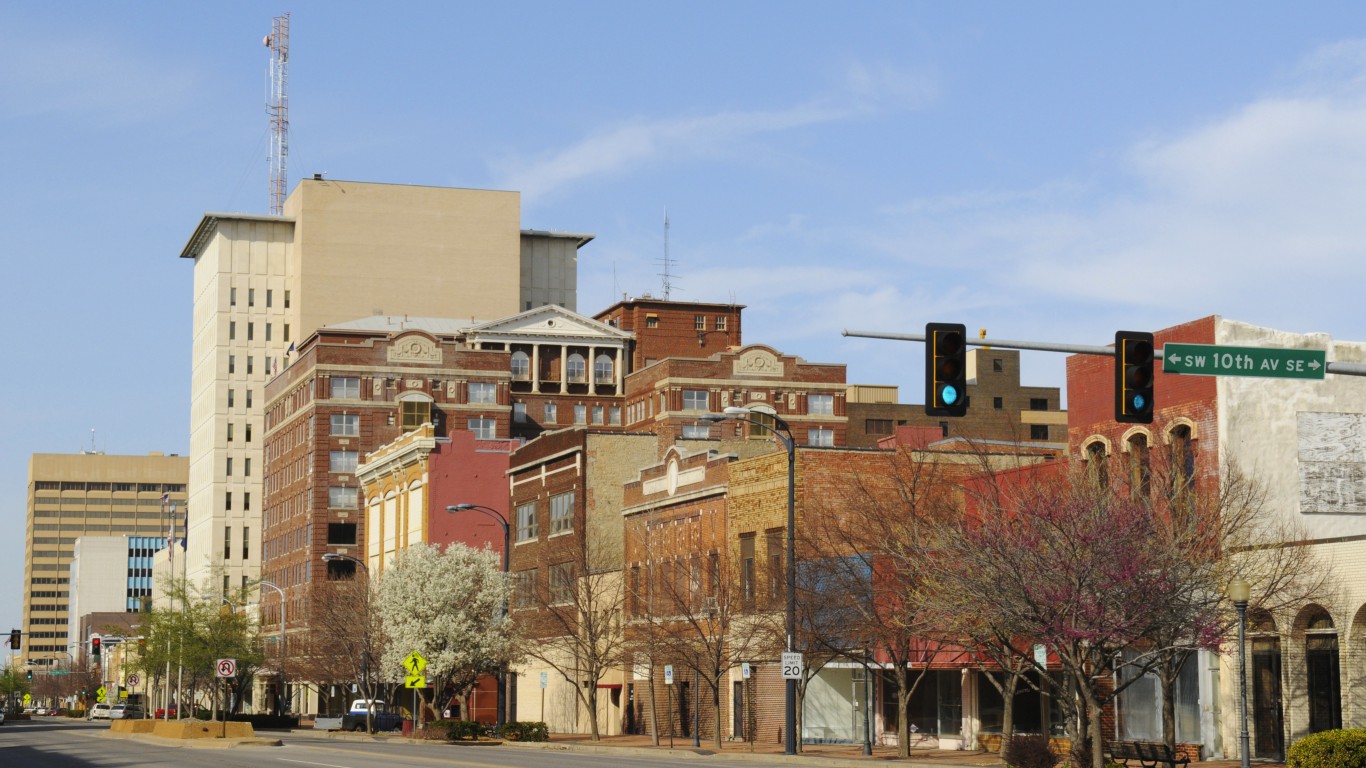
14. Topeka, KS (tied)
> Median days on market: 15.0
> Change in median days on market, June 2020 – June 2021: +4.9%
> Median listing price, June 2021: $159,950 (+4.9% from June 2020)
> 5-yr. population change -0.8%
[in-text-ad]

14. Raleigh-Cary, NC (tied)
> Median days on market: 15.0
> Change in median days on market, June 2020 – June 2021: +7.0%
> Median listing price, June 2021: $411,095 (+7.0% from June 2020)
> 5-yr. population change +11.9%

12. Nashville-Davidson–Murfreesboro–Franklin, TN (tied)
> Median days on market: 14.5
> Change in median days on market, June 2020 – June 2021: +10.2%
> Median listing price, June 2021: $429,900 (+10.2% from June 2020)
> 5-yr. population change +7.9%

12. Provo-Orem, UT (tied)
> Median days on market: 14.5
> Change in median days on market, June 2020 – June 2021: +25.7%
> Median listing price, June 2021: $550,000 (+25.7% from June 2020)
> 5-yr. population change +13.4%
[in-text-ad-2]

10. Lewiston-Auburn, ME (tied)
> Median days on market: 14.0
> Change in median days on market, June 2020 – June 2021: +7.0%
> Median listing price, June 2021: $262,000 (+7.0% from June 2020)
> 5-yr. population change +0.8%

10. Fort Wayne, IN (tied)
> Median days on market: 14.0
> Change in median days on market, June 2020 – June 2021: +1.0%
> Median listing price, June 2021: $238,750 (+1.0% from June 2020)
> 5-yr. population change -3.3%
[in-text-ad]

9. Denver-Aurora-Lakewood, CO
> Median days on market: 12.0
> Change in median days on market, June 2020 – June 2021: +9.8%
> Median listing price, June 2021: $599,516 (+9.8% from June 2020)
> 5-yr. population change +7.7%

6. Colorado Springs, CO (tied)
> Median days on market: 11.5
> Change in median days on market, June 2020 – June 2021: +4.2%
> Median listing price, June 2021: $494,940 (+4.2% from June 2020)
> 5-yr. population change +8.6%

6. Rochester, NY (tied)
> Median days on market: 11.5
> Change in median days on market, June 2020 – June 2021: -1.9%
> Median listing price, June 2021: $242,839 (-1.9% from June 2020)
> 5-yr. population change -1.3%
[in-text-ad-2]
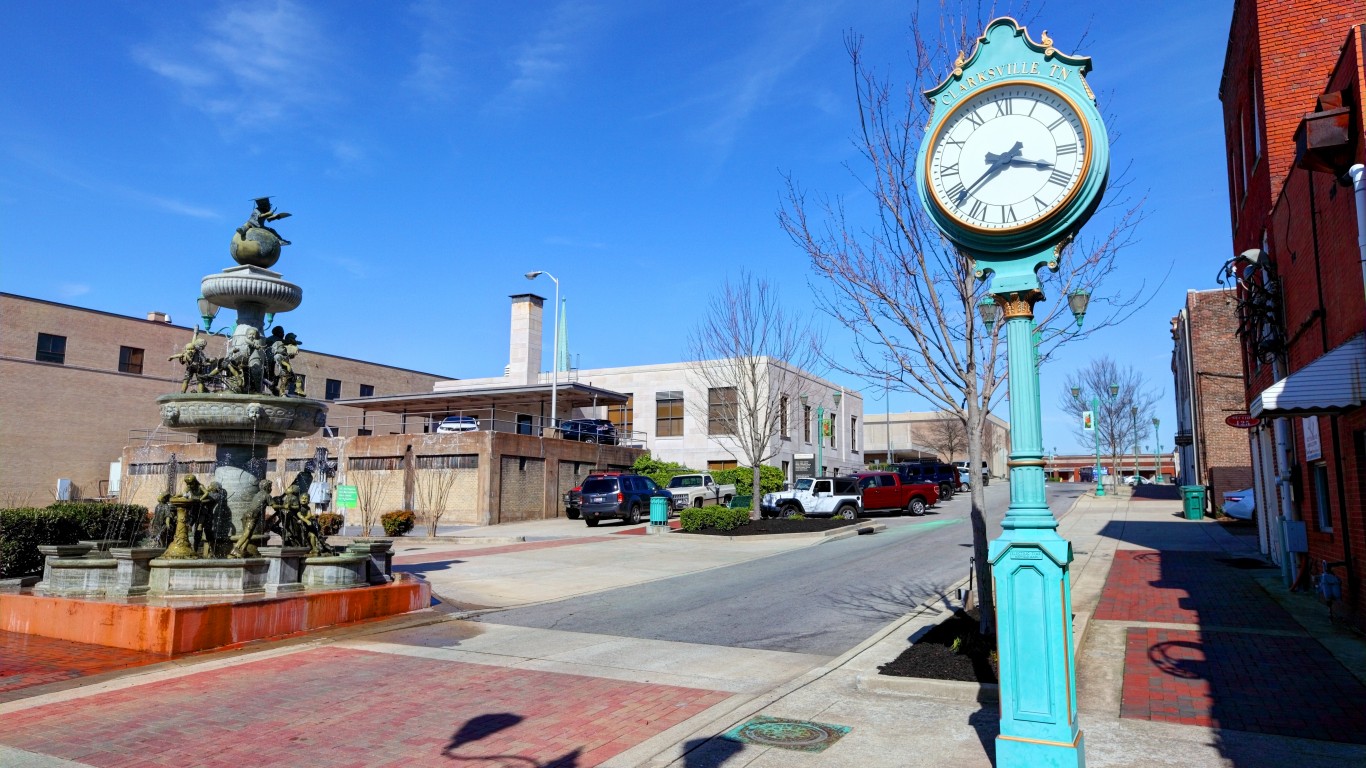
6. Clarksville, TN-KY (tied)
> Median days on market: 11.5
> Change in median days on market, June 2020 – June 2021: +8.5%
> Median listing price, June 2021: $287,450 (+8.5% from June 2020)
> 5-yr. population change +11.3%

4. Salt Lake City, UT (tied)
> Median days on market: 11.0
> Change in median days on market, June 2020 – June 2021: +15.7%
> Median listing price, June 2021: $569,950 (+15.7% from June 2020)
> 5-yr. population change +6.9%
[in-text-ad]

4. Huntsville, AL (tied)
> Median days on market: 11.0
> Change in median days on market, June 2020 – June 2021: +6.9%
> Median listing price, June 2021: $317,450 (+6.9% from June 2020)
> 5-yr. population change +7.0%

3. Idaho Falls, ID
> Median days on market: 10.5
> Change in median days on market, June 2020 – June 2021: +24.6%
> Median listing price, June 2021: $429,000 (+24.6% from June 2020)
> 5-yr. population change +9.5%

2. Manchester-Nashua, NH
> Median days on market: 10.0
> Change in median days on market, June 2020 – June 2021: +1.3%
> Median listing price, June 2021: $409,950 (+1.3% from June 2020)
> 5-yr. population change +2.9%
[in-text-ad-2]

1. Ogden-Clearfield, UT
> Median days on market: 9.0
> Change in median days on market, June 2020 – June 2021: +10.6%
> Median listing price, June 2021: $497,775 (+10.6% from June 2020)
> 5-yr. population change +8.2%
Thank you for reading! Have some feedback for us?
Contact the 24/7 Wall St. editorial team.