The U.S. may have the largest economy in the world, but in other key measures indicative of quality of life, it is far from number one. Based on the United Nations Development Programme’s Human Development Index, a tool used for gauging and comparing quality of life across geographies, the United States ranks as the 17th best country to live in worldwide.
While quality of life across the U.S. as a whole trails over a dozen other nations, there are parts of the country that, if analyzed through the lens of the HDI, would rank at or near the top of the list of the best places to live globally.
Inspired by the HDI, 24/7 Wall St. created an index consisting of three measures — life expectancy at birth, bachelor’s degree attainment, and poverty rate — to identify the best counties to live in in every state. Only independent cities, counties, and county equivalents with populations of 10,000 or more were considered.
In most cases, the county that ranks as the best place to live in in a given state excels in other socioeconomic measures beyond those used in the index. For example, all but a handful of counties on this list have lower unemployment than the state as a whole. Nearly every county also has a higher median household income than the state as a whole. The majority of counties on this list are also growing rapidly and are home to far more people today than five years ago. Here is a look at the fastest growing city in each state.
The counties on this list also often contain a major city or are in close proximity to one. Cities that are within commuting distance of counties on this list include Atlanta, Boston, Kansas City, Minneapolis, New York, San Francisco, and Washington D.C. These major urban areas have high concentrations of job opportunities that contribute to greater financial security among residents and require a well-educated workforce. Here is a look at the cities with the highest paying jobs.
Click here to see every state’s best county to live in.
Click here to see our detailed methodology.

Alabama: Shelby County
> Largest place in county: Hoover
> 5-yr. population change: +6.1% (state: +1.2%)
> Poverty rate: 7.5% (state: 16.7%)
> Adults with a bachelor’s degree: 42.9% (state: 25.5%)
> Life expectancy at birth: 80.7 years (state: 75.5 years)
Shelby County, Alabama, located just outside of downtown Birmingham, ranks as the best county to live in in the state. A college education is linked to longer life expectancies, greater financial security, and a stronger sense of control over one’s life — and in Shelby County, 42.9% of the adult population have a bachelor’s degree, the largest share of any of Alabama’s 67 counties. Additionally, with a life expectancy at birth of 80.7 years, half a decade longer than the average across Alabama, Shelby County also has some of the best health outcomes in the state.
Located in the foothills of the Appalachian Mountains, Shelby County offers a range of outdoor recreation activities as well as access to places like Oak Mountain State Park and the Heart of Dixie Railroad Museum.
[in-text-ad]

Alaska: Juneau City and Borough
> Largest place in borough: Juneau
> 5-yr. population change: +0.1% (state: +1.2%)
> Poverty rate: 7.7% (state: 10.7%)
> Adults with a bachelor’s degree: 38.4% (state: 29.6%)
> Life expectancy at birth: 81.1 years (state: 79.0 years)
The borough of Juneau, conterminous with the city of Juneau, the state capital, ranks as the best place to live in in Alaska. Life expectancy in the borough is 81.1 years, over two years longer than the statewide average. Juneau residents are also less likely to live below the poverty line and more likely to have a four-year college degree than the typical Alaskan.
Juneau residents have access to a variety of outdoor recreation, including the Tongass National Rainforest that surrounds the city. With a range of sectors including government, maritime, research and development, mining, visitor services, and health care, the local unemployment rate of 5.1% is considerably lower than the 6.6% jobless rate across the state.

Arizona: Maricopa County
> Largest place in county: Phoenix
> 5-yr. population change: +9.7% (state: +7.4%)
> Poverty rate: 13.8% (state: 15.1%)
> Adults with a bachelor’s degree: 32.7% (state: 29.5%)
> Life expectancy at birth: 80.5 years (state: 80.0 years)
Home to the city of Phoenix, Maricopa is by the most populous county in Arizona — and also the best to live in in the state. One reason for the county’s rank is the area’s relatively low poverty rate of 13.8%, which is nearly the lowest of any county in the state and well below the 15.1% poverty rate in Arizona. Additionally, at 80.5 years, life expectancy in the county is half a year longer than it is across the state as whole.
As is often the case in areas with similarly strong socioeconomic indicators, Maricopa County is growing rapidly. Over the last five years, the number of people living in the county increased by 9.7%, faster than the 7.4% growth across Arizona as a whole.

Arkansas: Benton County
> Largest place in county: Rogers
> 5-yr. population change: +14.3% (state: +1.8%)
> Poverty rate: 9.4% (state: 17.0%)
> Adults with a bachelor’s degree: 33.4% (state: 23.0%)
> Life expectancy at birth: 79.9 years (state: 76.0 years)
Benton County, Arkansas, ranks as the best county to live in in the state. Only 9.4% of the local population live below the poverty line, well below the 17.0% poverty rate across Arkansas. The area’s relative financial security is due in part to a strong job market, as only 3.1% of the local labor force are unemployed, compared to the 4.4% state and 5.8% national jobless rates. Walmart alone employs over 14,000 people at its corporate headquarters in the area.
As is often the case, Arkansas’ best county to live in is also the fastest growing in the state. Over the last five years, the number of people living in Benton County has climbed by 14.3%, many times faster than the comparable 1.8% population growth across Arkansas.
[in-text-ad-2]

California: Marin County
> Largest place in county: San Rafael
> 5-yr. population change: +1.2% (state: +3.2%)
> Poverty rate: 7.2% (state: 13.4%)
> Adults with a bachelor’s degree: 59.5% (state: 33.9%)
> Life expectancy at birth: 85.4 years (state: 81.7 years)
Marin County, California, ranks as the best county to live in in the state and one of the best places to live nationwide. Life expectancy at birth in the coastal county, located just across the Golden Gate Bridge from San Francisco, is 85.4 years, well above both the state and national averages of 81.7 years and 79.2 years, respectively.
Health outcomes tend to be better in areas with well educated, financially secure populations. In Marin County, 59.5% of adults have a bachelor’s degree or higher, and only 7.2% of the population live below the poverty line, compared to California’s 33.9% bachelor’s degree attainment rate and 13.4% poverty rate.

Colorado: Pitkin County
> Largest place in county: Aspen
> 5-yr. population change: +3.6% (state: +7.9%)
> Poverty rate: 6.7% (state: 10.3%)
> Adults with a bachelor’s degree: 60.8% (state: 40.9%)
> Life expectancy at birth: 94.4 years (state: 80.6 years)
Pitkin County, Colorado, located southwest of Denver in the Rocky Mountains, ranks as the best county to live in in the state. With an estimated life expectancy at birth of 94.4 years — 15 years longer than the national average — the county has one of the healthiest populations in the United States. Health outcomes tend to be better in areas with well educated, financially secure populations. In Pitkin County, 60.8% of adults have a bachelor’s degree or higher, and only 6.7% of the population live below the poverty line, compared to Colorado’s 40.9% bachelor’s degree attainment rate and 10.3% poverty rate.
Home to the ski resort town of Aspen, Pitkin County is a destination for wealthy Americans as well as outdoor enthusiasts. Recreational opportunities in the area include hiking, climbing, boating, fishing and more.
[in-text-ad]

Connecticut: Fairfield County
> Largest place in county: Bridgeport
> 5-yr. population change: +1.0% (state: -0.5%)
> Poverty rate: 8.9% (state: 9.9%)
> Adults with a bachelor’s degree: 47.9% (state: 39.3%)
> Life expectancy at birth: 83.0 years (state: 80.9 years)
Fairfield County, located along Long Island Sound in the southwestern corner of Connecticut, ranks as the best place to live in in the state. Life expectancy at birth in the county is 83 years, two years above the statewide average. Additionally, only 8.9% of county residents live below the poverty line, compared to 9.9% of the state population. Fairfield is within commuting distance of New York City and one of the largest job markets in the country, and partially as a result, the local unemployment rate of 5.8% is well below the 8.1% statewide jobless rate.
Of the eight counties in Connecticut, Fairfield is the only one that is growing. Over the last five years, the number of people living in Connecticut declined by 0.5%, while Fairfield County’s population expanded by 1.0%.
Delaware: New Castle County
> Largest place in county: Wilmington
> 5-yr. population change: +1.9% (state: +4.4%)
> Poverty rate: 11.4% (state: 11.8%)
> Adults with a bachelor’s degree: 36.2% (state: 32.0%)
> Life expectancy at birth: 78.4 years (state: 78.5 years)
A geographically small state, Delaware has only three counties. As a result, even though New Castle County ranks as the best county to live in in the state, the county’s advantage over the state as a whole in several key socioeconomic indicators is not especially pronounced. The county’s poverty rate of 11.4% is only slightly lower than the 11.8% state rate. Additionally, at 78.4 years, life expectancy at birth in New Castle County is slightly lower than the 78.5 year average across Delaware.
However, adults living in New Castle are considerably more likely to have a four-year college degree than the typical adult in Delaware. An estimated 36.2% of the county’s 25 and older population have a bachelor’s degree compared to 32.0% of the state’s 25 and older population.

Florida: St. Johns County
> Largest place in county: Fruit Cove
> 5-yr. population change: +20.3% (state: +8.0%)
> Poverty rate: 8.2% (state: 14.0%)
> Adults with a bachelor’s degree: 44.7% (state: 29.9%)
> Life expectancy at birth: 81.9 years (state: 80.2 years)
St. Johns County is located just south of Jacksonville along Florida’s Atlantic coast. With a well-educated, healthy, and financially secure population, it ranks as the best county to live in in the state. An estimated 44.7% of the county’s adult population have a bachelor’s degree or higher, compared to 29.9% of all adults in Florida. Financial security and health outcomes tend to improve with educational attainment, and in St. Johns County only 8.2% of the population live below the poverty line, compared to 14.0% of all Florida residents, and at 81.9 years, life expectancy at birth is nearly two years longer than it is across the state.
As is often the case in areas with similarly positive socioeconomic indicators, St. Johns County is growing rapidly. Over the last five years, the number of people living in the county increased by 20.3%, outpacing Florida’s 8.0% population growth.
[in-text-ad-2]

Georgia: Forsyth County
> Largest place in county: Cumming
> 5-yr. population change: +20.6% (state: +5.0%)
> Poverty rate: 5.7% (state: 15.1%)
> Adults with a bachelor’s degree: 53.1% (state: 31.3%)
> Life expectancy at birth: 82.3 years (state: 77.9 years)
Forsyth County, located in north-central Georgia, ranks as the best county to live in in the state. Located within the Atlanta metropolitan area, local residents have access to employment opportunities in one of the largest cities in the United States, and partially as a result, the local unemployment rate of 2.5% is well below the 4.1% statewide rate. Job availability also means residents are less likely to struggle financially than most Georgia residents. The county’s poverty rate of 5.7% is nearly one-third the 15.1% poverty rate across Georgia.
Conditions associated with poverty can contribute to negative health outcomes, while health outcomes tend to improve with education. These factors may help explain why Forsyth County’s population appears to be far healthier than average. Life expectancy at birth in the county is 82.3 years, over four years longer than the average across the state.

Hawaii: Honolulu County
> Largest place in county: Honolulu
> 5-yr. population change: +0.9% (state: +2.1%)
> Poverty rate: 8.3% (state: 9.4%)
> Adults with a bachelor’s degree: 35.0% (state: 33.0%)
> Life expectancy at birth: 82.5 years (state: 82.3 years)
Hawaii is a geographically small state consisting of only five counties, and as a result, variation in socioeconomic outcomes between a given county and the state as a whole are relatively small. Still, based on several key measures, Honolulu County, coterminous with the Island of O’ahu, ranks ahead the other counties in the state.
The local poverty rate of 8.3% is nearly the lowest among the counties in Hawaii and slightly below the 9.4% state poverty rate. Additionally, at 82.5 years, life expectancy at birth in the county is slightly higher than the statewide average life expectancy of 82.3 years.
[in-text-ad]

Idaho: Teton County
> Largest place in county: Victor
> 5-yr. population change: +11.9% (state: +7.4%)
> Poverty rate: 4.5% (state: 13.1%)
> Adults with a bachelor’s degree: 41.0% (state: 27.6%)
> Life expectancy at birth: 83.8 years (state: 79.4 years)
Teton County, located in southeastern Idaho along the Wyoming border, ranks as the best county to live in in the state. Idaho is one of the fastest growing states in the country, reporting 7.4% population growth over the last five years. In Teton County, population growth is even more rapid, as the county expanded by 11.9% over the same period.
With a local poverty rate of 4.5%, Teton County residents are less than half as likely to face serious financial hardship than the typical resident of Idaho, where the poverty rate stands at 13.1%. Life expectancy in Teton County is also 83.8 years, about four and a half years longer than the state average.
Illinois: DuPage County
> Largest place in county: Naperville
> 5-yr. population change: +0.3% (state: -0.8%)
> Poverty rate: 6.4% (state: 12.5%)
> Adults with a bachelor’s degree: 49.4% (state: 34.7%)
> Life expectancy at birth: 82.5 years (state: 79.4 years)
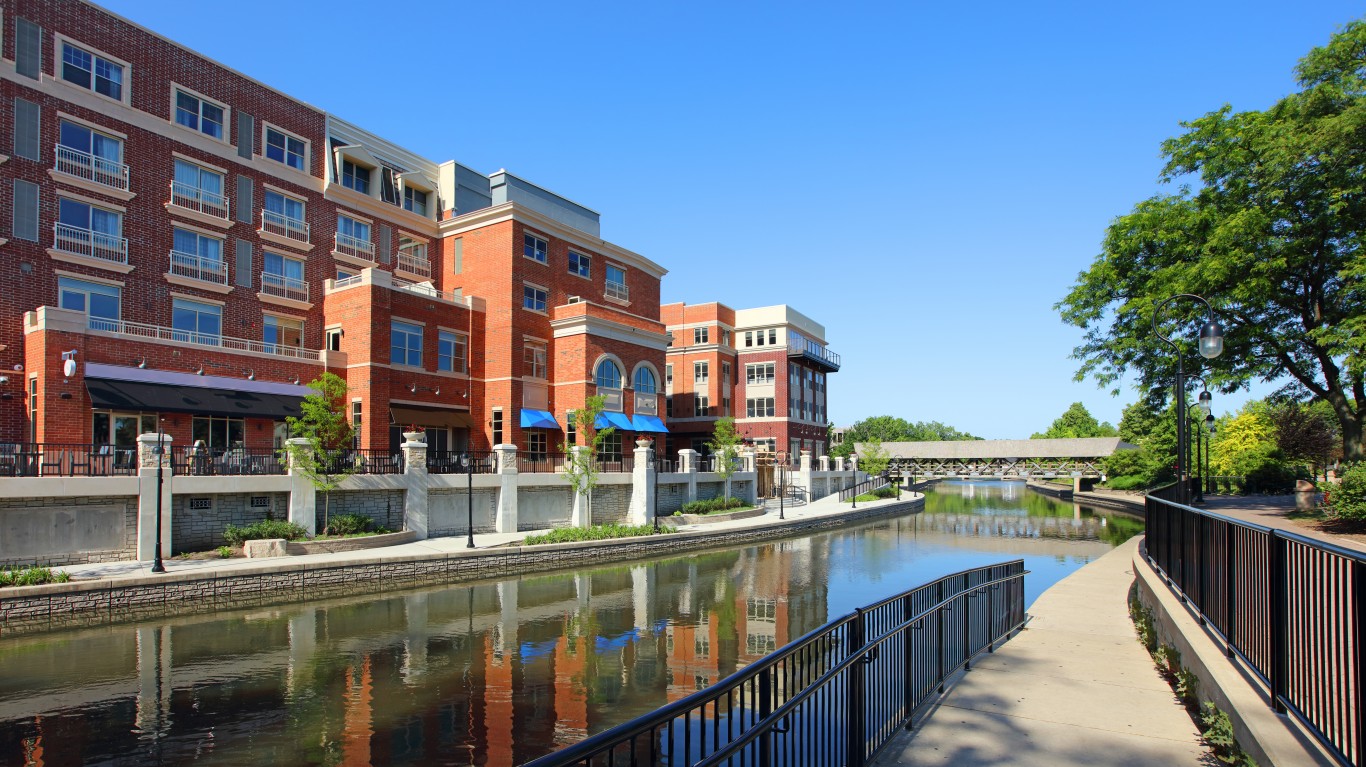
DuPage County, located just west of downtown Chicago, ranks as the best county to live in in Illinois. An estimated 49.4% of adults in the county have a bachelor’s degree, the largest share of any of the 102 counties in the state.
With a well-educated labor force and access to jobs in the largest city in the Midwest, the unemployment rate in DuPage County is only 5.5%, well below the 7.1% rate across Illinois. High quality of life in DuPage is also evidenced by a low poverty rate. Only 6.4% of the local population live below the poverty line, nearly half the 12.5% poverty rate across Illinois.

Indiana: Hamilton County
> Largest place in county: Carmel
> 5-yr. population change: +11.5% (state: +1.9%)
> Poverty rate: 4.6% (state: 13.4%)
> Adults with a bachelor’s degree: 59.3% (state: 26.5%)
> Life expectancy at birth: 82.0 years (state: 77.1 years)
Hamilton County, Indiana, ranks as the best county to live in in the state, partially because its 4.6% poverty rate is the lowest of the 92 counties in Indiana and less than one-third the 13.4% state poverty rate. Also, at 82 years, life expectancy in the county is nearly five years longer than the state average. Health outcomes and financial security tend to improve with educational attainment, and in Hamilton County 59.3% of the adult population have a bachelor’s degree, more than double the 26.5% share of adults across Indiana who do.
Like many counties with similarly strong socioeconomic indicators, Hamilton is in close proximity to a major city and is growing rapidly. Located north of Indianapolis, well within commuting distance, Hamilton County’s population has grown by 11.5% over the last five years, compared to the 1.9% statewide population growth.
[in-text-ad-2]
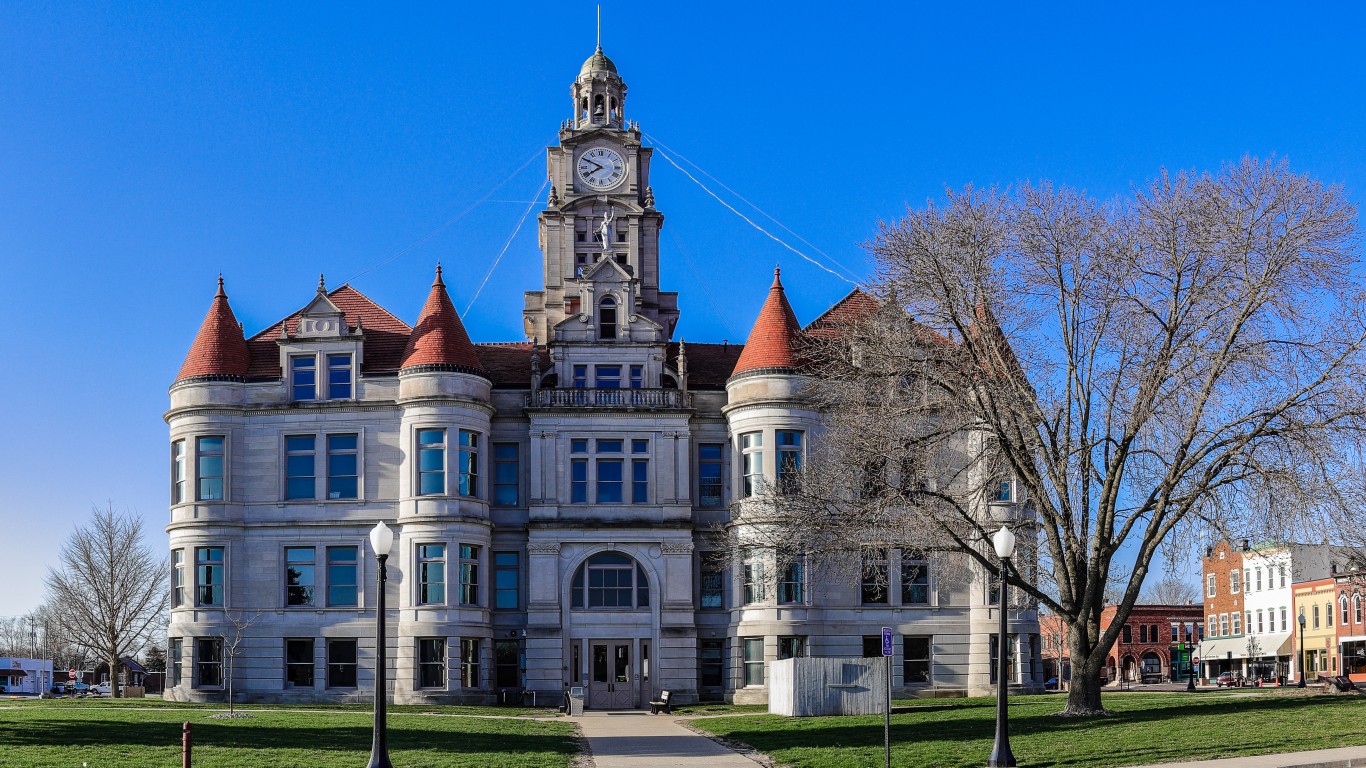
Iowa: Dallas County
> Largest place in county: Waukee
> 5-yr. population change: +20.8% (state: +2.0%)
> Poverty rate: 5.2% (state: 11.5%)
> Adults with a bachelor’s degree: 50.4% (state: 28.6%)
> Life expectancy at birth: 82.3 years (state: 79.4 years)
Due to a number of key socioeconomic indicators, Dallas County, located just west of Des Moines, ranks as the best county to live in in Iowa. The local poverty rate of 5.2% is less than half the 11.5% poverty rate across the state. Additionally, at 82.3 years, life expectancy at birth in the county is nearly three years greater than it is in Iowa as a whole.
Not only is Dallas County the best of the 99 counties to live in in Iowa, it is also the fastest growing. Over the last five years, the number of people living in the county increased by 20.8% — 10 times faster than the 2.0% population growth across all of Iowa.

Kansas: Johnson County
> Largest place in county: Overland Park
> 5-yr. population change: +5.6% (state: +1.0%)
> Poverty rate: 5.4% (state: 12.0%)
> Adults with a bachelor’s degree: 56.0% (state: 33.4%)
> Life expectancy at birth: 81.7 years (state: 78.5 years)
Johnson County, Kansas, located in the Kansas City metropolitan area, ranks as the best county to live in in the state. An estimated 56% of adults in the area have a bachelor’s degree or higher, well above the 33.4% share of adults across the state.
Health outcomes and financial security tend to improve with educational attainment, both at an individual level and across populations. In Johnson County, life expectancy at birth is nearly 82 years, three years greater than the state average. Additionally, the local poverty rate of 5.4% is less than half the 12.0% statewide rate.
[in-text-ad]

Kentucky: Oldham County
> Largest place in county: La Grange
> 5-yr. population change: +6.9% (state: +1.5%)
> Poverty rate: 5.9% (state: 17.3%)
> Adults with a bachelor’s degree: 42.4% (state: 24.2%)
> Life expectancy at birth: 79.8 years (state: 75.6 years)
Kentucky is one of the poorest states in the country, with a poverty rate of 17.3%. Not all parts of the state have such high rates of financial insecurity, however. In Oldham County, only 5.9% of the population live below the poverty line. The reduced likelihood of financial insecurity is likely due in part to greater educational attainment. An estimated 42.4% of the county’s adult population have a bachelor’s degree, well above the 24.2% bachelor’s degree attainment rate statewide.
The best county to live in in the state, Oldham is growing rapidly. The county, located just outside of Louisville, has grown by 6.9% in the last five years, over four times faster than the 1.5% statewide population growth over the same period.

Louisiana: St. Tammany Parish
> Largest place in parish: Slidell
> 5-yr. population change: +6.4% (state: +1.4%)
> Poverty rate: 11.5% (state: 19.2%)
> Adults with a bachelor’s degree: 33.8% (state: 24.1%)
> Life expectancy at birth: 78.3 years (state: 76.1 years)
St. Tammany Parish, Louisiana, located just across Lake Pontchartrain from New Orleans, ranks as the best parish to live in in the state. While the poverty rate across Louisiana of 19.2% is well above the 13.4% national rate, in St. Tammany, 11.5% of the population live below the poverty line.
Conditions associated with poverty can contribute to negative health outcomes, and the greater financial security in St. Tammany Parish may partially explain why the population appears to be far healthier than average. Life expectancy at birth in the area is 78.3 years, over two years longer than the average across the state.

Maine: Cumberland County
> Largest place in county: Portland
> 5-yr. population change: +2.8% (state: +0.5%)
> Poverty rate: 9.0% (state: 11.8%)
> Adults with a bachelor’s degree: 47.6% (state: 31.8%)
> Life expectancy at birth: 80.2 years (state: 78.7 years)
Cumberland County, which encompasses the city of Portland along the Atlantic coast, ranks as the best county to live in in Maine. The best educated county in the state, 47.6% of adults in the area have a bachelor’s degree, compared to 31.8% of all adults in Maine who do.
Health outcomes and financial security tend to improve with educational attainment, both at an individual level and across populations. In Cumberland County, life expectancy at birth is 80.2 years, over a year greater than the state average. Additionally, the local poverty rate of 9.0% is considerably lower than the 11.8% statewide rate.
[in-text-ad-2]

Maryland: Howard County
> Largest place in county: Columbia
> 5-yr. population change: +6.5% (state: +2.2%)
> Poverty rate: 5.0% (state: 9.2%)
> Adults with a bachelor’s degree: 62.6% (state: 40.2%)
> Life expectancy at birth: 83.2 years (state: 79.2 years)
Howard County, located in central Maryland between Baltimore and Washington D.C., ranks as the best county to live in in the state. An estimated 62.6% of adults in the county have a bachelor’s degree, the largest share of any of the 24 counties and county equivalents in the state. With a well-educated labor force and access to jobs in two major cities, only 4.4% of the Howard County labor force are unemployed, well below the 6.1% Maryland jobless rate.
As is typically the case in well-educated areas with low unemployment, Howard County residents are generally financially secure. Only 5.0% of the population live below the poverty line, compared to 9.2% of the state population.

Massachusetts: Middlesex County
> Largest place in county: Lowell
> 5-yr. population change: +4.0% (state: +2.9%)
> Poverty rate: 7.4% (state: 10.3%)
> Adults with a bachelor’s degree: 56.3% (state: 43.7%)
> Life expectancy at birth: 82.4 years (state: 80.6 years)
Middlesex County, located north of Boston, stretching from Cambridge up to the New Hampshire border, ranks as the best county to live in in the state. The county is home to several colleges and universities, including Harvard and MIT, and also has one of the best-educated populations in the country. An estimated 56.3% of the local adult population have a bachelor’s degree or higher, compared to 43.7% of adults in Massachusetts and 32.1% of American adults.
Health outcomes and financial security tend to improve with educational attainment, both at an individual level and across populations. In Middlesex County, life expectancy at birth is 82.4 years, nearly two years greater than the state average. Additionally, the local poverty rate of 7.4% is considerably lower than the 10.3% statewide rate.
[in-text-ad]

Michigan: Leelanau County
> Largest place in county: Greilickville
> 5-yr. population change: -0.4% (state: +0.8%)
> Poverty rate: 6.1% (state: 14.4%)
> Adults with a bachelor’s degree: 44.7% (state: 29.1%)
> Life expectancy at birth: 82.7 years (state: 78.1 years)
Leelanau County, Michigan, extends into Lake Michigan in the northeastern part of the Lower Peninsula, just outside of Traverse City. The county’s poverty rate of 6.1% is less than half the statewide rate of 14.4%. Additionally, at 82.7 years, life expectancy at birth is the highest of all of Michigan’s 83 counties and nearly five years above the state average.
Despite ranking as the best county to live in in the state, Leelanau County is shrinking. Over the last five years, the number of people living there has contracted by 0.4%, even as Michigan’s population expanded by 0.8%.

Minnesota: Carver County
> Largest place in county: Chaska
> 5-yr. population change: +8.2% (state: +3.3%)
> Poverty rate: 4.1% (state: 9.7%)
> Adults with a bachelor’s degree: 48.9% (state: 36.1%)
> Life expectancy at birth: 83.3 years (state: 80.9 years)
Carver County, Minnesota, ranks as the best county to live in in the state, partially because its 4.1% poverty rate is the lowest of the 87 counties in Minnesota and less than half the 9.7% state poverty rate. At 83.3 years, life expectancy in the county is also over two years longer than the state average. Health outcomes and financial security tend to improve with educational attainment, and in Carver County, 48.9% of the adult population have a bachelor’s degree, well above the 36.1% share of adults across Minnesota who do.
Like many counties with similarly strong socioeconomic indicators, Carver is in close proximity to a major city and is growing rapidly. Located southwest of downtown Minneapolis, well within commuting distance, Carver County’s population has grown by 8.2% over the last five years, compared to the 3.3% statewide population growth.

Mississippi: Madison County
> Largest place in county: Madison
> 5-yr. population change: +6.0% (state: +0.002%)
> Poverty rate: 9.6% (state: 20.3%)
> Adults with a bachelor’s degree: 48.4% (state: 22.0%)
> Life expectancy at birth: 76.5 years (state: 74.9 years)
Mississippi is the only state in the country where more than one in every five people live below the poverty line. Though it ranks as the poorest state, not all parts of Mississippi are home to widespread financial hardship. In Madison County, located just north of Jackson, the state capital, 9.6% of the population live below the poverty line, less than half the state poverty rate, and well below the 13.4% national poverty rate. Partially as a result, Madison ranks as the best county to live in in the state.
The likelihood of poverty is considerably lower for Americans with a college education, and in Madison County, 48.4% of the adult population have a bachelor’s degree, the largest share of all 82 counties in Mississippi and more than double the statewide bachelor’s degree attainment rate of 22.0%.
[in-text-ad-2]

Missouri: Platte County
> Largest place in county: Kansas City
> 5-yr. population change: +9.3% (state: +1.3%)
> Poverty rate: 6.2% (state: 13.7%)
> Adults with a bachelor’s degree: 43.1% (state: 29.2%)
> Life expectancy at birth: 80.2 years (state: 77.3 years)
Platte County, located in northwestern Missouri within the Kansas City metropolitan area, ranks as the best county to live in in the state. The local 6.2% poverty rate is less than half the 13.7% poverty rate across the state as a whole. Greater educational attainment can reduce the likelihood of poverty, and in Platte County, 43.1% of the adult population have a bachelor’s degree, compared to less than 30% of adults in the state.
Counties with favorable socioeconomic conditions typically have faster than average population growth rates — and Platte County is no exception. The number of people living in the area expanded by 9.3% over the last five years, while the state’s population grew by just 1.3% over the same period.

Montana: Gallatin County
> Largest place in county: Bozeman
> 5-yr. population change: +16.1% (state: +4.4%)
> Poverty rate: 11.3% (state: 13.1%)
> Adults with a bachelor’s degree: 50.1% (state: 32.0%)
> Life expectancy at birth: 82.6 years (state: 78.9 years)
Gallatin County, which includes the city of Bozeman, ranks as the best county to live in in Montana. Of all 56 counties in the state, Gallatin is the only one where over half of all adults have a four-year college degree or higher. Health outcomes tend to improve with educational attainment, and life expectancy at birth in Gallatin County is 82.6 years, nearly four years longer than the state average.
Counties with favorable socioeconomic conditions typically have faster than average population growth rates — and Gallatin County is no exception. The number of people living in the area expanded by 16.1% over the last five years, while the state’s population grew by just 4.4% over the same period.
[in-text-ad]

Nebraska: Sarpy County
> Largest place in county: Bellevue
> 5-yr. population change: +9.2% (state: +3.2%)
> Poverty rate: 5.9% (state: 11.1%)
> Adults with a bachelor’s degree: 39.8% (state: 31.9%)
> Life expectancy at birth: 81.3 years (state: 79.6 years)
Sarpy County, Nebraska, ranks as the best county to live in in the state. The best educated of all 93 counties and county equivalents in Nebraska, Sarpy County’s bachelor’s degree attainment rate of 39.8% is well above the 31.9% state average. County residents are about half as likely to live below the poverty line as the typical Nebraska resident, and life expectancy at birth in the county is 81.3 years, nearly two years longer than the state average.
Like many counties with similarly strong socioeconomic indicators, Sarpy is in close proximity to a major city and is growing rapidly. Located south of downtown Omaha, well within commuting distance, Sarpy County’s population has grown by 9.2% over the last five years, compared to the 3.2% statewide population growth.

Nevada: Douglas County
> Largest place in county: Gardnerville Ranchos
> 5-yr. population change: +2.1% (state: +7.6%)
> Poverty rate: 8.7% (state: 13.1%)
> Adults with a bachelor’s degree: 29.4% (state: 24.7%)
> Life expectancy at birth: 80.7 years (state: 78.7 years)
Of the 17 counties and equivalents in Nevada, Douglas County, located just south of Carson City along Lake Tahoe, ranks as the best to live in. At 80.7 years, life expectancy in Douglas County is two years higher than it is across Nevada as a whole.
Residents of Douglas County are also more likely to be financially secure than the typical Nevada resident. The county’s poverty rate of 8.7% is well below the 13.1% poverty rate in Nevada.

New Hampshire: Rockingham County
> Largest place in county: Derry
> 5-yr. population change: +2.9% (state: +2.0%)
> Poverty rate: 4.6% (state: 7.6%)
> Adults with a bachelor’s degree: 41.4% (state: 37.0%)
> Life expectancy at birth: 80.9 years (state: 79.7 years)
Rockingham County, located along New Hampshire’s only stretch of Atlantic coastline between Massachusetts and Maine, ranks as the best county in the state to live in.
Of all 10 counties in New Hampshire, Rockingham’s population is the healthiest, best educated, and most financially secure. Life expectancy at birth in the county is 80.9 years, over a year longer than the state average, and the county’s poverty rate of 4.6% is well below the 7.6% statewide rate. Both life expectancy and financial security tend to improve with educational attainment, and in Rockingham County, 41.4% of adults have a bachelor’s degree, compared to 37.0% of adults in New Hampshire.
[in-text-ad-2]
New Jersey: Hunterdon County
> Largest place in county: Flemington
> 5-yr. population change: -1.5% (state: +0.05%)
> Poverty rate: 4.5% (state: 10.0%)
> Adults with a bachelor’s degree: 52.7% (state: 39.7%)
> Life expectancy at birth: 83.5 years (state: 80.5 years)
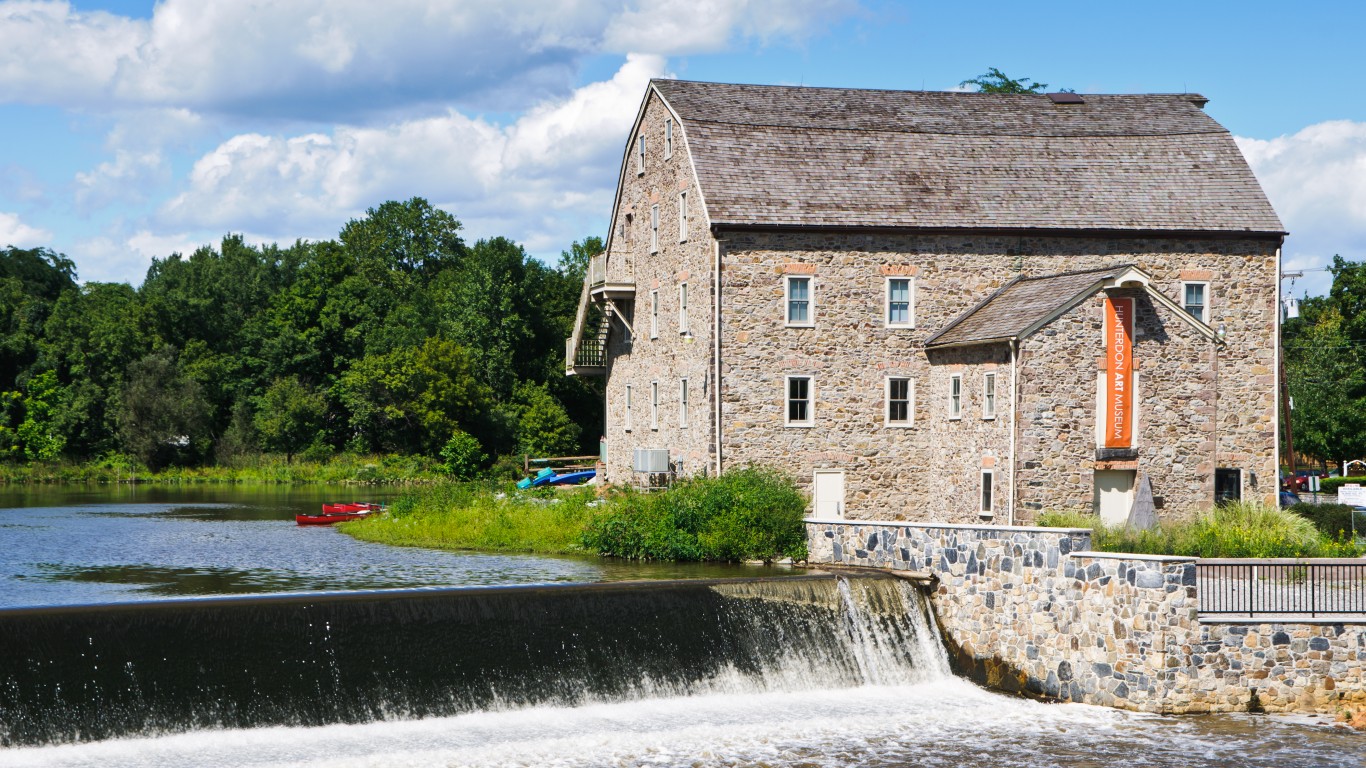
Life expectancy at birth in Hunterdon County, New Jersey, is 83.5 years, three years longer than the state average. The county, located directly west of New York City partially along the Pennsylvania state border, also has a 4.5% poverty rate, which is the lowest of any county in New Jersey and less than half the 10.0% poverty rate across the state.
Despite ranking as the best county to live in in the state, Hunterdon County is shrinking. Over the last five years, the number of people living there has declined by 1.5%.

New Mexico: Los Alamos County
> Largest place in county: Los Alamos
> 5-yr. population change: +3.6% (state: +0.6%)
> Poverty rate: 4.4% (state: 19.1%)
> Adults with a bachelor’s degree: 67.4% (state: 27.3%)
> Life expectancy at birth: 83.8 years (state: 78.0 years)
Los Alamos County leads New Mexico in several key socioeconomic indicators. Of the 33 counties in the state, Los Alamos’ population is the healthiest, best educated, and most financially secure. Life expectancy at birth in the county is 83.8 years, over five years longer than the state average, and the county’s poverty rate of 4.4% is a fraction of the 19.1% statewide rate. Both life expectancy and financial security tend to improve with educational attainment, and in Los Alamos County, 67.4% of adults have a bachelor’s degree, compared to 27.3% of adults in New Mexico.
The county’s local economy is supported by the Los Alamos National Laboratory. The lab, funded by the federal government, has a $3.9 billion annual budget and employs over 13,000 people in a range of programs, including weapons development and security.
[in-text-ad]

New York: New York County
> Largest place in county: New York
> 5-yr. population change: +0.8% (state: -0.1%)
> Poverty rate: 15.8% (state: 14.1%)
> Adults with a bachelor’s degree: 61.3% (state: 36.6%)
> Life expectancy at birth: 85.3 years (state: 81.4 years)
New York County is coterminous with the borough of Manhattan in New York City. Ranking as the best county to live in in New York state, New York County has a life expectancy at birth of 85.3 years, the highest of any of the state’s 62 counties and nearly four years longer than the state average. The county is also the best educated in the state with a 61.3% bachelor’s degree attainment rate. For context, 36.6% of adults in the state and 32.1% of adults nationwide have a bachelor’s degree.
New York County does not lead the state in every key socioeconomic measure, however. The county’s poverty rate of 15.8% is higher than the 14.1% rate across all of New York state.

North Carolina: Orange County
> Largest place in county: Chapel Hill
> 5-yr. population change: +5.5% (state: +5.3%)
> Poverty rate: 13.7% (state: 14.7%)
> Adults with a bachelor’s degree: 59.7% (state: 31.3%)
> Life expectancy at birth: 82.3 years (state: 78.1 years)
Orange County ranks as the best county to live in in North Carolina. The area, home to Chapel Hill and the University of North Carolina, is part of the state’s research triangle, known for its concentration of tech companies and a well-educated labor force. In the county, 59.7% of adults have a bachelor’s degree, the largest share of the 100 counties in the state, and unemployment stands at 3.3%, the lowest jobless rate in the state.
Orange County also has a healthy population. Life expectancy at birth in the county is 82.3 years, over four years longer than it is across the state.
North Dakota: Burleigh County
> Largest place in county: Bismarck
> 5-yr. population change: +10.1% (state: +7.3%)
> Poverty rate: 8.1% (state: 10.7%)
> Adults with a bachelor’s degree: 35.8% (state: 30.0%)
> Life expectancy at birth: 81.6 years (state: 79.7 years)
Burleigh County, located in central North Dakota, ranks as the best county to live in in the state. The local 8.1% poverty rate is less than the 10.7% poverty rate across the state as a whole. Greater educational attainment can reduce the likelihood of poverty, and in Burleigh County, 35.8% of the adult population have a bachelor’s degree, compared to 30% of adults in the state.
Counties with favorable socioeconomic conditions typically have faster than average population growth rates — and Burleigh County is no exception. The number of people living in the area expanded by 10.1% over the last five years, while the state’s population grew by 7.3% over the same period.
[in-text-ad-2]
Ohio: Delaware County
> Largest place in county: Delaware
> 5-yr. population change: +10.6% (state: +0.8%)
> Poverty rate: 4.8% (state: 14.0%)
> Adults with a bachelor’s degree: 54.3% (state: 28.3%)
> Life expectancy at birth: 82.3 years (state: 77.0 years)
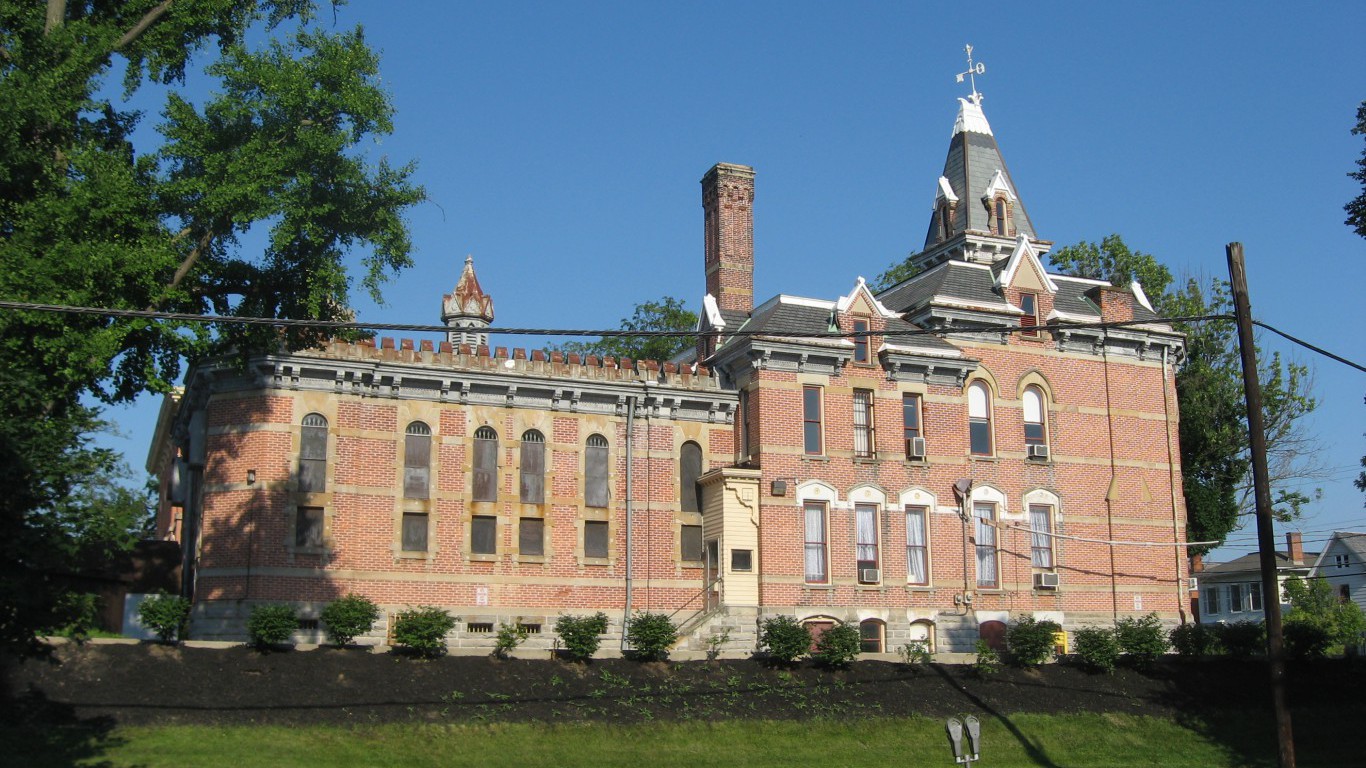
Delaware County, Ohio, located just north of downtown Columbus, ranks as the best county to live in in the state. An estimated 54.3% of adults in the area have a bachelor’s degree or higher, the largest share of all 88 counties in Ohio and well above the 28.3% share of adults across the state.
Health outcomes and financial security tend to improve with educational attainment, both at an individual level and across populations. In Delaware County, life expectancy at birth is 82.3 years, over five years greater than the state average. Additionally, the local poverty rate of 4.8% is less than half the 14.0% statewide rate.

Oklahoma: Cleveland County
> Largest place in county: Oklahoma City
> 5-yr. population change: +5.4% (state: +3.0%)
> Poverty rate: 12.0% (state: 15.7%)
> Adults with a bachelor’s degree: 33.4% (state: 25.5%)
> Life expectancy at birth: 78.7 years (state: 76.0 years)
Cleveland County, located in central Oklahoma and covering parts of Oklahoma City, ranks as the best county to live in in the state. The county is one of only two in the state where more than one in every three adults have a bachelor’s degree. Across Oklahoma, only about one in every four adults have a bachelor’s degree.
Health outcomes and financial security tend to improve with educational attainment, both at an individual level and across populations. In Cleveland County, life expectancy at birth is 78.7 years, nearly three years greater than the state average. Additionally, the local poverty rate of 12.0% is less than the 15.7% statewide rate.
[in-text-ad]

Oregon: Washington County
> Largest place in county: Hillsboro
> 5-yr. population change: +7.7% (state: +5.9%)
> Poverty rate: 8.9% (state: 13.2%)
> Adults with a bachelor’s degree: 44.4% (state: 33.7%)
> Life expectancy at birth: 82.7 years (state: 79.9 years)
Life expectancy at birth in Washington County, Oregon, is 82.7 years, nearly three years longer than the statewide average. The best county to live in in the state, Washington County also has a well-educated, financially stable population. The local bachelor’s degree attainment rate of 44.4% is well above the 33.7% rate across Oregon, and only 8.9% of the local population live below the poverty line, compared to 13.2% of the state population.
Like many counties with similarly strong socioeconomic indicators, Washington is in close proximity to a major city and is growing rapidly. Located west of downtown Portland, well within commuting distance, Washington County’s population has grown by 7.7% over the last five years, compared to the 5.9% statewide population growth.

Pennsylvania: Chester County
> Largest place in county: West Chester
> 5-yr. population change: +2.6% (state: +0.3%)
> Poverty rate: 6.4% (state: 12.4%)
> Adults with a bachelor’s degree: 53.0% (state: 31.4%)
> Life expectancy at birth: 81.4 years (state: 78.4 years)
Of the 67 counties in Pennsylvania, Chester County, located just outside of Philadelphia, ranks as the best to live in. The county’s poverty rate of 6.4% is nearly half the 12.4% rate across the state as a whole. Life expectancy at birth in the county, at 81.4 years, is also three years longer than it is across Pennsylvania.
Health outcomes and financial security tend to improve with educational attainment, both at an individual level and across populations — and Chester is the only county in Pennsylvania where over half of all adults have a bachelor’s degree.

Rhode Island: Bristol County
> Largest place in county: Bristol
> 5-yr. population change: -1.2% (state: +0.4%)
> Poverty rate: 7.5% (state: 12.4%)
> Adults with a bachelor’s degree: 49.0% (state: 34.2%)
> Life expectancy at birth: 81.5 years (state: 79.8 years)
A geographically small state, Rhode Island has only five counties. Of them, Bristol County, which borders Massachusetts and extends into the Narragansett Bay, ranks as the best to live in. The county’s poverty rate of 7.5% is well below the 12.4% rate across the state as a whole. Life expectancy at birth in the county, at 81.5 years, is also nearly two years longer than it is across Rhode Island.
Health outcomes and financial security tend to improve with educational attainment, both at an individual level and across populations — and in Bristol County, 49.0% of adults have a bachelor’s degree or higher, the largest share of any county in the state and well above the 34.2% share across Rhode Island.
[in-text-ad-2]

South Carolina: Beaufort County
> Largest place in county: Hilton Head Island
> 5-yr. population change: +10.5% (state: +6.2%)
> Poverty rate: 10.2% (state: 15.2%)
> Adults with a bachelor’s degree: 41.2% (state: 28.1%)
> Life expectancy at birth: 82.9 years (state: 77.1 years)
Beaufort County, South Carolina, is located in the southern part of the state along the Atlantic coast. Home to the resort community of Hilton Head Island, Beaufort ranks as the best county to live in in the state. Of all 46 counties in South Carolina, Beaufort has the longest life expectancy at birth, which, at 82.9 years, is nearly six years longer than the state average. Along with Charleston County, Beaufort is also one of only two counties in the state where over 40% of adults have a bachelor’s degree or higher.
The county ranks as best to live in in the state also because of the relative lack of serious financial hardship. The local poverty rate of 10.2% is only about two-thirds the 15.2% state poverty rate.
South Dakota: Lincoln County
> Largest place in county: Sioux Falls
> 5-yr. population change: +17.6% (state: +4.3%)
> Poverty rate: 4.1% (state: 13.1%)
> Adults with a bachelor’s degree: 37.6% (state: 28.8%)
> Life expectancy at birth: 84.3 years (state: 78.9 years)
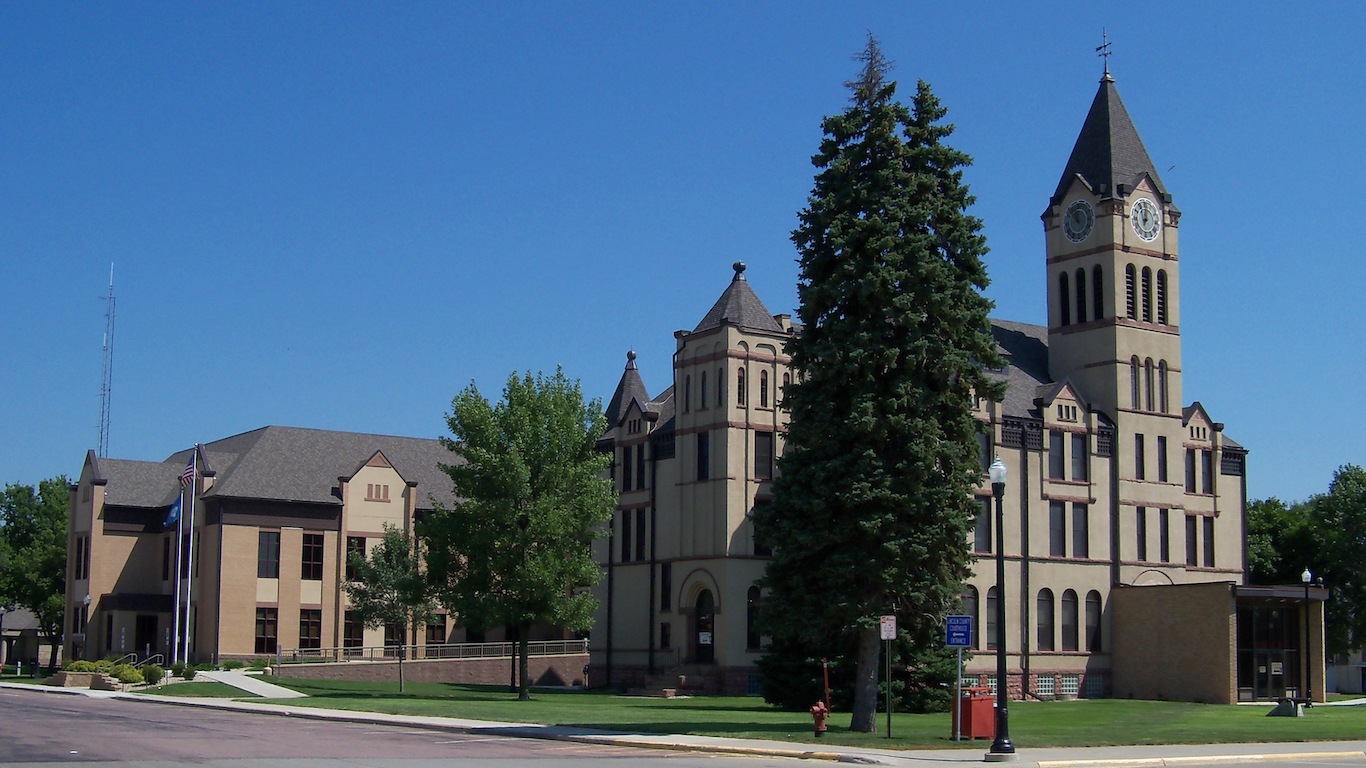
Lincoln County, located near the southeast corner of South Dakota just outside of Sioux Falls, ranks as the best county to live in in the state. Life expectancy at birth in the county is 84.3 years, over half a decade longer than it is across the state as a whole. Financially secure populations tend to have better health outcomes, and in Lincoln County, only 4.1% of residents live below the poverty line, less than one-third the 13.1% poverty rate across South Dakota.
Counties with favorable socioeconomic conditions typically have faster than average population growth rates — and Lincoln County is no exception. The number of people living in the area expanded by 17.6% over the last five years, while the state’s population grew by 4.3% over the same period.
[in-text-ad]

Tennessee: Williamson County
> Largest place in county: Franklin
> 5-yr. population change: +16.2% (state: +4.0%)
> Poverty rate: 4.4% (state: 15.2%)
> Adults with a bachelor’s degree: 59.8% (state: 27.3%)
> Life expectancy at birth: 81.7 years (state: 76.0 years)
Life expectancy at birth in Williamson County, Tennessee, is 81.7 years, nearly six years longer than the statewide average. The best county to live in in the state, Williamson County also has a well-educated, financially stable population. The local bachelor’s degree attainment rate of 59.8% is more than double the 27.3% rate across Tennessee, and only 4.4% of the local population live below the poverty line, compared to 15.2% of the state population.
Like many counties with similarly strong socioeconomic indicators, Williamson is in close proximity to a major city and is growing rapidly. Located south of downtown Nashville, well within commuting distance, Williamson County’s population has grown by 16.2% over the last five years, compared to the 4.0% statewide population growth.

Texas: Collin County
> Largest place in county: Plano
> 5-yr. population change: +16.4% (state: +8.3%)
> Poverty rate: 6.3% (state: 14.7%)
> Adults with a bachelor’s degree: 52.3% (state: 29.9%)
> Life expectancy at birth: 82.7 years (state: 79.2 years)
Collin County, Texas, located in the Dallas-Fort Worth metropolitan area, ranks as the best county to live in in the state. Of all 254 counties that make up the Lone Star State, Collin County has the best educated population, with a bachelor’s degree attainment rate of 52.3%. Across all of Texas, only 29.9% of adults have a bachelor’s degree.
Health outcomes and financial security tend to improve with educational attainment, both at an individual level and across populations. In Collin County, the 6.3% poverty rate is less than half the 14.7% state poverty rate. Additionally, at 82.7 years, life expectancy at birth in the county is about four years longer than it is across Texas.

Utah: Summit County
> Largest place in county: Park City
> 5-yr. population change: +8.5% (state: +8.4%)
> Poverty rate: 5.6% (state: 9.8%)
> Adults with a bachelor’s degree: 55.0% (state: 34.0%)
> Life expectancy at birth: 85.1 years (state: 80.1 years)
Based on key socioeconomic indicators, Utah’s Summit County, located just outside Salt Lake City, outranks all 28 other counties in the state as the best place to live in. At 85.1 years, life expectancy at birth in the county is a full five years longer than it is across the state as a whole. Additionally, while Utah’s poverty rate of 9.8% is well below the 13.4% national rate, at just 5.6%, Summit County’s poverty rate is even lower.
Health outcomes and financial security tend to improve with educational attainment, both at an individual level and across populations — and Summit County is by far the best educated county in the state. The 55.0% share of adults in Summit County with a bachelor’s degree is well above the 40.8% share in Utah County, the second best educated county in the state, and the 34.0% bachelor’s degree attainment rate across Utah as a whole.
[in-text-ad-2]

Vermont: Chittenden County
> Largest place in county: Burlington
> 5-yr. population change: +2.5% (state: -0.3%)
> Poverty rate: 12.1% (state: 10.9%)
> Adults with a bachelor’s degree: 51.3% (state: 38.0%)
> Life expectancy at birth: 81.8 years (state: 79.8 years)
Chittenden County, located in northwestern Vermont along the shore of Lake Champlain, is far and away the most populated county in the state, with over 160,000 residents. With a relatively healthy and well educated population, it also ranks as the best of the state’s 14 counties to live in.
Life expectancy at birth in Chittenden County is 81.8 years, two years longer than the state average. Additionally, Chittenden is the only county in the state where over half of all adults have a bachelor’s degree or higher.

Virginia: Arlington County
> Largest place in county: Arlington
> 5-yr. population change: +6.0% (state: +3.3%)
> Poverty rate: 6.8% (state: 10.6%)
> Adults with a bachelor’s degree: 75.3% (state: 38.8%)
> Life expectancy at birth: 85.9 years (state: 79.5 years)
Of the 133 counties and county equivalents in Virginia, Arlington County, located across the Potomac River from Washington D.C., ranks as the best place to live. One of the best educated counties in the United States, over three-quarters of adults in the area have a bachelor’s degree or higher, compared to 38.8% of adults across Virginia.
With a well-educated labor force and access to employment opportunities in the nation’s capital, Arlington has a strong job market and a financially secure population. Only 3.1% of the local labor force are unemployed, and 6.8% of the population live below the poverty line. Meanwhile, Virginia’s jobless rate is 4.5%, and 10.6% of the state population live below the poverty line.
[in-text-ad]

Washington: San Juan County
> Largest place in county: Friday Harbor
> 5-yr. population change: +5.9% (state: +7.3%)
> Poverty rate: 10.2% (state: 10.8%)
> Adults with a bachelor’s degree: 49.8% (state: 36.0%)
> Life expectancy at birth: 86.2 years (state: 80.4 years)
San Juan County is made up of a cluster of islands near the northwestern corner of Washington state. Of the 39 counties in the state, San Juan ranks as the best to live in, largely because of health outcomes among local residents. At 86.2 years, life expectancy at birth in the county is nearly six years longer than the statewide average.
San Juan also has a well-educated population. An estimated 49.8% of adults in the county have a bachelor’s degree or higher, compared to 36.0% of adults across Washington.

West Virginia: Jefferson County
> Largest place in county: Corporation of Ranson
> 5-yr. population change: +3.4% (state: -2.0%)
> Poverty rate: 9.7% (state: 17.6%)
> Adults with a bachelor’s degree: 31.8% (state: 20.6%)
> Life expectancy at birth: 78.0 years (state: 74.8 years)
West Virginia is one of the poorest states in the country, with a poverty rate of 17.6%. Not all parts of the state have such high rates of financial insecurity, however. In Jefferson County, only 9.7% of the population live below the poverty line. The reduced likelihood of financial insecurity is likely due in part to greater educational attainment. An estimated 31.8% of the county’s adult population have a bachelor’s degree, well above the 20.6% bachelor’s degree attainment rate statewide.
The best county to live in in the state, Jefferson is also one of the fastest growing. The county, located in the eastern-most corner of the state, has grown by 3.4% in the last five years. Meanwhile, the state’s population contracted by 2.0% over the same period.

Wisconsin: Ozaukee County
> Largest place in county: Mequon
> 5-yr. population change: +1.9% (state: +1.2%)
> Poverty rate: 5.3% (state: 11.3%)
> Adults with a bachelor’s degree: 49.0% (state: 30.1%)
> Life expectancy at birth: 82.1 years (state: 79.5 years)
Of Wisconsin’s 72 counties, Ozaukee County ranks as the best place to live in. Residents of the area, located just north of Milkwaukee along the shore of Lake Michigan, are less than half as likely to live below the poverty line as the typical Wisconsin resident. Life expectancy at birth in the county is also about two and a half years longer than it is across the state as a whole.
Health outcomes and financial security tend to improve with educational attainment, both at an individual level and across populations — and Ozaukee County has a relatively well-educated population. The local bachelor’s degree attainment rate of 49.0% is considerably above the 30.1% rate across the state as a whole.
[in-text-ad-2]

Wyoming: Teton County
> Largest place in county: Jackson
> 5-yr. population change: +6.0% (state: +1.0%)
> Poverty rate: 6.1% (state: 11.0%)
> Adults with a bachelor’s degree: 57.0% (state: 27.4%)
> Life expectancy at birth: 87.5 years (state: 78.9 years)
Teton County, located in northwestern Wyoming, covers parts of both Yellowstone and Grand Teton National Parks. The county is also home to the healthiest and best educated population of all 23 counties in the state. An estimated 57% of adults in the county have a bachelor’s degree or higher, compared to 27.4% of adults across Wyoming. Additionally, at 87.5 years, life expectancy at birth in the county is nearly nine years longer than it is across the state.
The best county to live in in the state, Teton Is also the fastest growing. Over the last five years, the number of people living in the area has increased by 6.0%, while Wyoming’s population grew by just 1.0%.
Methodology
To determine the best U.S. counties to live in, 24/7 Wall St. constructed an index of three measures: poverty, bachelor’s degree attainment among adults, and average life expectancy at birth. Our list also includes independent cities that do not fall within the boundaries of a county or county equivalent. Only counties and county equivalents with populations of 10,000 or more were considered.
Data on the share of individuals living below the poverty line as well as the share of adults 25 and older with at least a bachelor’s degree came from the 2019 U.S. Census Bureau’s American Community Survey and are five-year estimates.
Data on average life expectancy at birth came from the 2021 County Health Rankings, a joint program of the Robert Wood Johnson Foundation and University of Wisconsin Population Health Institute, and are based on mortality data from the years 2017 to 2019.
Supplemental data on population, income, and median home value are five-year estimates from the ACS. Data on unemployment in May 2021 came from the Bureau of Labor Statistics and are seasonally adjusted.
Travel Cards Are Getting Too Good To Ignore (sponsored)
Credit card companies are pulling out all the stops, with the issuers are offering insane travel rewards and perks.
We’re talking huge sign-up bonuses, points on every purchase, and benefits like lounge access, travel credits, and free hotel nights. For travelers, these rewards can add up to thousands of dollars in flights, upgrades, and luxury experiences every year.
It’s like getting paid to travel — and it’s available to qualified borrowers who know where to look.
We’ve rounded up some of the best travel credit cards on the market. Click here to see the list. Don’t miss these offers — they won’t be this good forever.
Thank you for reading! Have some feedback for us?
Contact the 24/7 Wall St. editorial team.
 24/7 Wall St.
 24/7 Wall St.

 24/7 Wall St.