
Tip O’Neill once said “all politics is local.”
Though the speaker of the U.S. House of Representatives from 1977 to 1987 used it to criticize a challenger in Massachusetts who funded his campaign with out-of-state money, the phrase has come to mean that local government impacts citizens more than top-down decisions made by lawmakers a thousand miles away.
Whether or not federal-level policies are more or less important than what happens at the city council can be debated, but it’s been argued as far back as ancient Greece that the smaller the governed population, the easier it is to keep a majority of governed citizens happy — or at least content enough to keep them from committing large scale acts of civil unrest. (Civil unrest is one reason these are 29 countries the U.S. government doesn’t want you to visit.)
The reason: Citizens of smaller populations are more likely to be acquainted with each other and share similar values. The founders of the U.S. Constitution felt this, which is why the United States is a republic of smaller, self-governing states.
But smaller isn’t always better.
Small countries and territories might be easier to govern, and their citizens are perhaps more likely to be content, but countries with larger populations and greater land mass tend to have more global or regional economic and military muscle — China and the United States being the most obvious examples. (In terms of gross domestic product, or GDP, both are among the richest countries in the world.)
Larger countries may be more challenging to govern, and are more difficult to change even when the change is desired by a majority of their citizens, but these “macro” countries tend to have outsize regional or global influence relative to their “micro” neighbors. Politics might be local, but geopolitics isn’t.
To identify the 25 largest countries in the world by population, 24/7 Tempo analyzed data for 232 nations from World Population Prospects 2019, published by the United Nations Department of Economic and Social Affairs. Information on current population, percentage of population change since 2010, and projected population by 2050 are U.N. estimates; land area was current as of the most recent U.N. land use computations in 2007.
Click here to see the 25 largest countries in the world

25. South Africa
> Population, July 2020: 59,308,690
> 10-year population change, 2010-2020: 15.8%
> Projected 2050 population: 75,517,909
> Land area: 471,445 square miles
[in-text-ad]

24. United Republic of Tanzania
> Population, July 2020: 59,734,213
> 10-year population change, 2010-2020: 34.7%
> Projected 2050 population: 129,386,845
> Land area: 364,900 square miles

23. Italy
> Population, July 2020: 60,461,828
> 10-year population change, 2010-2020: 1.9%
> Projected 2050 population: 54,381,674
> Land area: 116,339 square miles

22. France
> Population, July 2020: 65,273,512
> 10-year population change, 2010-2020: 3.8%
> Projected 2050 population: 67,586,729
> Land area: 212,935 square miles
[in-text-ad-2]

21. United Kingdom
> Population, July 2020: 67,886,004
> 10-year population change, 2010-2020: 7.0%
> Projected 2050 population: 74,081,983
> Land area: 93,784 square miles

20. Thailand
> Population, July 2020: 69,799,978
> 10-year population change, 2010-2020: 3.9%
> Projected 2050 population: 65,940,494
> Land area: 198,115 square miles
[in-text-ad]

19. Germany
> Population, July 2020: 83,783,945
> 10-year population change, 2010-2020: 3.7%
> Projected 2050 population: 80,103,973
> Land area: 137,847 square miles
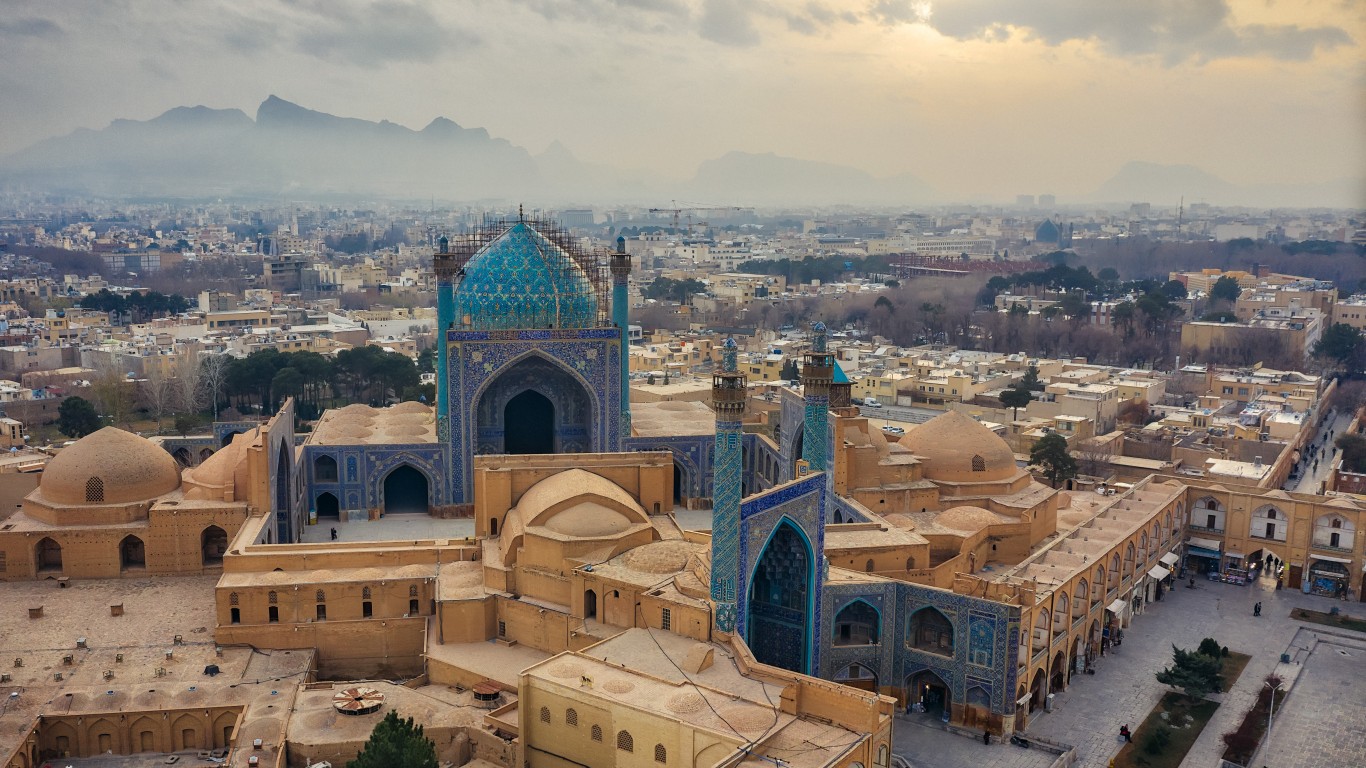
18. Iran (Islamic Republic of)
> Population, July 2020: 83,992,953
> 10-year population change, 2010-2020: 13.9%
> Projected 2050 population: 103,098,083
> Land area: 636,371 square miles

17. Turkey
> Population, July 2020: 84,339,067
> 10-year population change, 2010-2020: 16.6%
> Projected 2050 population: 97,139,565
> Land area: 302,535 square miles
[in-text-ad-2]
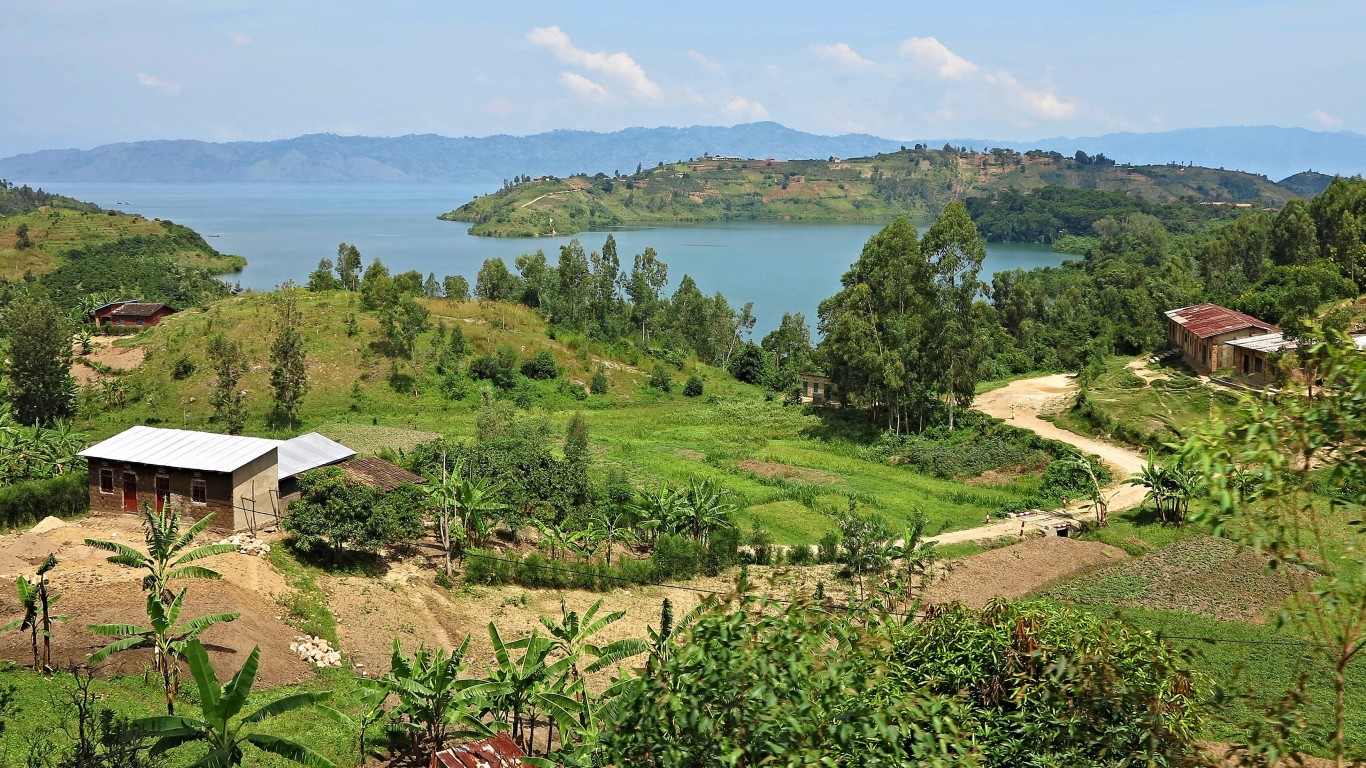
16. Democratic Republic of the Congo
> Population, July 2020: 89,561,404
> 10-year population change, 2010-2020: 38.7%
> Projected 2050 population: 194,488,663
> Land area: 905,354 square miles

15. Viet Nam
> Population, July 2020: 97,338,583
> 10-year population change, 2010-2020: 10.7%
> Projected 2050 population: 109,605,010
> Land area: 128,066 square miles
[in-text-ad]

14. Egypt
> Population, July 2020: 102,334,403
> 10-year population change, 2010-2020: 23.7%
> Projected 2050 population: 159,956,809
> Land area: 386,661 square miles
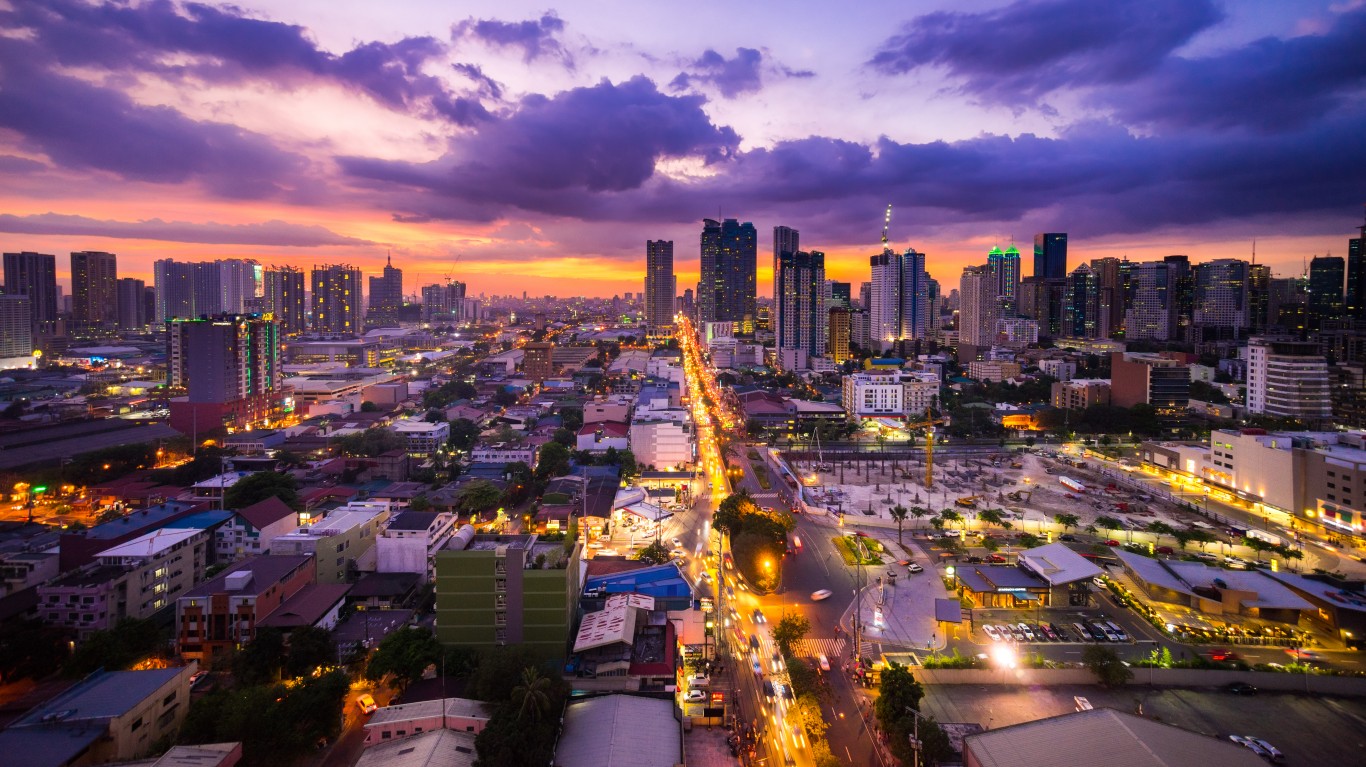
13. Philippines
> Population, July 2020: 109,581,085
> 10-year population change, 2010-2020: 16.6%
> Projected 2050 population: 144,488,171
> Land area: 115,831 square miles
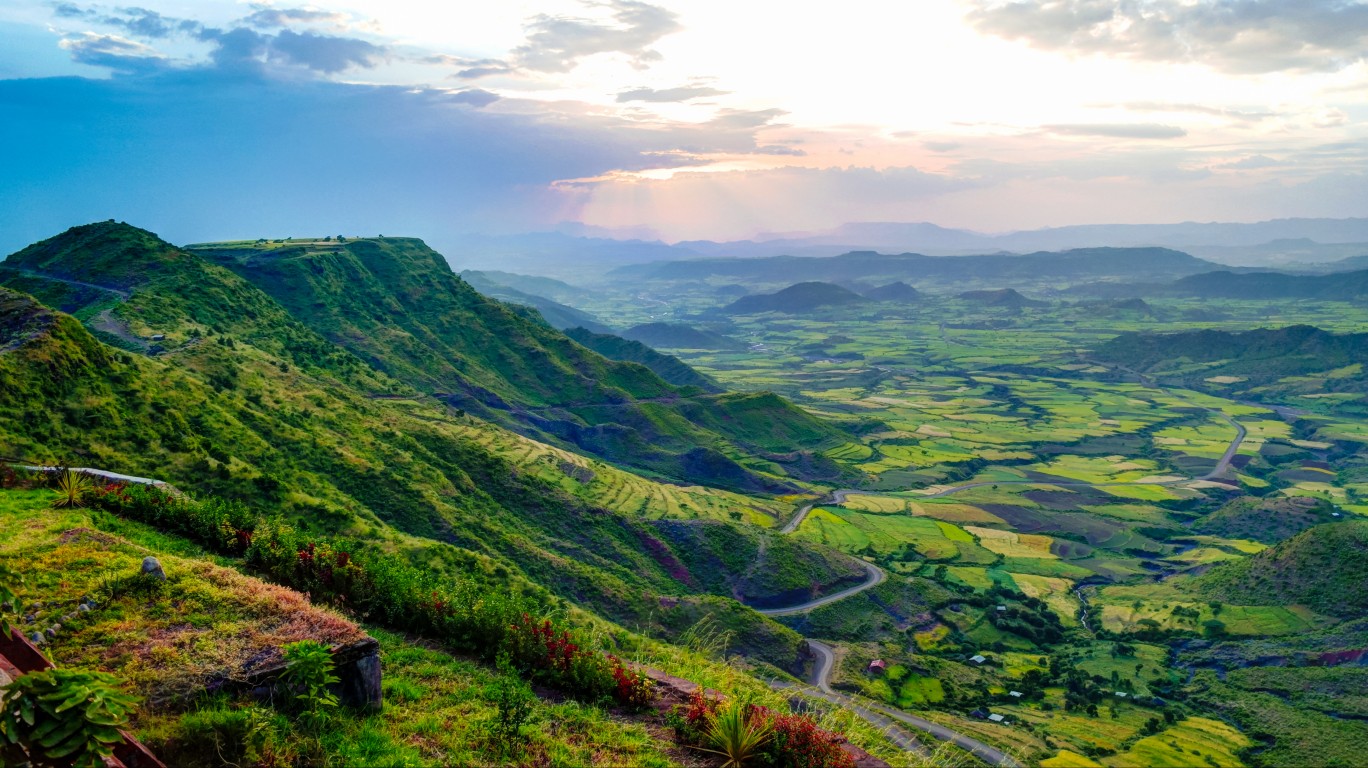
12. Ethiopia
> Population, July 2020: 114,963,583
> 10-year population change, 2010-2020: 31.2%
> Projected 2050 population: 205,410,671
> Land area: 426,372 square miles
[in-text-ad-2]

11. Japan
> Population, July 2020: 126,476,458
> 10-year population change, 2010-2020: -1.6%
> Projected 2050 population: 105,804,023
> Land area: 145,898 square miles

10. Mexico
> Population, July 2020: 128,932,753
> 10-year population change, 2010-2020: 13.0%
> Projected 2050 population: 155,150,814
> Land area: 756,065 square miles
[in-text-ad]

9. Russian Federation
> Population, July 2020: 145,934,460
> 10-year population change, 2010-2020: 1.7%
> Projected 2050 population: 135,824,486
> Land area: 6,601,665 square miles

8. Bangladesh
> Population, July 2020: 164,689,383
> 10-year population change, 2010-2020: 11.6%
> Projected 2050 population: 192,567,779
> Land area: 55,598 square miles
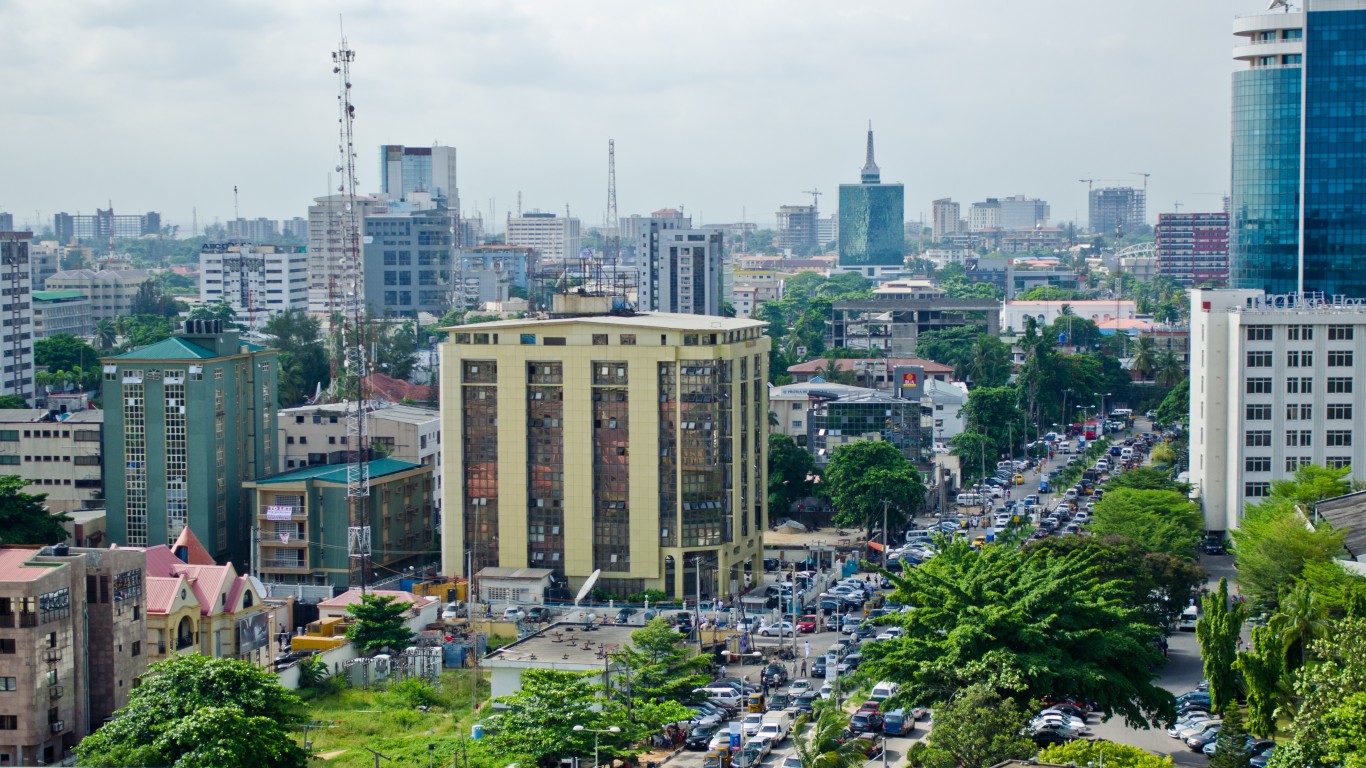
7. Nigeria
> Population, July 2020: 206,139,587
> 10-year population change, 2010-2020: 30.1%
> Projected 2050 population: 401,314,997
> Land area: 356,669 square miles
[in-text-ad-2]

6. Brazil
> Population, July 2020: 212,559,409
> 10-year population change, 2010-2020: 8.6%
> Projected 2050 population: 228,980,400
> Land area: 3,287,611 square miles

5. Pakistan
> Population, July 2020: 220,892,331
> 10-year population change, 2010-2020: 23.1%
> Projected 2050 population: 338,013,194
> Land area: 307,374 square miles
[in-text-ad]

4. Indonesia
> Population, July 2020: 273,523,621
> 10-year population change, 2010-2020: 13.1%
> Projected 2050 population: 330,904,672
> Land area: 735,358 square miles
3. United States of America
> Population, July 2020: 331,002,647
> 10-year population change, 2010-2020: 7.1%
> Projected 2050 population: 379,419,097
> Land area: 3,796,742 square miles
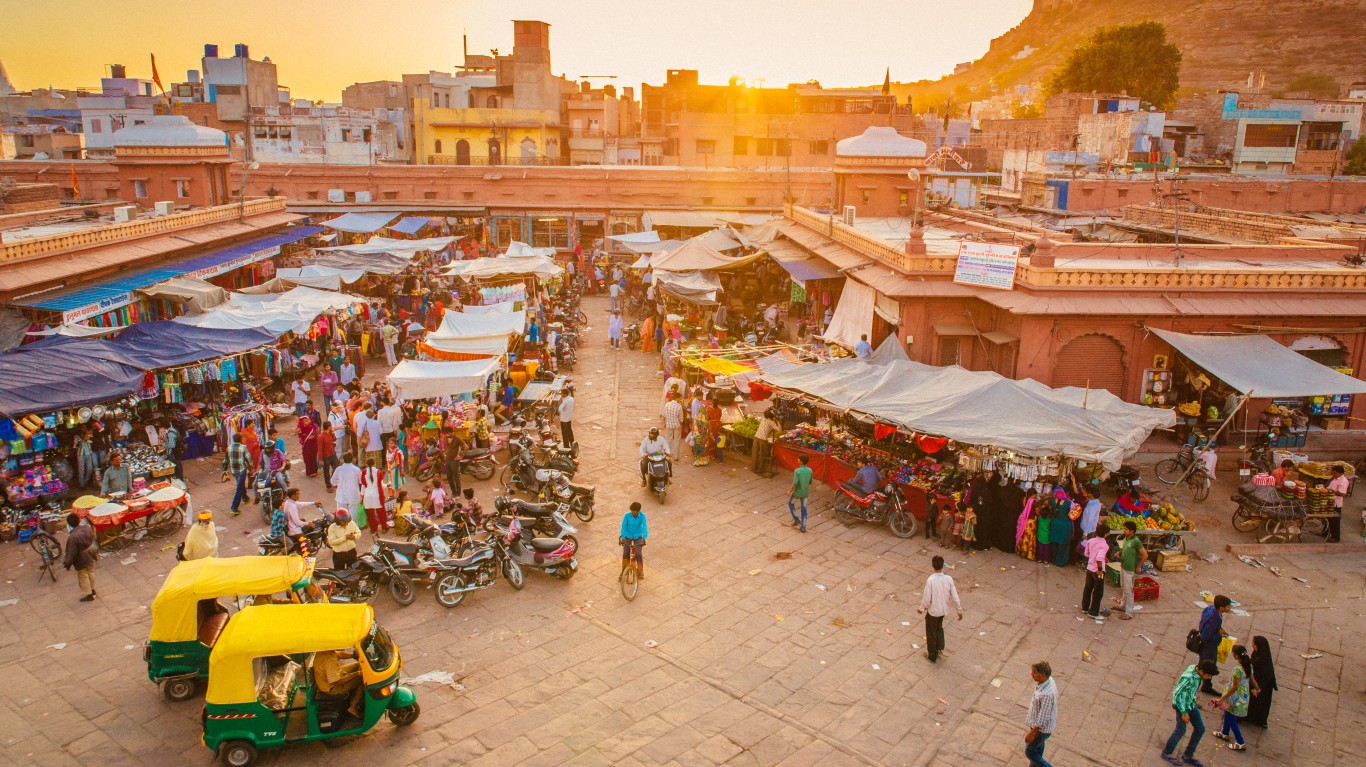
2. India
> Population, July 2020: 1,380,004,385
> 10-year population change, 2010-2020: 11.8%
> Projected 2050 population: 1,639,176,036
> Land area: 1,269,219 square miles
[in-text-ad-2]

1. China
> Population, July 2020: 1,439,323,774
> 10-year population change, 2010-2020: 5.2%
> Projected 2050 population: 1,402,405,167
> Land area: 3,705,406 square miles
The Average American Has No Idea How Much Money You Can Make Today (Sponsor)
The last few years made people forget how much banks and CD’s can pay. Meanwhile, interest rates have spiked and many can afford to pay you much more, but most are keeping yields low and hoping you won’t notice.
But there is good news. To win qualified customers, some accounts are paying almost 10x the national average! That’s an incredible way to keep your money safe and earn more at the same time. Our top pick for high yield savings accounts includes other benefits as well. You can earn up to 3.80% with a Checking & Savings Account today Sign up and get up to $300 with direct deposit. No account fees. FDIC Insured.
Click here to see how much more you could be earning on your savings today. It takes just a few minutes to open an account to make your money work for you.
Our top pick for high yield savings accounts includes other benefits as well. You can earn up to 4.00% with a Checking & Savings Account from Sofi. Sign up and get up to $300 with direct deposit. No account fees. FDIC Insured.
Thank you for reading! Have some feedback for us?
Contact the 24/7 Wall St. editorial team.
 24/7 Wall St.

