Special Report
The Most Common Health Problems in Cats (and How They Are Treated)
Published:

More than a quarter of American households have feline pets — adding up to over 58 million cats in all. Here are the states with the most cats as pets.
Cats are notoriously good at hiding their ailments, likely due to their survival instincts. Some problems, however, such as vomiting or repeated sneezing, are difficult to disguise. When these are observed, or when a cat breaks a limb or shows a drastic change in appetite or energy levels, it may be time to take the cat in for a checkup.
Cat owners make an average of 1.3 trips to the vet yearly and spend about $182 per household annually. However, only 1% of American dogs and cats were covered by pet insurance as of 2019, a factor that may have influenced whether owners decided to take their pets to the vet or attempted to treat their illness at home. (This is no different than people, who often also choose to treat their own ailments at home due to insufficient or nonexistent health insurance. For humans, these are the cities with the best health insurance coverage in every state.)
Click here to learn the most common health problems in cats (and how they are treated)
Using data from the American Veterinary Medicine Association’s 2017-2018 Pet Ownership and Demographics Sourcebook, 24/7 Tempo has compiled a list of the most common health issues in cats, and how their owners decide to treat them. The percentage of households with cats that have these issues as well as the percentage of owners who either treated their cat at home or took them to the vet are for the year 2016, the most recent year for which data is available.
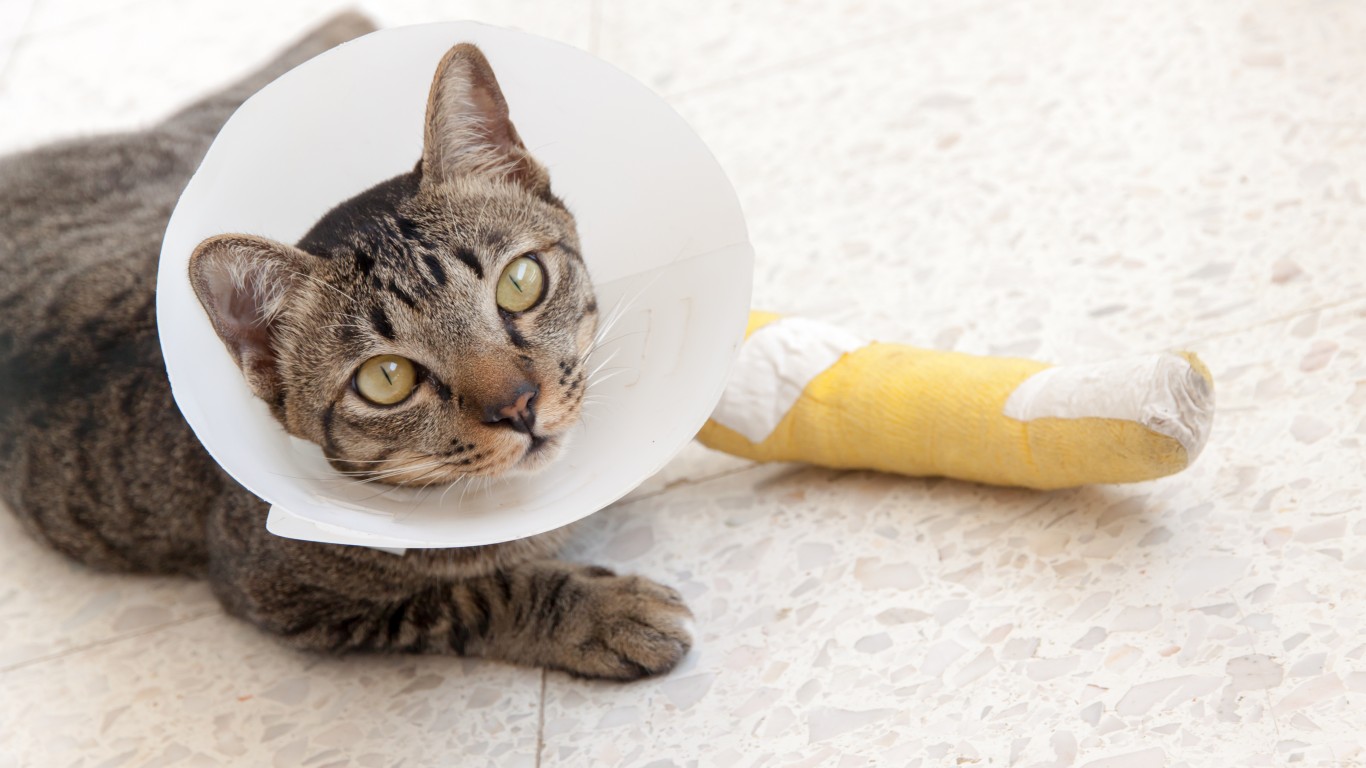
Broken Bones or Limb Loss
> Percentage of households with cats with the problem in 2016: 0.5%
> Treated at home: —
> Treated at vet clinic or hospital: 72%
> Mix of both: 27%
[in-text-ad]
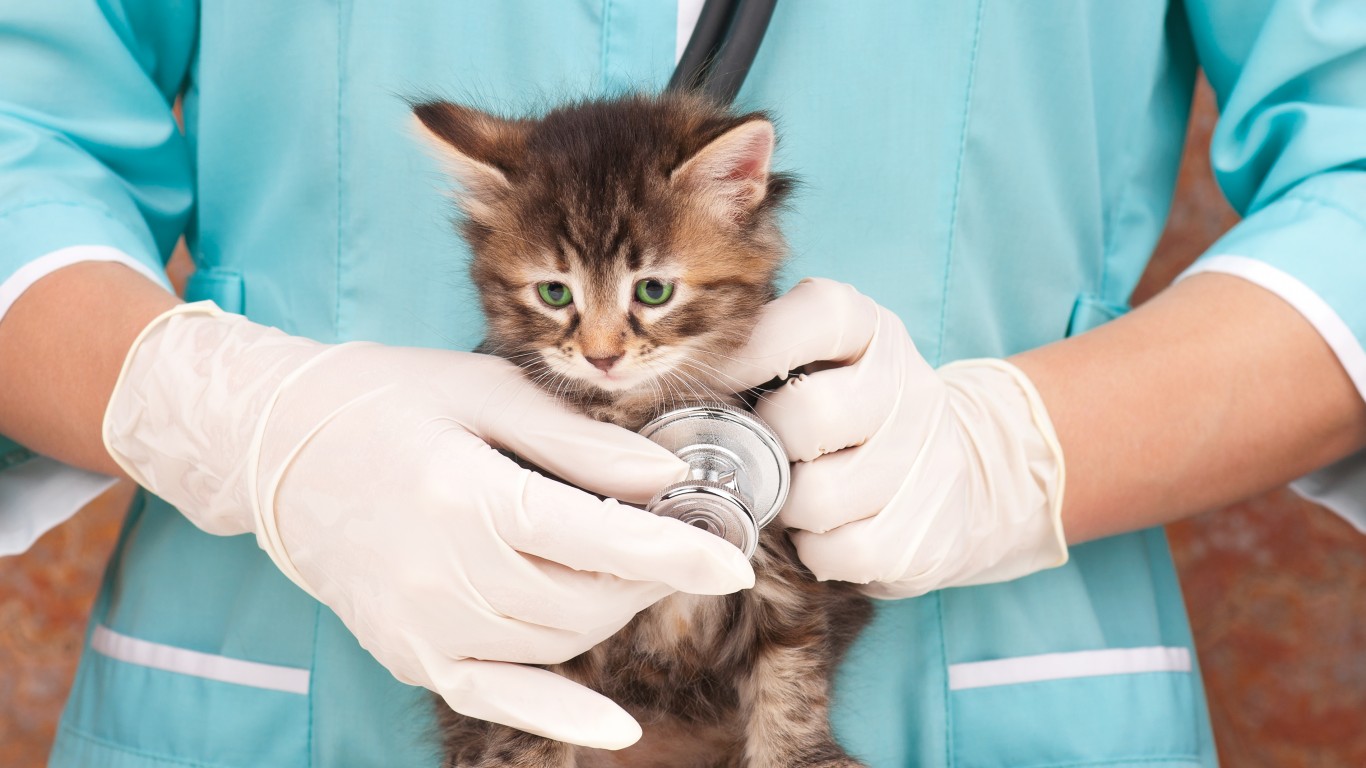
Heart, Lung or Liver Disease
> Percentage of households with cats with the problem in 2016: 0.6%
> Treated at home: 5%
> Treated at vet clinic or hospital: 75%
> Mix of both: 20%

Arthritis
> Percentage of households with cats with the problem in 2016: 0.7%
> Treated at home: 29%
> Treated at vet clinic or hospital: 42%
> Mix of both: 28%

Kidney Disease
> Percentage of households with cats with the problem in 2016: 0.9%
> Treated at home: 12%
> Treated at vet clinic or hospital: 58%
> Mix of both: 30%
[in-text-ad-2]

Hyperthyroidism or Diabetes
> Percentage of households with cats with the problem in 2016: 1.4%
> Treated at home: 14%
> Treated at vet clinic or hospital: 47%
> Mix of both: 39%
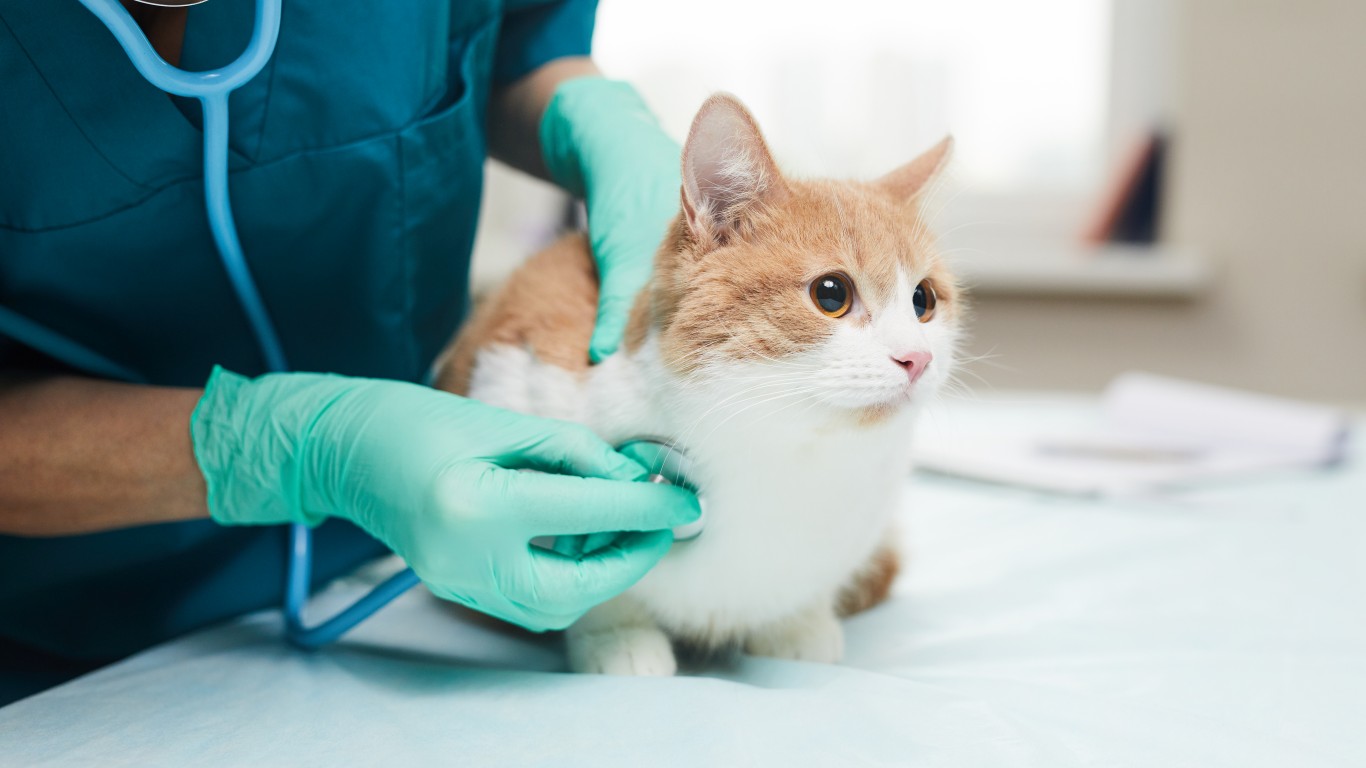
Cancer, Tumor, Cyst, Mass
> Percentage of households with cats with the problem in 2016: 1.7%
> Treated at home: 2%
> Treated at vet clinic or hospital: 79%
> Mix of both: 13%
[in-text-ad]
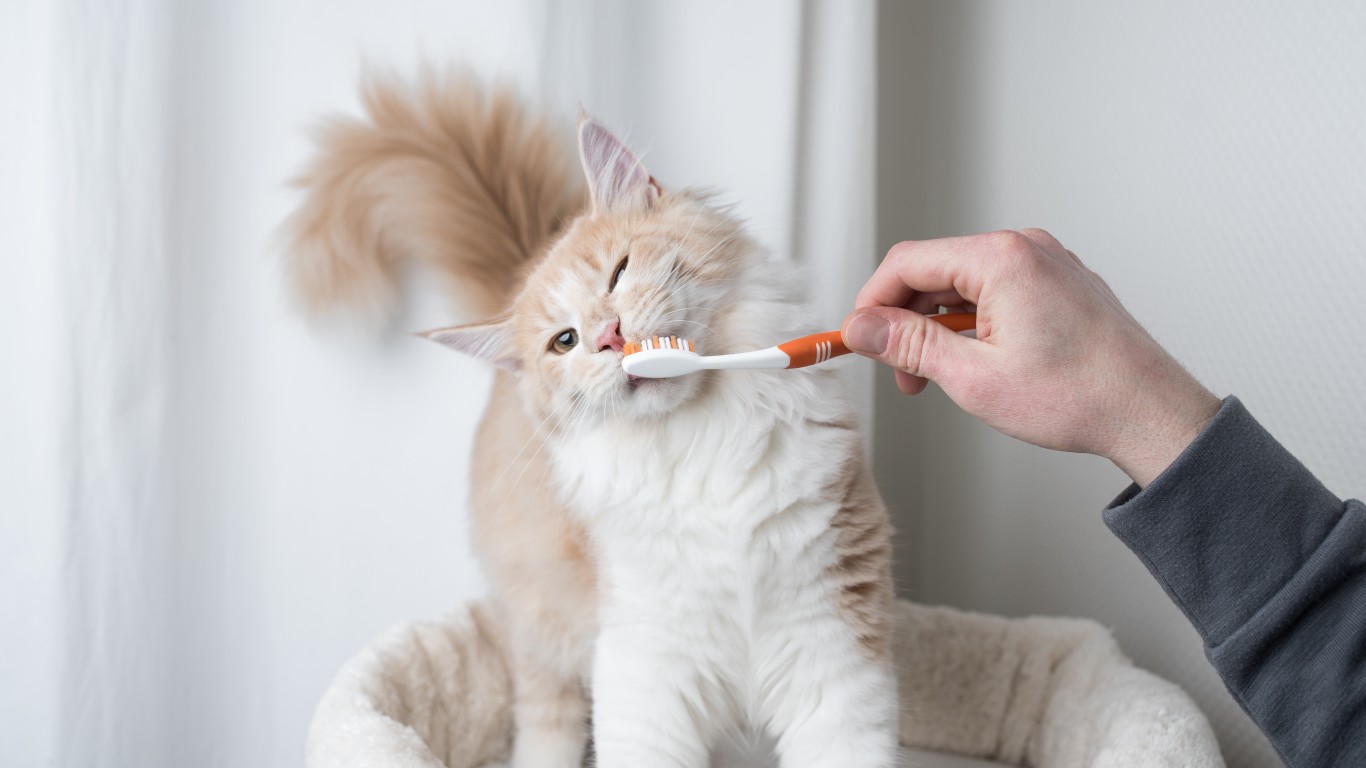
Dental Disease or Problems (Bad Teeth, Gums, Breath)
> Percentage of households with cats with the problem in 2016: 2%
> Treated at home: 15%
> Treated at vet clinic or hospital: 70%
> Mix of both: 14%

Ear Infection
> Percentage of households with cats with the problem in 2016: 2.2%
> Treated at home: 31%
> Treated at vet clinic or hospital: 48%
> Mix of both: 19%

Allergy
> Percentage of households with cats with the problem in 2016: 2.5%
> Treated at home: 28%
> Treated at vet clinic or hospital: 47%
> Mix of both: 25%
[in-text-ad-2]

Skin Infection, Disorder or Disease (Itch, Rash, Fungus)
> Percentage of households with cats with the problem in 2016: 2.9%
> Treated at home: 26%
> Treated at vet clinic or hospital: 45%
> Mix of both: 26%
Sneezing, Runny Eyes, Respiratory Tract Infection
> Percentage of households with cats with the problem in 2016: 4%
> Treated at home: 26%
> Treated at vet clinic or hospital: 45%
> Mix of both: 26%
[in-text-ad]
Urinary Tract or Bladder Infection
> Percentage of households with cats with the problem in 2016: 4.1%
> Treated at home: 9%
> Treated at vet clinic or hospital: 67%
> Mix of both: 22%

Diarrhea, Vomiting, Ate Something Bad
> Percentage of households with cats with the problem in 2016: 4.4%
> Treated at home: 28%
> Treated at vet clinic or hospital: 49%
> Mix of both: 23%
Hairballs
> Percentage of households with cats with the problem in 2016: 4.7%
> Treated at home: 71%
> Treated at vet clinic or hospital: 16%
> Mix of both: 10%
Thank you for reading! Have some feedback for us?
Contact the 24/7 Wall St. editorial team.