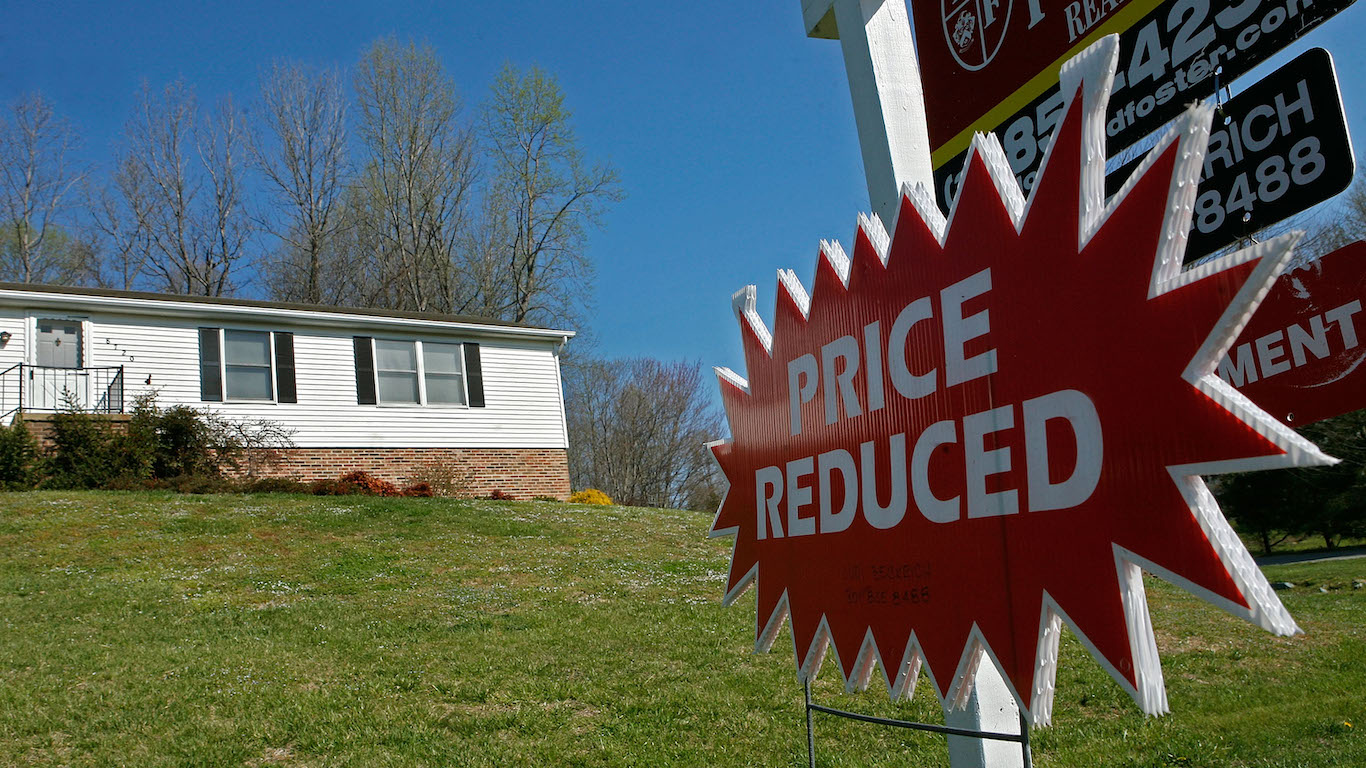
In the early months of the COVID-19 pandemic, U.S. home sales slumped. Since then, however, the market has come roaring back — and rising demand, in conjunction with a relatively low supply of housing, has caused home values to surge.
According to estimates from Zillow, a Seattle-based real estate data company, between June 2020 and June 2021, the typical single-family American home appreciated in value from $255,008 to $293,349, a 15.0% increase. Of course, housing markets also respond to local forces, and in some parts of the country, home values have appreciated at more than double the national rate.
In 50 cities and towns with populations of 50,000 or more, home values have appreciated by at least 26.0% over the past year. In some of them, the value of a typical family home has surged by more than 42.7%. Though these communities span the country, they tend to be concentrated in the Western United States.
One factor that can contribute to rapidly climbing home prices at a local level is demand. And demand for housing is often precipitated by a growing population. According to the most recent available Census data, 41 of the 50 cities and towns on this list reported population growth over the last one-year period.
Home prices are also largely dictated by what local residents can afford, and rising home values can often be the result of rising incomes. Of the 50 places on this list for which income data is available, 50 reported year-over-year growth in median household income, based on the most recent available data Census data.

50. Lehi, Utah
> 1-yr. change in median home value: +26.0% (+$108,644)
> Median home value; June 2021: $526,157
> 1-yr. population change: +4.1% (+2,498)
> Population: 64,006
> 1-yr. change in median household income: +6.8% (+$6,082)
> Median household income: $95,510
These are all the counties in Utah where COVID-19 is slowing (and where it’s still getting worse).

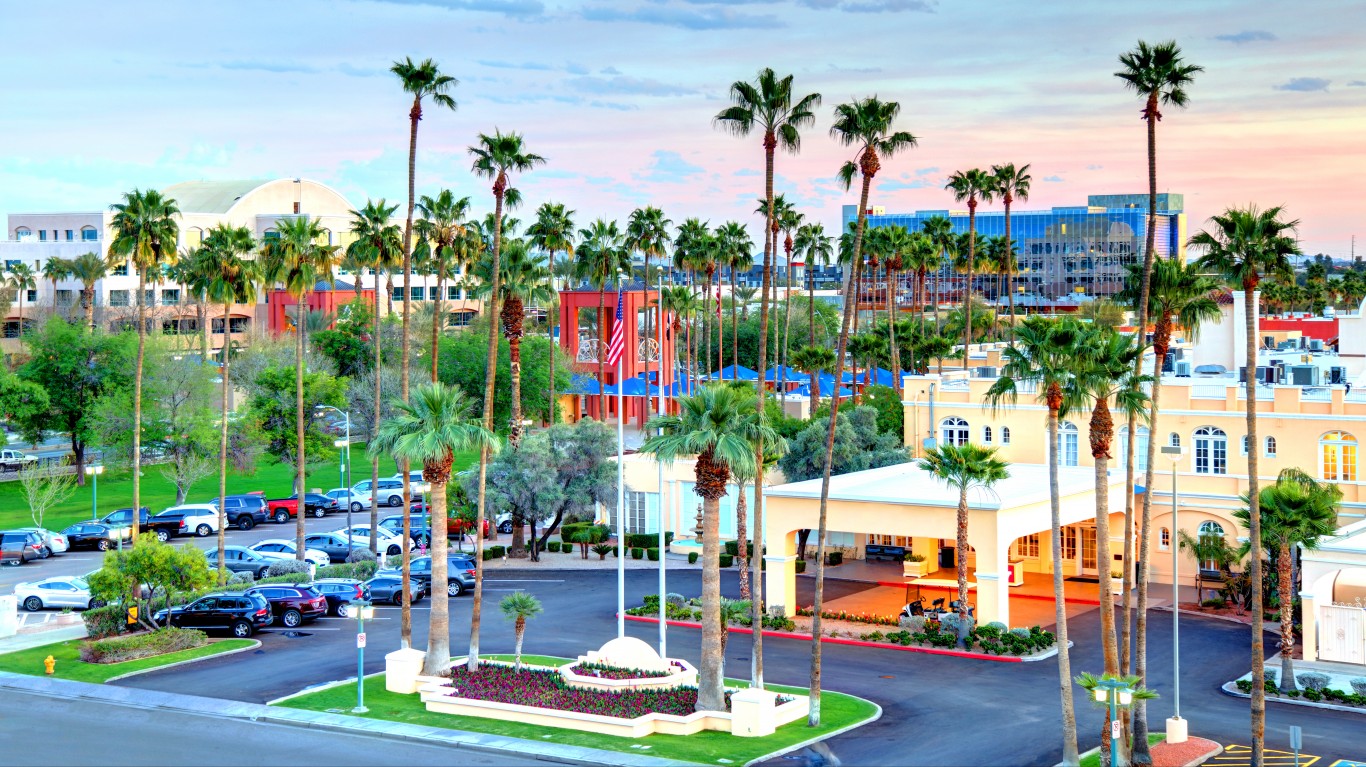
49. Gilbert, Arizona
> 1-yr. change in median home value: +26.1% (+$97,752)
> Median home value; June 2021: $472,655
> 1-yr. population change: +2.4% (+5,770)
> Population: 243,254
> 1-yr. change in median household income: +4.9% (+$4,507)
> Median household income: $96,857

48. Pinellas Park, Florida
> 1-yr. change in median home value: +26.1% (+$48,802)
> Median home value; June 2021: $235,861
> 1-yr. population change: +1.1% (+566)
> Population: 52,857
> 1-yr. change in median household income: +11.1% (+$4,942)
> Median household income: $49,652

47. Goodyear, Arizona
> 1-yr. change in median home value: +26.2% (+$83,339)
> Median home value; June 2021: $401,764
> 1-yr. population change: +3.7% (+2,895)
> Population: 80,371
> 1-yr. change in median household income: +4.4% (+$3,530)
> Median household income: $83,866

46. Pleasanton, California
> 1-yr. change in median home value: +26.2% (+$296,221)
> Median home value; June 2021: $1,426,417
> 1-yr. population change: +1.1% (+870)
> Population: 81,717
> 1-yr. change in median household income: +5.1% (+$7,548)
> Median household income: $156,400

45. Mesa, Arizona
> 1-yr. change in median home value: +26.3% (+$74,517)
> Median home value; June 2021: $358,328
> 1-yr. population change: +1.7% (+8,526)
> Population: 499,720
> 1-yr. change in median household income: +6.4% (+$3,481)
> Median household income: $58,181

44. Peoria, Arizona
> 1-yr. change in median home value: +26.3% (+$83,049)
> Median home value; June 2021: $399,025
> 1-yr. population change: +2.2% (+3,624)
> Population: 168,196
> 1-yr. change in median household income: +3.1% (+$2,284)
> Median household income: $75,323

43. Spokane, Washington
> 1-yr. change in median home value: +26.3% (+$71,574)
> Median home value; June 2021: $343,686
> 1-yr. population change: +1.2% (+2,549)
> Population: 217,353
> 1-yr. change in median household income: +5.2% (+$2,484)
> Median household income: $50,306

42. Spokane Valley, Washington
> 1-yr. change in median home value: +26.6% (+$76,325)
> Median home value; June 2021: $363,620
> 1-yr. population change: +1.6% (+1,492)
> Population: 97,562
> 1-yr. change in median household income: +5.0% (+$2,451)
> Median household income: $51,961

41. Largo, Florida
> 1-yr. change in median home value: +26.6% (+$55,475)
> Median home value; June 2021: $263,992
> 1-yr. population change: +1.1% (+887)
> Population: 84,130
> 1-yr. change in median household income: +4.5% (+$1,907)
> Median household income: $44,323

40. Scottsdale, Arizona
> 1-yr. change in median home value: +26.7% (+$144,037)
> Median home value; June 2021: $684,324
> 1-yr. population change: +1.9% (+4,576)
> Population: 250,602
> 1-yr. change in median household income: +4.3% (+$3,612)
> Median household income: $88,213
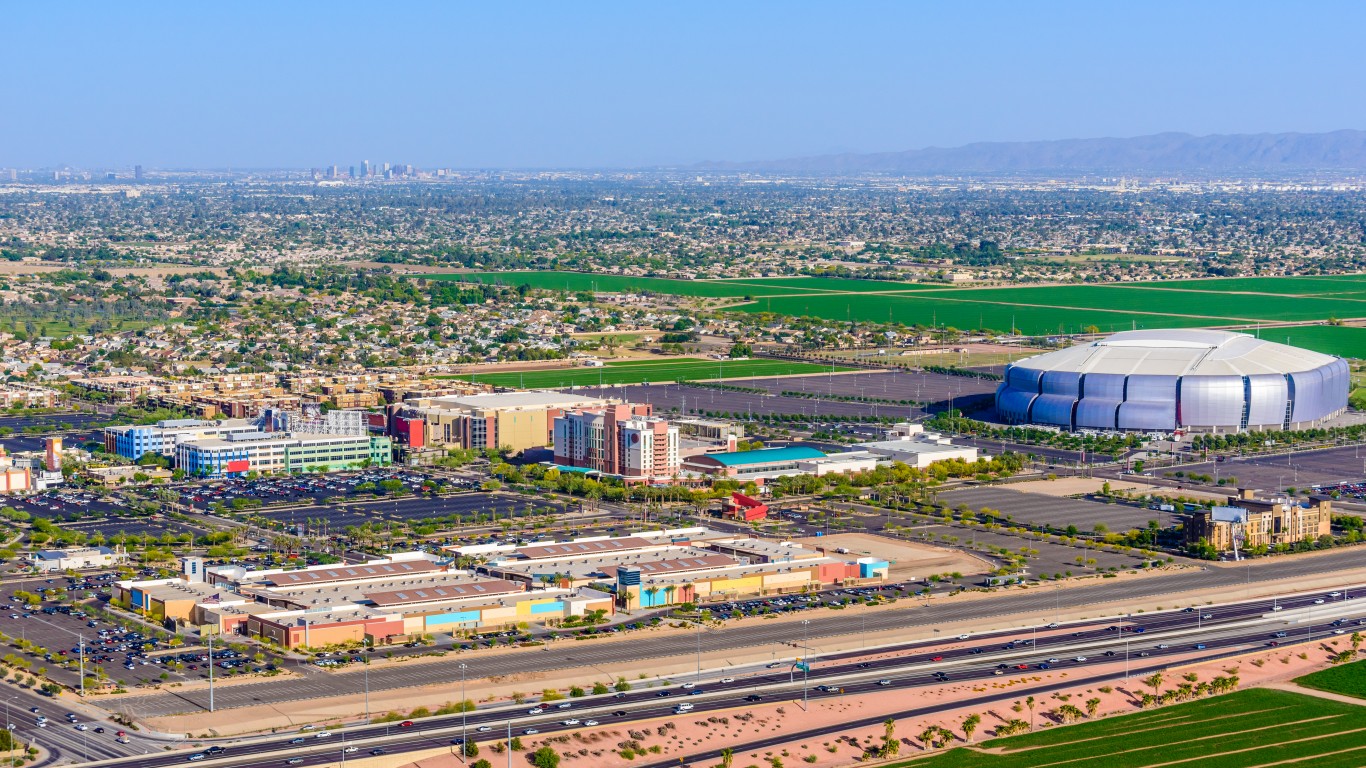
39. Glendale, Arizona
> 1-yr. change in median home value: +26.7% (+$70,231)
> Median home value; June 2021: $333,159
> 1-yr. population change: +0.9% (+2,299)
> Population: 247,813
> 1-yr. change in median household income: +5.2% (+$2,706)
> Median household income: $55,020

38. Bridgeport, Connecticut
> 1-yr. change in median home value: +26.8% (+$56,955)
> Median home value; June 2021: $269,675
> 1-yr. population change: –0.5% (-778)
> Population: 145,639
> 1-yr. change in median household income: +2.7% (+$1,221)
> Median household income: $46,662
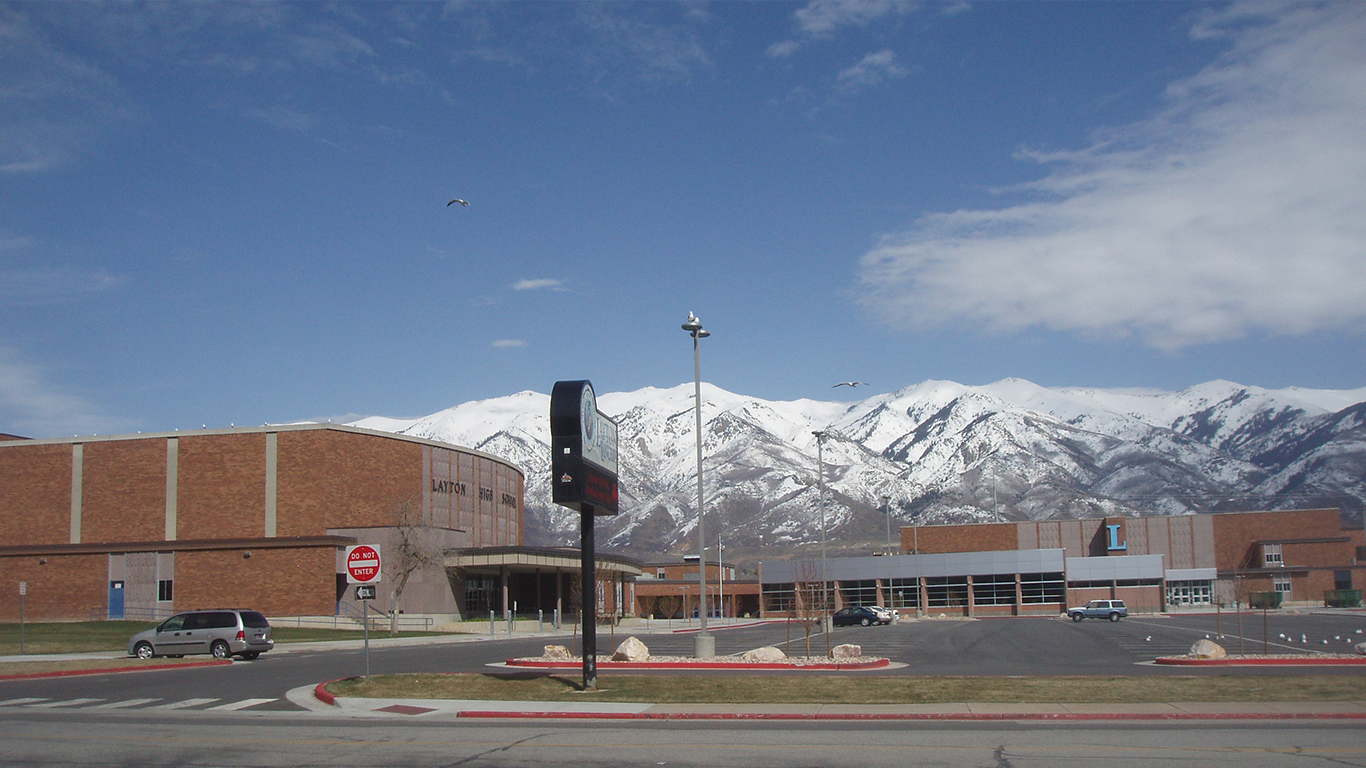
37. Layton, Utah
> 1-yr. change in median home value: +26.8% (+$93,928)
> Median home value; June 2021: $444,203
> 1-yr. population change: +1.5% (+1,091)
> Population: 76,197
> 1-yr. change in median household income: +3.4% (+$2,538)
> Median household income: $77,426
These are all the counties in Utah where COVID-19 is slowing (and where it’s still getting worse).

36. Flagstaff, Arizona
> 1-yr. change in median home value: +26.9% (+$107,638)
> Median home value; June 2021: $507,639
> 1-yr. population change: +1.7% (+1,200)
> Population: 72,402
> 1-yr. change in median household income: +4.9% (+$2,733)
> Median household income: $58,748
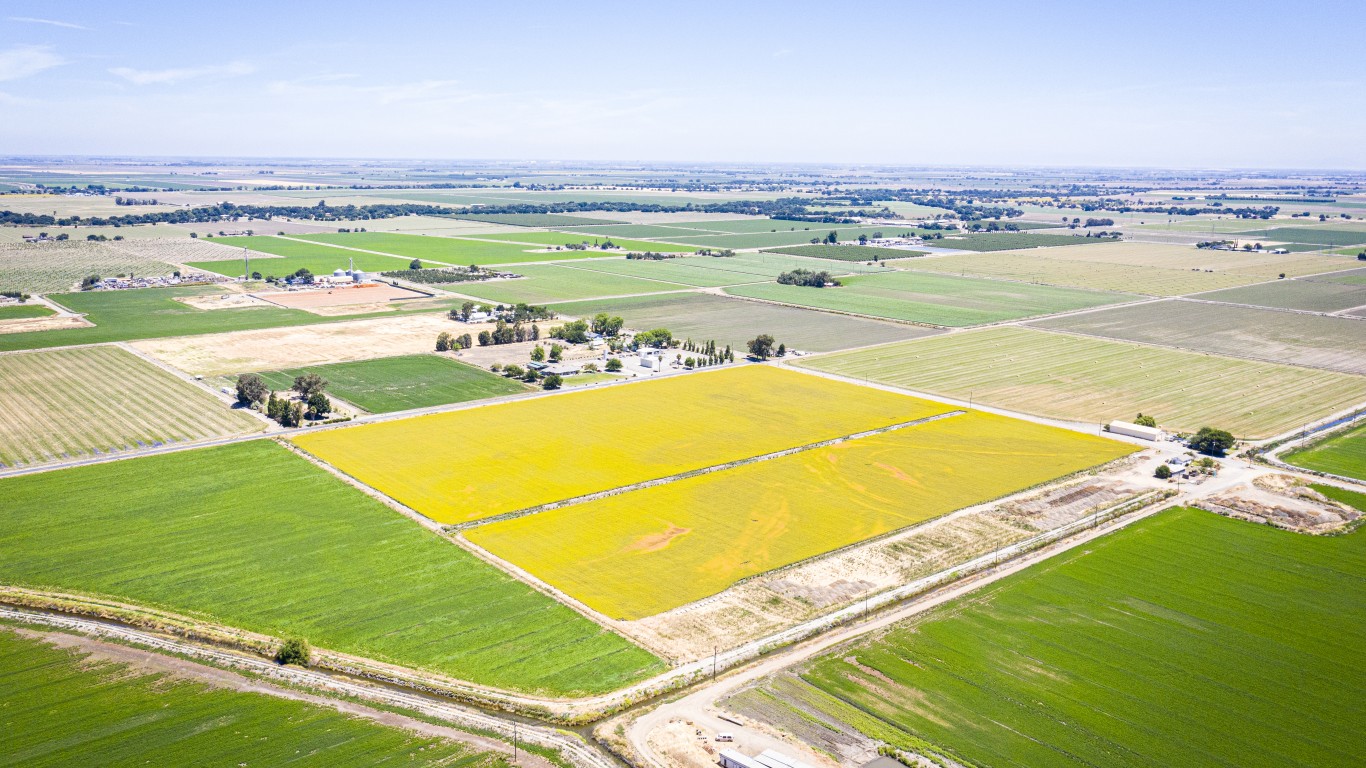
35. Tracy, California
> 1-yr. change in median home value: +27.0% (+$142,697)
> Median home value; June 2021: $671,438
> 1-yr. population change: +2.1% (+1,869)
> Population: 90,675
> 1-yr. change in median household income: +4.1% (+$3,656)
> Median household income: $92,046

34. Surprise, Arizona
> 1-yr. change in median home value: +27.0% (+$77,357)
> Median home value; June 2021: $363,701
> 1-yr. population change: +1.9% (+2,546)
> Population: 135,450
> 1-yr. change in median household income: +6.0% (+$3,916)
> Median household income: $69,076

33. Castro Valley, California
> 1-yr. change in median home value: +27.1% (+$235,524)
> Median home value; June 2021: $1,105,638
> 1-yr. population change: –0.4% (-275)
> Population: 63,013
> 1-yr. change in median household income: +6.6% (+$6,672)
> Median household income: $108,488
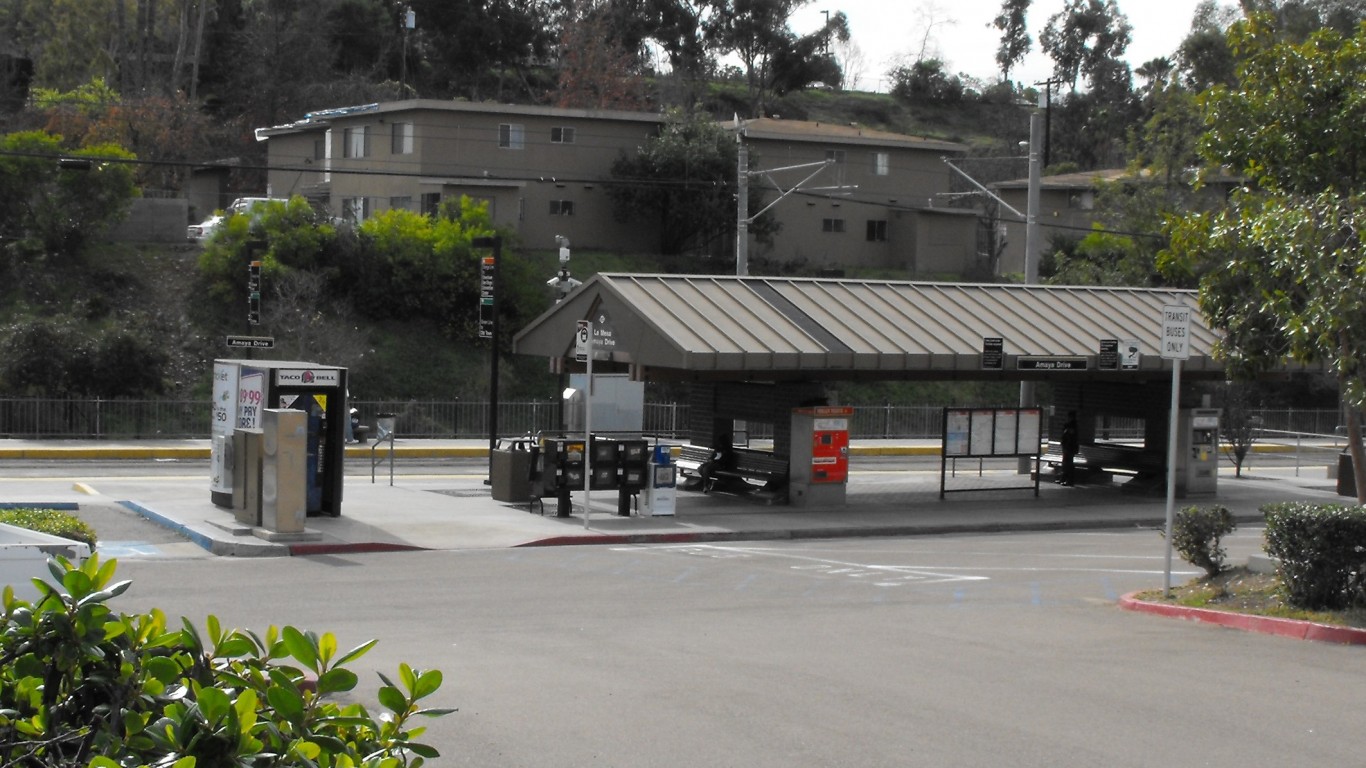
32. La Mesa, California
> 1-yr. change in median home value: +27.2% (+$162,591)
> Median home value; June 2021: $760,187
> 1-yr. population change: -0.0% (-6)
> Population: 59,556
> 1-yr. change in median household income: +3.3% (+$2,104)
> Median household income: $66,051

31. Orem, Utah
> 1-yr. change in median home value: +27.3% (+$95,250)
> Median home value; June 2021: $444,613
> 1-yr. population change: +1.4% (+1,297)
> Population: 96,725
> 1-yr. change in median household income: +5.2% (+$3,217)
> Median household income: $64,590
These are all the counties in Utah where COVID-19 is slowing (and where it’s still getting worse).

30. Phoenix, Arizona
> 1-yr. change in median home value: +27.4% (+$75,266)
> Median home value; June 2021: $350,077
> 1-yr. population change: +1.4% (+22,946)
> Population: 1,633,017
> 1-yr. change in median household income: +4.9% (+$2,694)
> Median household income: $57,459

29. Union City, California
> 1-yr. change in median home value: +27.6% (+$251,673)
> Median home value; June 2021: $1,164,901
> 1-yr. population change: +0.2% (+121)
> Population: 74,722
> 1-yr. change in median household income: +8.8% (+$9,233)
> Median household income: $114,681

28. Casa Grande, Arizona
> 1-yr. change in median home value: +27.8% (+$58,430)
> Median home value; June 2021: $268,895
> 1-yr. population change: +2.5% (+1,337)
> Population: 55,653
> 1-yr. change in median household income: +7.7% (+$3,772)
> Median household income: $52,841

27. Avondale, Arizona
> 1-yr. change in median home value: +27.8% (+$72,604)
> Median home value; June 2021: $333,544
> 1-yr. population change: +1.6% (+1,344)
> Population: 84,736
> 1-yr. change in median household income: +4.9% (+$2,887)
> Median household income: $61,825

26. Lake Havasu City, Arizona
> 1-yr. change in median home value: +27.8% (+$85,271)
> Median home value; June 2021: $391,544
> 1-yr. population change: +1.0% (+543)
> Population: 54,495
> 1-yr. change in median household income: +4.7% (+$2,418)
> Median household income: $53,605

25. Cleveland, Ohio
> 1-yr. change in median home value: +28.1% (+$20,146)
> Median home value; June 2021: $91,757
> 1-yr. population change: –0.5% (-2,116)
> Population: 385,282
> 1-yr. change in median household income: +6.5% (+$1,899)
> Median household income: $30,907
These are all the counties in Ohio where COVID-19 is slowing (and where it’s still getting worse).

24. Ogden, Utah
> 1-yr. change in median home value: +28.4% (+$71,464)
> Median home value; June 2021: $323,137
> 1-yr. population change: +0.8% (+707)
> Population: 86,833
> 1-yr. change in median household income: +7.0% (+$3,254)
> Median household income: $50,061
These are all the counties in Utah where COVID-19 is slowing (and where it’s still getting worse).

23. Missoula, Montana
> 1-yr. change in median home value: +28.5% (+$103,562)
> Median home value; June 2021: $467,571
> 1-yr. population change: +2.2% (+1,585)
> Population: 73,710
> 1-yr. change in median household income: +5.4% (+$2,416)
> Median household income: $47,426

22. San Tan Valley, Arizona
> 1-yr. change in median home value: +28.8% (+$77,515)
> Median home value; June 2021: $346,235
> 1-yr. population change: +3.7% (+3,462)
> Population: 96,692
> 1-yr. change in median household income: +0.8% (+$531)
> Median household income: $67,880

21. Jackson, Mississippi
> 1-yr. change in median home value: +29.1% (+$14,981)
> Median home value; June 2021: $66,445
> 1-yr. population change: –1.5% (-2,479)
> Population: 166,383
> 1-yr. change in median household income: +3.5% (+$1,325)
> Median household income: $38,888

20. St. Petersburg, Florida
> 1-yr. change in median home value: +29.1% (+$64,246)
> Median home value; June 2021: $284,709
> 1-yr. population change: +0.9% (+2,297)
> Population: 261,338
> 1-yr. change in median household income: +5.9% (+$3,166)
> Median household income: $56,982

19. Buckeye, Arizona
> 1-yr. change in median home value: +29.2% (+$76,035)
> Median home value; June 2021: $336,176
> 1-yr. population change: +6.3% (+4,114)
> Population: 69,744
> 1-yr. change in median household income: +8.8% (+$5,775)
> Median household income: $71,707
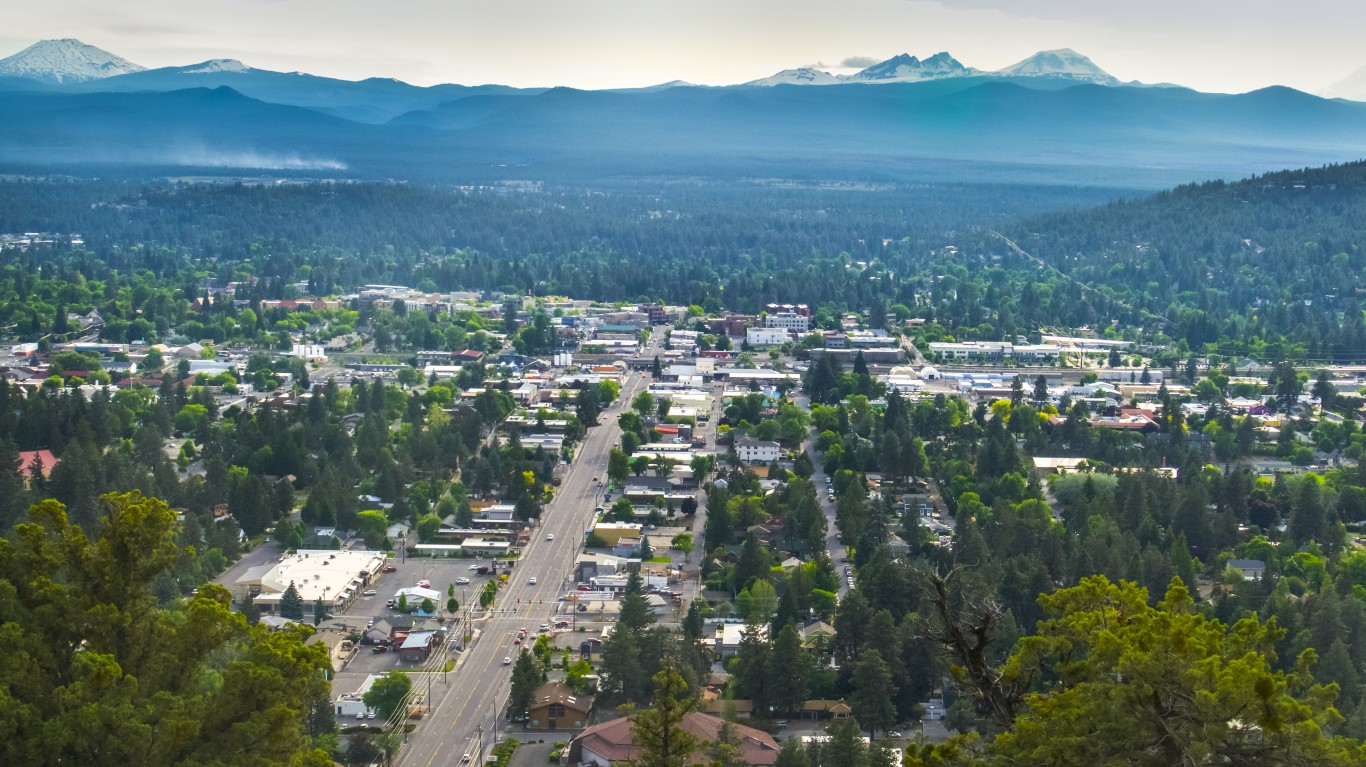
18. Bend, Oregon
> 1-yr. change in median home value: +29.7% (+$147,031)
> Median home value; June 2021: $641,497
> 1-yr. population change: +3.8% (+3,417)
> Population: 93,917
> 1-yr. change in median household income: +3.5% (+$2,194)
> Median household income: $65,662
These are all the counties in Oregon where COVID-19 is slowing (and where it’s still getting worse).

17. Toms River, New Jersey
> 1-yr. change in median home value: +30.7% (+$74,385)
> Median home value; June 2021: $317,016
> 1-yr. population change: +0.6% (+542)
> Population: 89,254
> 1-yr. change in median household income: +3.2% (+$2,488)
> Median household income: $79,889

16. Coeur d’Alene, Idaho
> 1-yr. change in median home value: +31.1% (+$116,656)
> Median home value; June 2021: $491,257
> 1-yr. population change: +1.9% (+931)
> Population: 50,540
> 1-yr. change in median household income: +4.5% (+$2,180)
> Median household income: $51,073
These are all the counties in Idaho where COVID-19 is slowing (and where it’s still getting worse).

15. Detroit, Michigan
> 1-yr. change in median home value: +31.2% (+$12,596)
> Median home value; June 2021: $52,905
> 1-yr. population change: –0.3% (-2,314)
> Population: 674,841
> 1-yr. change in median household income: +4.8% (+$1,413)
> Median household income: $30,894

14. Waterbury, Connecticut
> 1-yr. change in median home value: +32.1% (+$43,350)
> Median home value; June 2021: $178,519
> 1-yr. population change: –0.4% (-396)
> Population: 108,276
> 1-yr. change in median household income: +1.9% (+$784)
> Median household income: $42,401

13. Youngstown, Ohio
> 1-yr. change in median home value: +33.9% (+$9,934)
> Median home value; June 2021: $39,229
> 1-yr. population change: +0.1% (+49)
> Population: 64,783
> 1-yr. change in median household income: +6.9% (+$1,871)
> Median household income: $28,822
These are all the counties in Ohio where COVID-19 is slowing (and where it’s still getting worse).

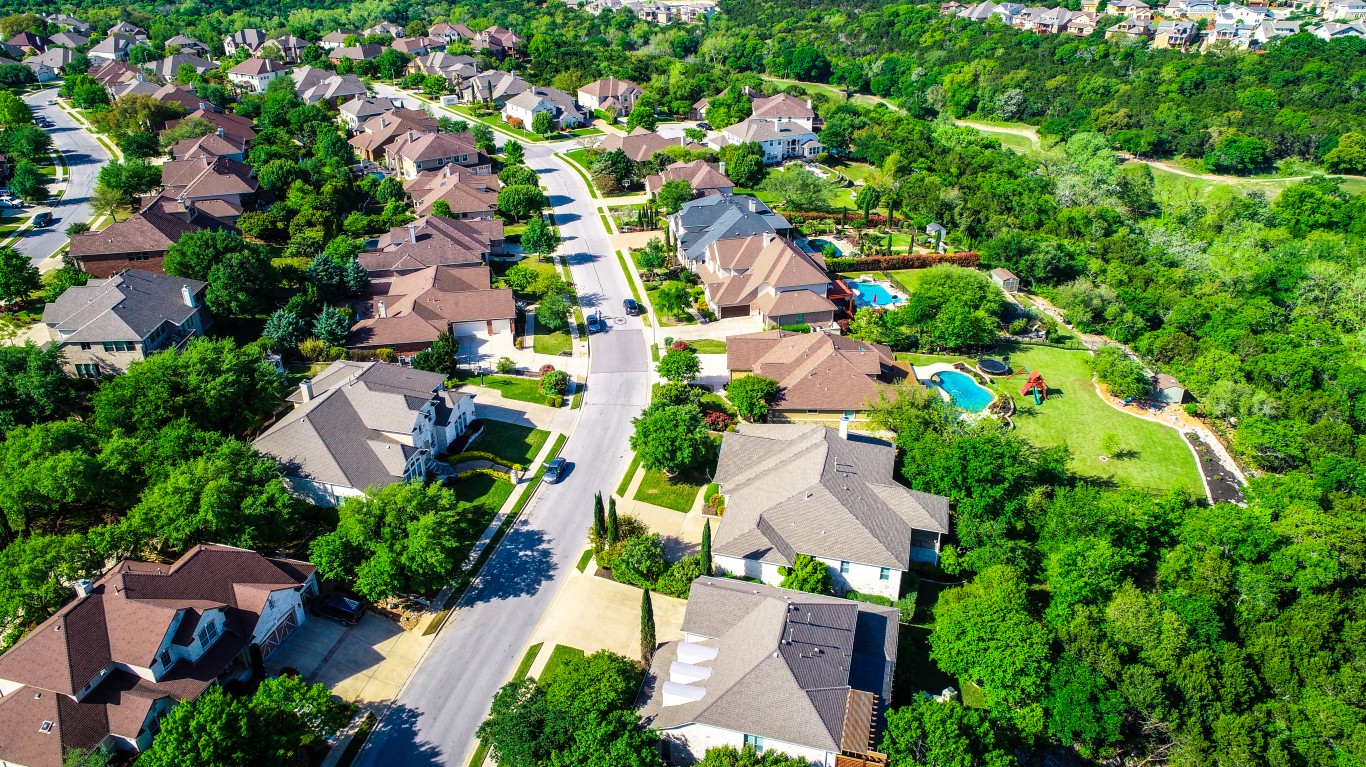
12. Austin, Texas
> 1-yr. change in median home value: +35.7% (+$147,967)
> Median home value; June 2021: $562,723
> 1-yr. population change: +1.6% (+15,052)
> Population: 950,807
> 1-yr. change in median household income: +6.1% (+$4,114)
> Median household income: $71,576
These are all the counties in Texas where COVID-19 is slowing (and where it’s still getting worse).
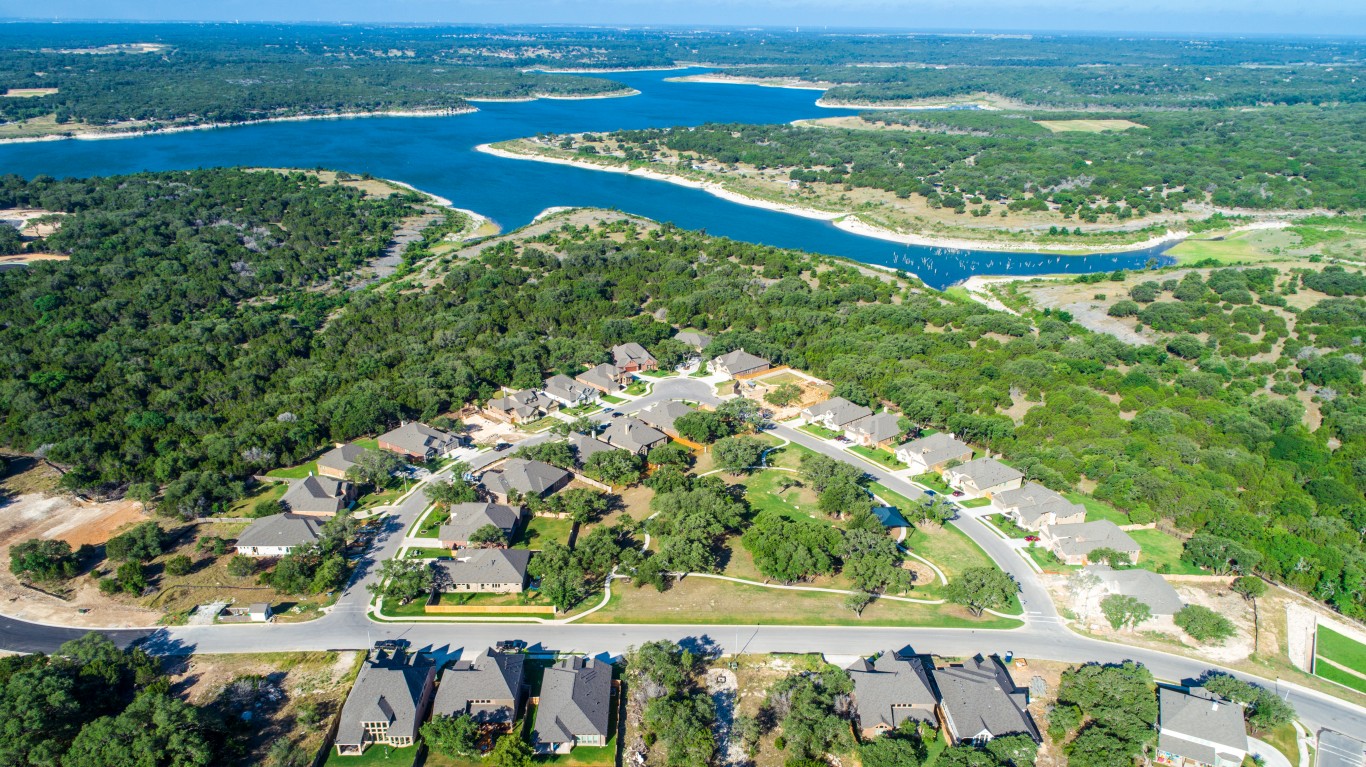
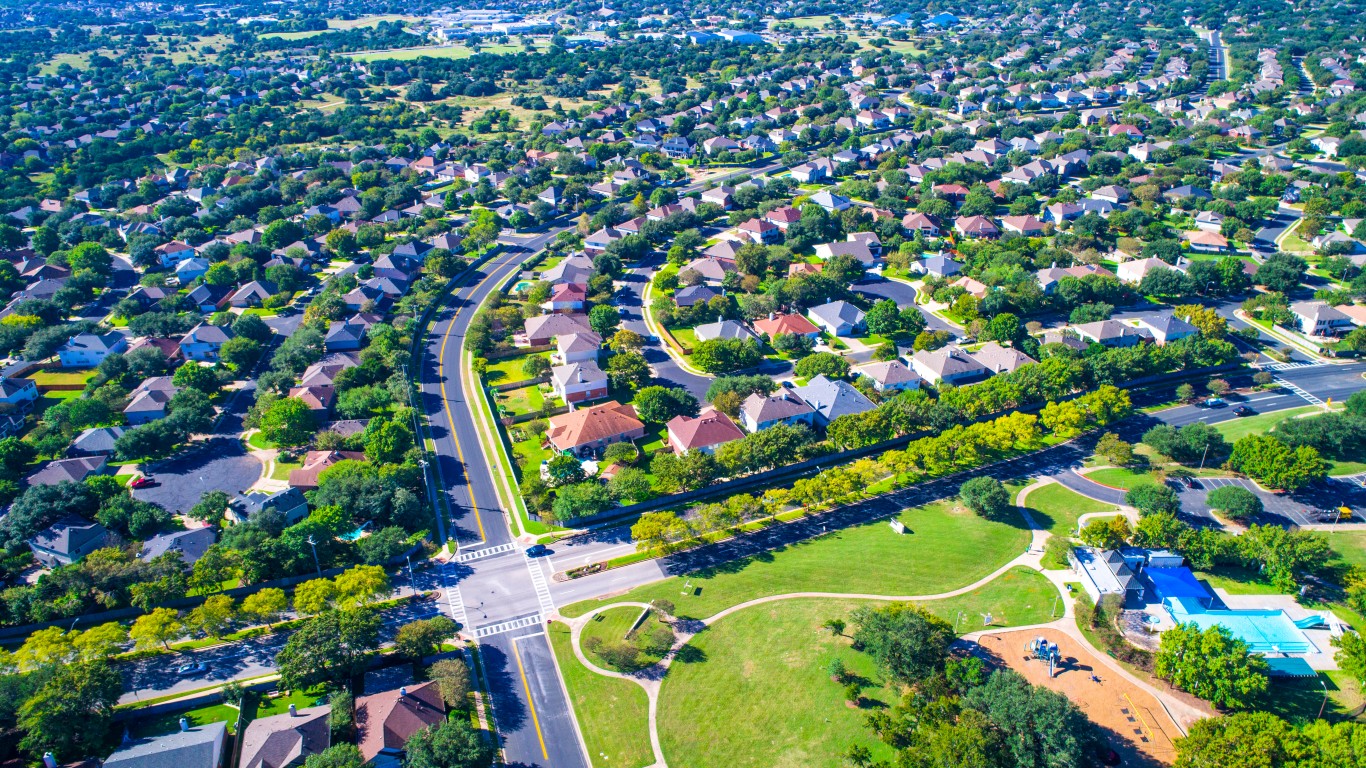
11. Georgetown, Texas
> 1-yr. change in median home value: +36.8% (+$118,090)
> Median home value; June 2021: $439,217
> 1-yr. population change: +6.3% (+4,200)
> Population: 71,004
> 1-yr. change in median household income: +3.4% (+$2,412)
> Median household income: $73,822
These are all the counties in Texas where COVID-19 is slowing (and where it’s still getting worse).

10. Flint, Michigan
> 1-yr. change in median home value: +37.4% (+$11,122)
> Median home value; June 2021: $40,882
> 1-yr. population change: –0.6% (-602)
> Population: 96,559
> 1-yr. change in median household income: +4.0% (+$1,117)
> Median household income: $28,834
9. Pflugerville, Texas
> 1-yr. change in median home value: +39.7% (+$113,666)
> Median home value; June 2021: $400,254
> 1-yr. population change: +3.3% (+1,980)
> Population: 61,737
> 1-yr. change in median household income: +6.1% (+$5,395)
> Median household income: $93,627
These are all the counties in Texas where COVID-19 is slowing (and where it’s still getting worse).
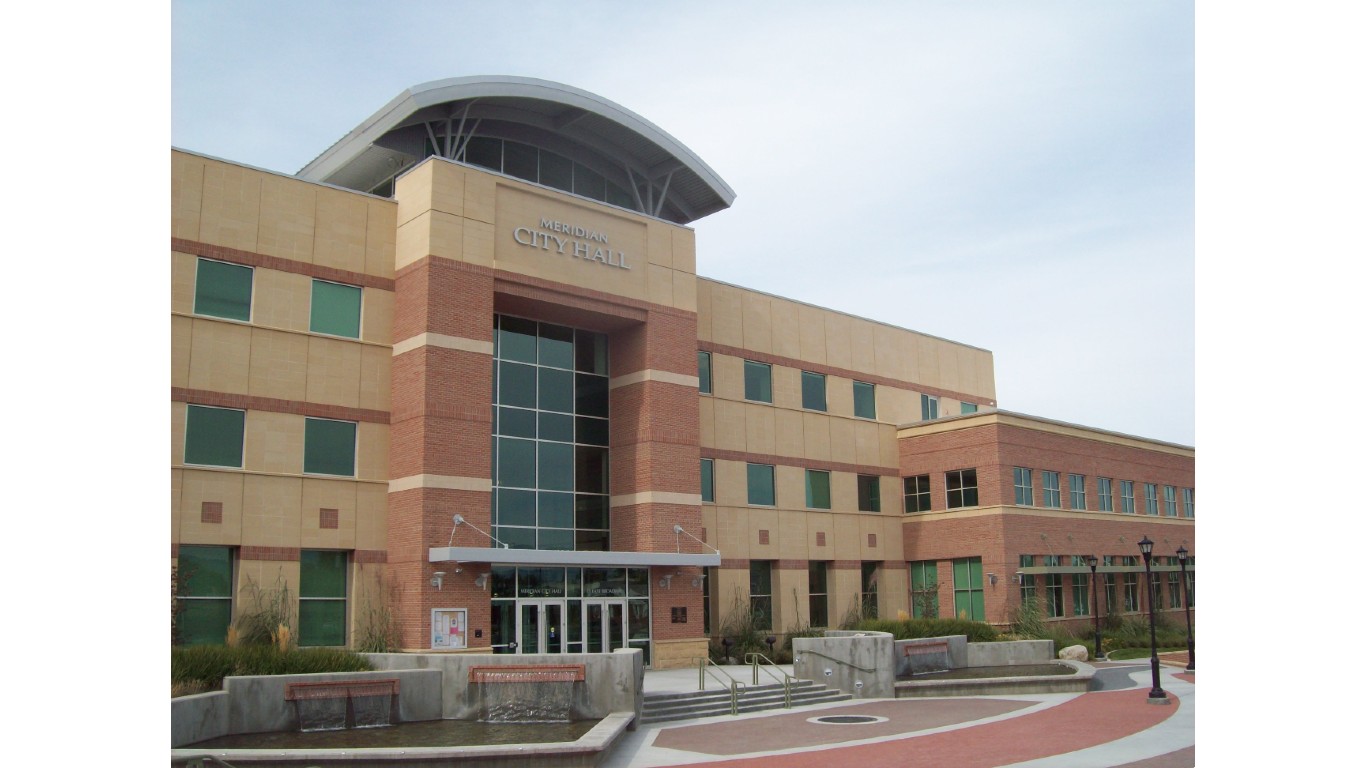
8. Meridian, Idaho
> 1-yr. change in median home value: +39.9% (+$147,489)
> Median home value; June 2021: $517,003
> 1-yr. population change: +5.0% (+4,897)
> Population: 101,905
> 1-yr. change in median household income: +4.8% (+$3,258)
> Median household income: $71,389
These are all the counties in Idaho where COVID-19 is slowing (and where it’s still getting worse).
7. Cedar Park, Texas
> 1-yr. change in median home value: +41.0% (+$142,329)
> Median home value; June 2021: $489,474
> 1-yr. population change: +3.3% (+2,399)
> Population: 74,814
> 1-yr. change in median household income: +2.1% (+$2,174)
> Median household income: $104,019
These are all the counties in Texas where COVID-19 is slowing (and where it’s still getting worse).

6. Boise City, Idaho
> 1-yr. change in median home value: +41.1% (+$144,307)
> Median home value; June 2021: $495,485
> 1-yr. population change: +0.8% (+1,815)
> Population: 226,115
> 1-yr. change in median household income: +5.7% (+$3,237)
> Median household income: $60,035
These are all the counties in Idaho where COVID-19 is slowing (and where it’s still getting worse).
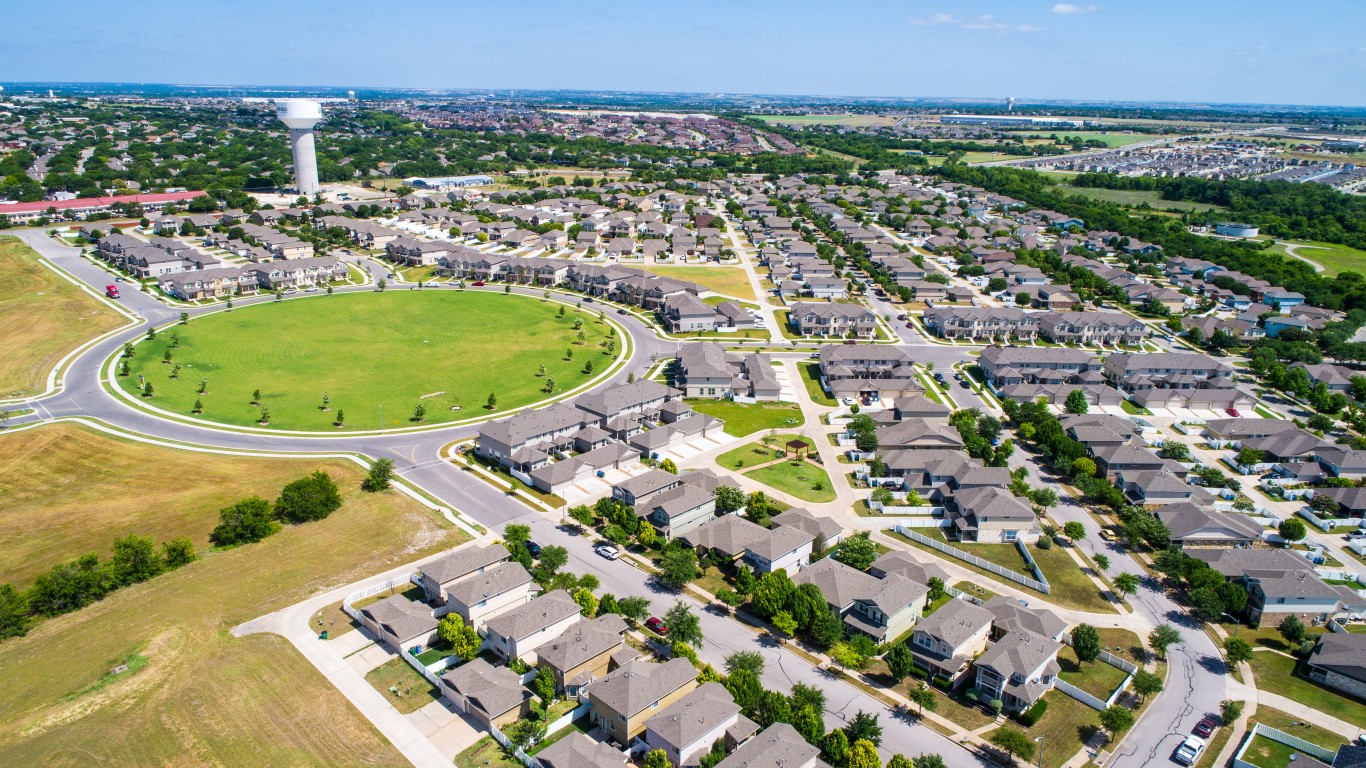
5. Round Rock, Texas
> 1-yr. change in median home value: +41.7% (+$129,273)
> Median home value; June 2021: $439,069
> 1-yr. population change: +3.6% (+4,277)
> Population: 124,434
> 1-yr. change in median household income: +2.5% (+$2,039)
> Median household income: $82,676
These are all the counties in Texas where COVID-19 is slowing (and where it’s still getting worse).

4. Caldwell, Idaho
> 1-yr. change in median home value: +42.6% (+$109,366)
> Median home value; June 2021: $366,380
> 1-yr. population change: +3.2% (+1,682)
> Population: 54,887
> 1-yr. change in median household income: +3.3% (+$1,587)
> Median household income: $49,046
These are all the counties in Idaho where COVID-19 is slowing (and where it’s still getting worse).

3. Leander, Texas
> 1-yr. change in median home value: +42.7% (+$133,469)
> Median home value; June 2021: $446,367
> 1-yr. population change: +15.7% (+7,297)
> Population: 53,716
> 1-yr. change in median household income: +10.2% (+$9,446)
> Median household income: $101,872
These are all the counties in Texas where COVID-19 is slowing (and where it’s still getting worse).

2. Nampa, Idaho
> 1-yr. change in median home value: +42.8% (+$114,752)
> Median home value; June 2021: $382,977
> 1-yr. population change: +2.5% (+2,289)
> Population: 93,952
> 1-yr. change in median household income: +9.3% (+$4,155)
> Median household income: $48,846
These are all the counties in Idaho where COVID-19 is slowing (and where it’s still getting worse).

1. Rochester, New York
> 1-yr. change in median home value: +47.5% (+$114,369)
> Median home value; June 2021: $355,292
> 1-yr. population change: –0.4% (-930)
> Population: 206,848
> 1-yr. change in median household income: +6.6% (+$2,191)
> Median household income: $35,590