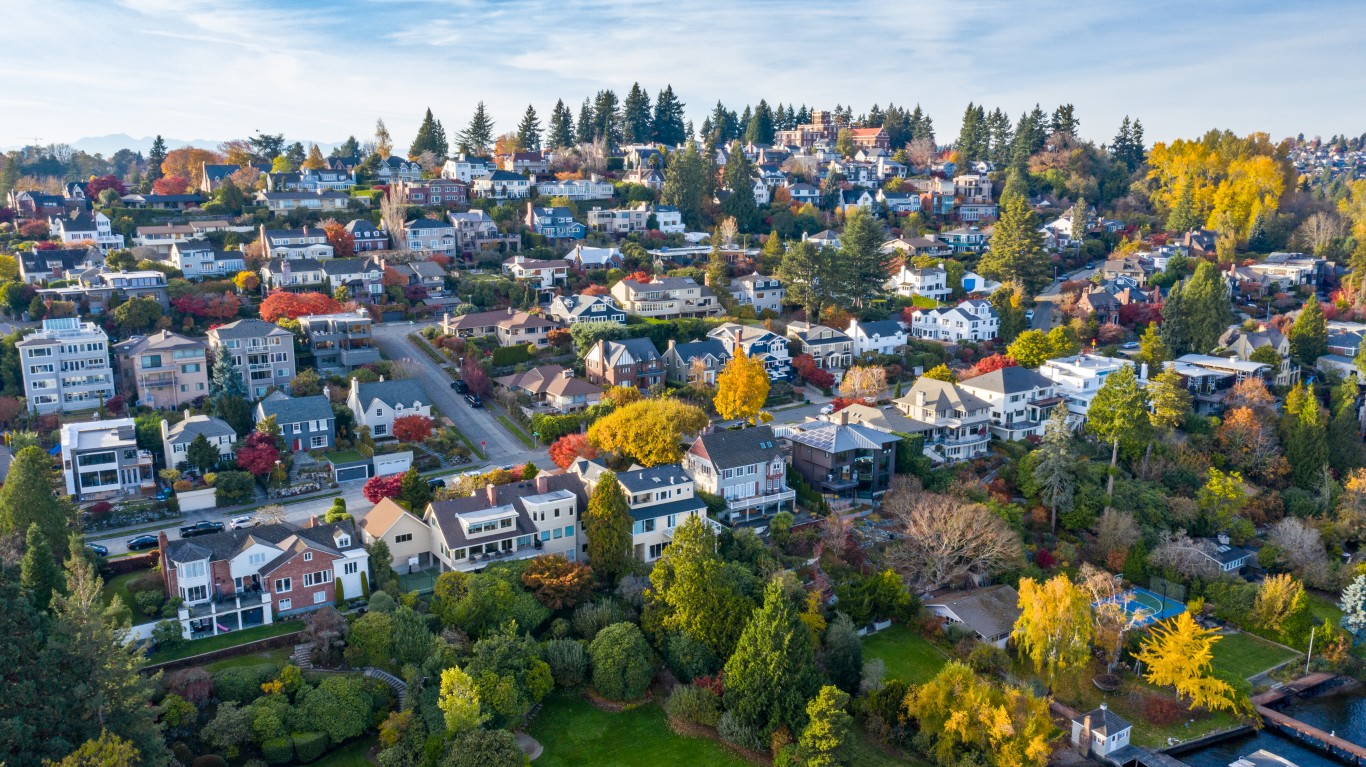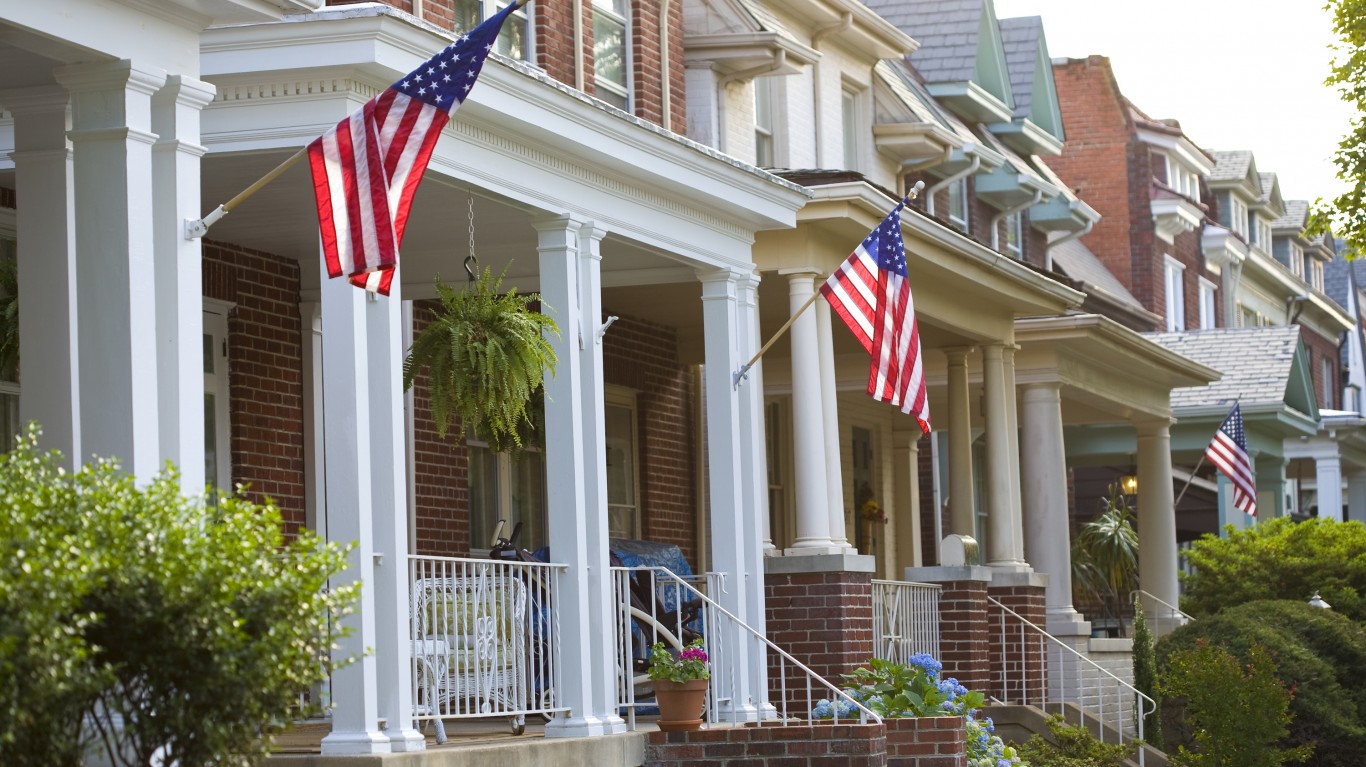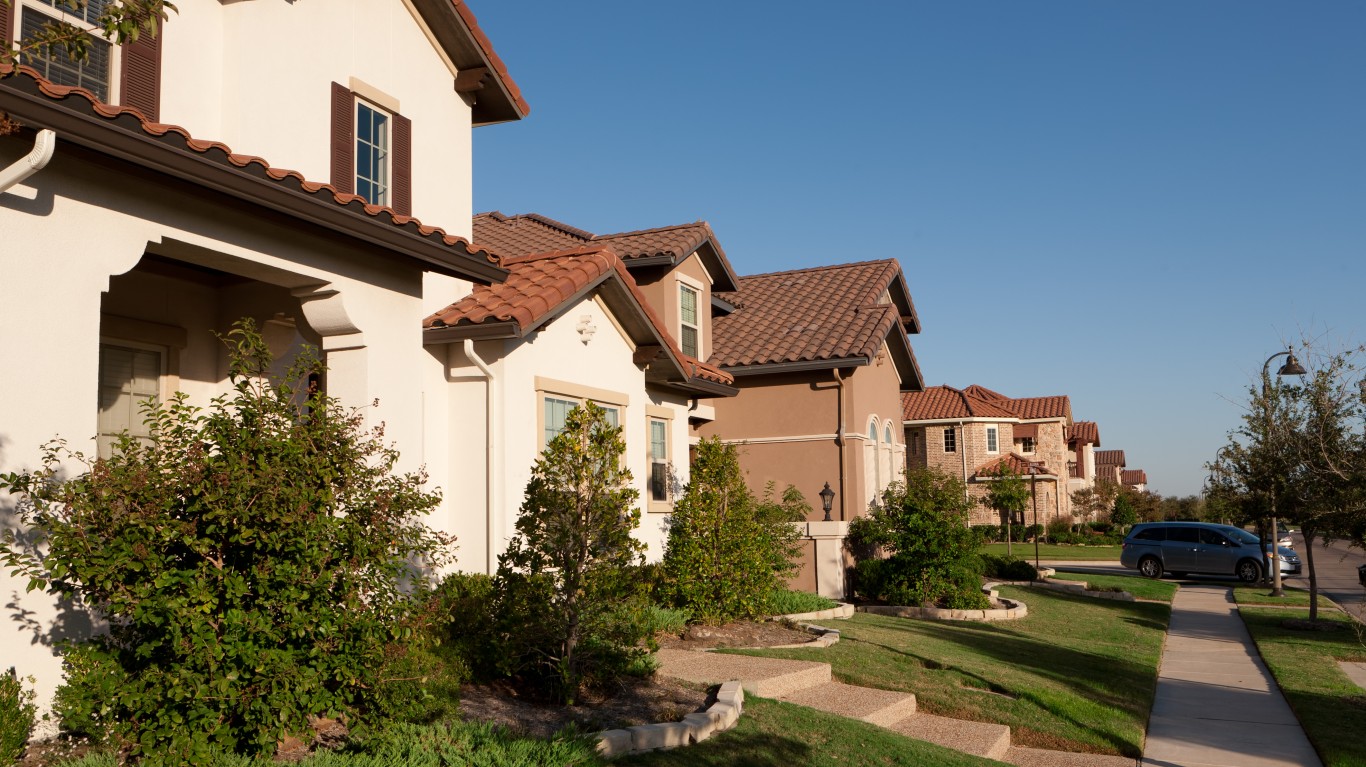
The median price of a single-family dwelling across the country today, according to the real estate website Zillow, more than doubled between 1999 and this year, from $111,000 to $269,039. With that in mind, you might consider a house costing $500,000 or more to be a luxury abode.
In some locales, however, you’d be lucky to find even an “average” house for that. In such cities, as many as 75% to 100% of the homes for sale are listed for $500,000 and up. Talk about sticker shock. (Looking for a more affordable place? Try these cities where homes are under $100,000.)
Reviewing data from the U.S. Census Bureau’s 2019 American Community Survey (ACS) five-year estimates, 24/7 Wall St. has identified the 25 cities where it would be difficult if not impossible to find a house for less than $500,000. (We ranked only census-designated places, cities, and towns with at least 50,000 residents.) All data comes from the ACS except percent of population change, which we calculated using ACS data.
It might come as no surprise to learn that the overwhelming majority of those cities — 22 out of the 25 — are in California. No wonder they call it the Golden State.
The top two slots on our list are occupied by the Sonoma County town of Petaluma and the Oakland suburb of Castro Valley, in both of which all homes are worth $500,000 or more. But less expected places like Franklin, Tennessee, and Syracuse, New York, also have a large percentage of homes in the $500,000 range and up. (See the most (and least) expensive states to buy a home.) .
Click here to see where most homes are worth more than 500k.
25. Glendora, California
> Homes worth at least $500,000: 78.9%
> Median home value: $601,800 — 83 out of 835 cities
> Median household income: $96,132 — 112 out of 835 cities
> 5-year pop. change: +1.3% — 521 out of 835 cities
> Population: 51,801 — 802 out of 835 cities
[in-text-ad]
24. Huntington Park, California
> Homes worth at least $500,000: 79.2%
> Median home value: $412,600 — 174 out of 835 cities
> Median household income: $42,447 — 758 out of 835 cities
> 5-year pop. change: -1.1% — 750 out of 835 cities
> Population: 58,353 — 697 out of 835 cities

23. Franklin, Tennessee
> Homes worth at least $500,000: 79.6%
> Median home value: $412,400 — 175 out of 835 cities
> Median household income: $98,231 — 103 out of 835 cities
> 5-year pop. change: +13.7% — 41 out of 835 cities
> Population: 77,939 — 468 out of 835 cities

22. Monterey Park, California
> Homes worth at least $500,000: 81.4%
> Median home value: $616,000 — 77 out of 835 cities
> Median household income: $61,819 — 417 out of 835 cities
> 5-year pop. change: -1.1% — 746 out of 835 cities
> Population: 60,439 — 664 out of 835 cities
[in-text-ad-2]

21. Costa Mesa, California
> Homes worth at least $500,000: 81.4%
> Median home value: $749,400 — 46 out of 835 cities
> Median household income: $84,138 — 189 out of 835 cities
> 5-year pop. change: +0.7% — 576 out of 835 cities
> Population: 113,159 — 264 out of 835 cities
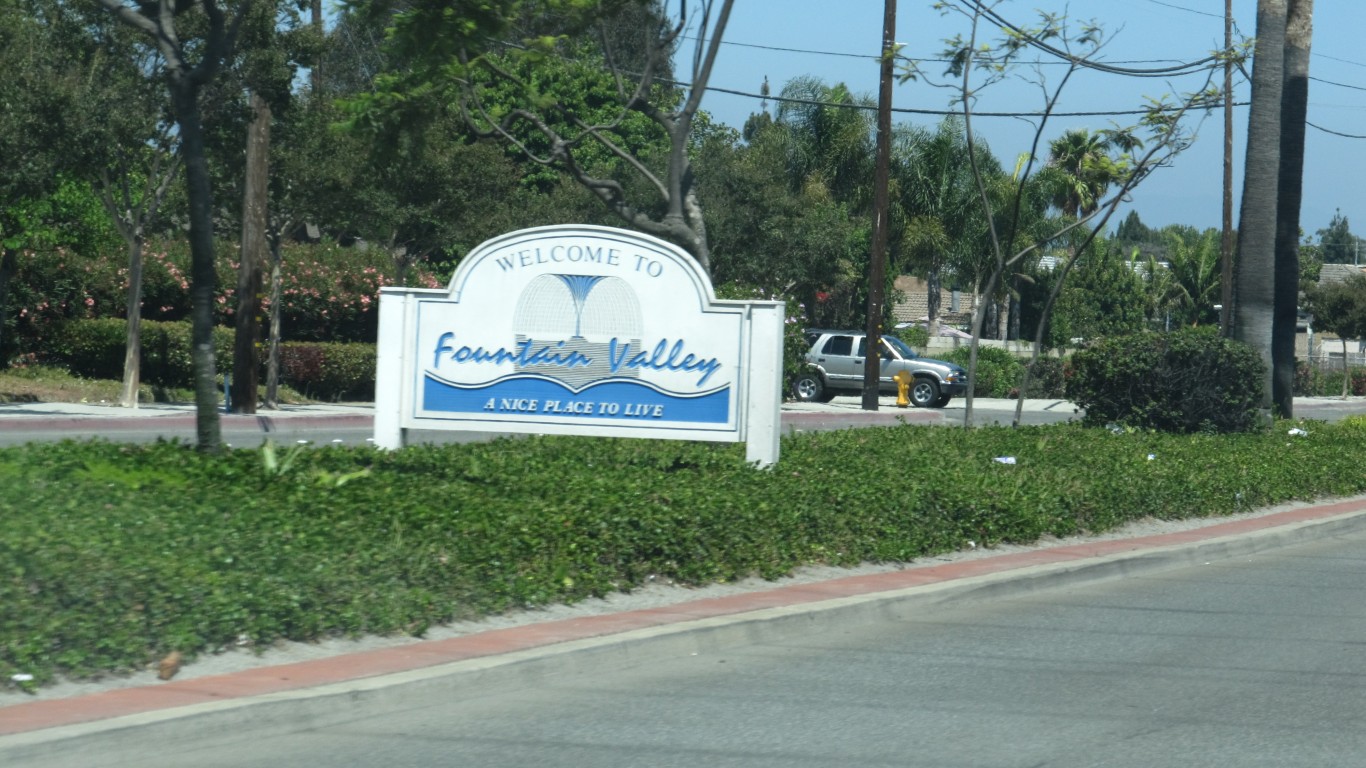
20. Fountain Valley, California
> Homes worth at least $500,000: 81.5%
> Median home value: $734,800 — 49 out of 835 cities
> Median household income: $93,075 — 133 out of 835 cities
> 5-year pop. change: -1.2% — 760 out of 835 cities
> Population: 56,026 — 731 out of 835 cities
[in-text-ad]
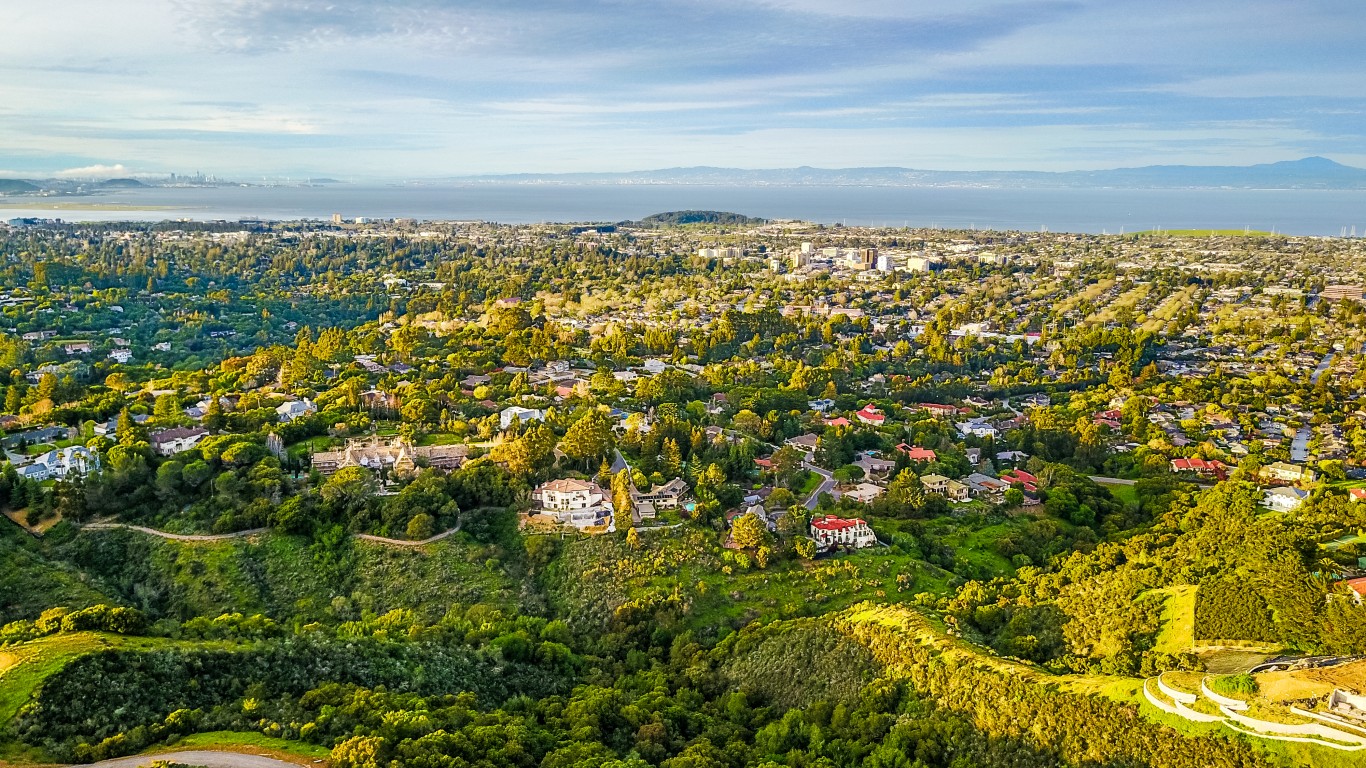
19. San Mateo, California
> Homes worth at least $500,000: 82.3%
> Median home value: $1,098,400 — 08 out of 835 cities
> Median household income: $124,842 — 25 out of 835 cities
> 5-year pop. change: +3.0% — 394 out of 835 cities
> Population: 104,333 — 305 out of 835 cities

18. Syracuse, New York
> Homes worth at least $500,000: 84.9%
> Median home value: $94,400 — 801 out of 835 cities
> Median household income: $38,276 — 805 out of 835 cities
> 5-year pop. change: -1.2% — 756 out of 835 cities
> Population: 142,874 — 189 out of 835 cities

17. Norwalk, California
> Homes worth at least $500,000: 85.4%
> Median home value: $440,800 — 156 out of 835 cities
> Median household income: $70,667 — 316 out of 835 cities
> 5-year pop. change: -1.3% — 768 out of 835 cities
> Population: 105,304 — 301 out of 835 cities
[in-text-ad-2]
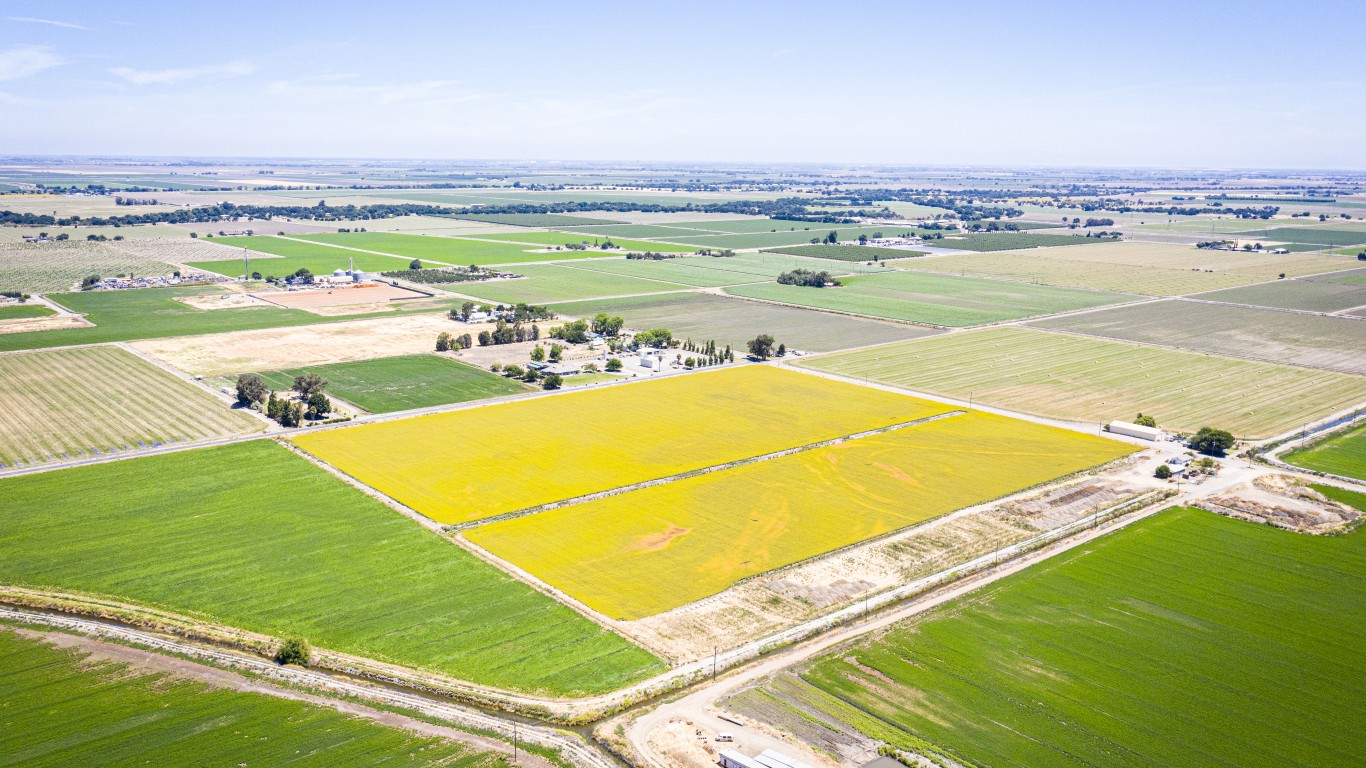
16. Tracy, California
> Homes worth at least $500,000: 85.7%
> Median home value: $446,200 — 151 out of 835 cities
> Median household income: $92,046 — 139 out of 835 cities
> 5-year pop. change: +6.3% — 186 out of 835 cities
> Population: 90,675 — 375 out of 835 cities

15. Pleasanton, California
> Homes worth at least $500,000: 85.8%
> Median home value: $986,800 — 14 out of 835 cities
> Median household income: $156,400 — 6 out of 835 cities
> 5-year pop. change: +8.9% — 100 out of 835 cities
> Population: 81,717 — 433 out of 835 cities
[in-text-ad]

14. Castle Rock, Colorado
> Homes worth at least $500,000: 86.9%
> Median home value: $422,100 — 167 out of 835 cities
> Median household income: $109,700 — 55 out of 835 cities
> 5-year pop. change: +19.7% — 18 out of 835 cities
> Population: 62,417 — 635 out of 835 cities

13. San Buenaventura, California
> Homes worth at least $500,000: 87.5%
> Median home value: $570,100 — 96 out of 835 cities
> Median household income: $78,882 — 228 out of 835 cities
> 5-year pop. change: +0.9% — 553 out of 835 cities
> Population: 109,910 — 281 out of 835 cities

12. Davis, California
> Homes worth at least $500,000: 88.3%
> Median home value: $652,300 — 66 out of 835 cities
> Median household income: $69,379 — 327 out of 835 cities
> 5-year pop. change: +3.1% — 390 out of 835 cities
> Population: 68,543 — 552 out of 835 cities
[in-text-ad-2]

11. Walnut Creek, California
> Homes worth at least $500,000: 88.8%
> Median home value: $793,100 — 37 out of 835 cities
> Median household income: $105,948 — 74 out of 835 cities
> 5-year pop. change: +4.1% — 321 out of 835 cities
> Population: 69,567 — 548 out of 835 cities

10. Moreno Valley, California
> Homes worth at least $500,000: 89.5%
> Median home value: $312,000 — 310 out of 835 cities
> Median household income: $66,134 — 353 out of 835 cities
> 5-year pop. change: +3.2% — 375 out of 835 cities
> Population: 207,289 — 112 out of 835 cities
[in-text-ad]
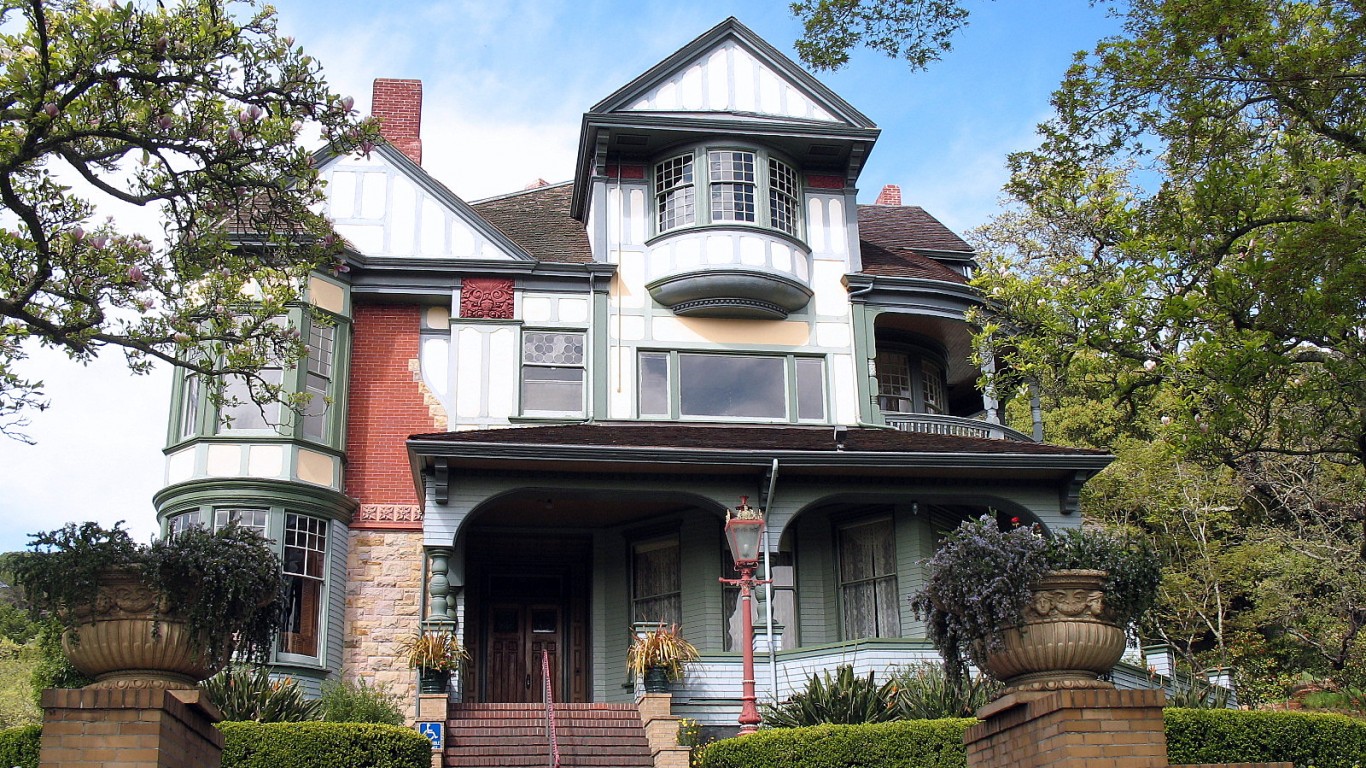
9. San Rafael, California
> Homes worth at least $500,000: 90.6%
> Median home value: $923,100 — 20 out of 835 cities
> Median household income: $91,742 — 143 out of 835 cities
> 5-year pop. change: -0.1% — 646 out of 835 cities
> Population: 58,775 — 692 out of 835 cities
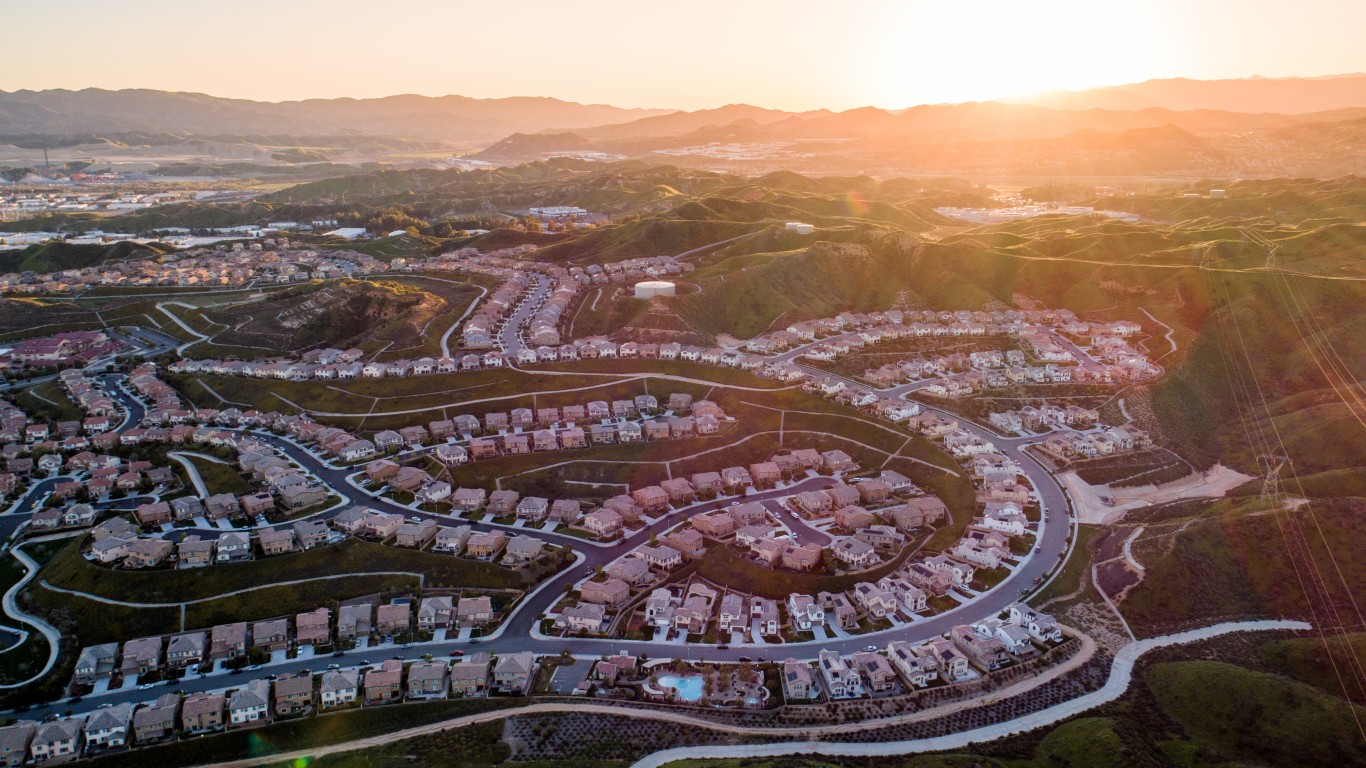
8. Santa Clarita, California
> Homes worth at least $500,000: 91.1%
> Median home value: $537,000 — 111 out of 835 cities
> Median household income: $99,666 — 98 out of 835 cities
> 5-year pop. change: +18.6% — 21 out of 835 cities
> Population: 213,411 — 105 out of 835 cities

7. Santee, California
> Homes worth at least $500,000: 91.4%
> Median home value: $445,500 — 153 out of 835 cities
> Median household income: $87,098 — 167 out of 835 cities
> 5-year pop. change: +2.7% — 410 out of 835 cities
> Population: 57,797 — 706 out of 835 cities
[in-text-ad-2]

6. Fairfield, California
> Homes worth at least $500,000: 92.6%
> Median home value: $409,000 — 178 out of 835 cities
> Median household income: $84,557 — 188 out of 835 cities
> 5-year pop. change: +5.3% — 236 out of 835 cities
> Population: 115,282 — 256 out of 835 cities

5. La Habra, California
> Homes worth at least $500,000: 92.9%
> Median home value: $539,200 — 108 out of 835 cities
> Median household income: $79,325 — 225 out of 835 cities
> 5-year pop. change: -1.8% — 799 out of 835 cities
> Population: 60,594 — 660 out of 835 cities
[in-text-ad]

4. Rialto, California
> Homes worth at least $500,000: 93.4%
> Median home value: $313,400 — 307 out of 835 cities
> Median household income: $61,518 — 422 out of 835 cities
> 5-year pop. change: +1.0% — 547 out of 835 cities
> Population: 103,045 — 311 out of 835 cities

3. Aliso Viejo, California
> Homes worth at least $500,000: 95.7%
> Median home value: $632,900 — 73 out of 835 cities
> Median household income: $112,689 — 47 out of 835 cities
> 5-year pop. change: +1.7% — 486 out of 835 cities
> Population: 50,663 — 818 out of 835 cities

1. Petaluma, California
> Homes worth at least $500,000: 100.0%
> Median home value: $633,900 — 72 out of 835 cities
> Median household income: $91,528 — 144 out of 835 cities
> 5-year pop. change: +2.4% — 433 out of 835 cities
> Population: 60,767 — 657 out of 835 cities
[in-text-ad-2]

1. Castro Valley, California
> Homes worth at least $500,000: 100.0%
> Median home value: $741,500 — 48 out of 835 cities
> Median household income: $108,488 — 66 out of 835 cities
> 5-year pop. change: +1.6% — 494 out of 835 cities
> Population: 63,013 — 627 out of 835 cities
The Average American Has No Idea How Much Money You Can Make Today (Sponsor)
The last few years made people forget how much banks and CD’s can pay. Meanwhile, interest rates have spiked and many can afford to pay you much more, but most are keeping yields low and hoping you won’t notice.
But there is good news. To win qualified customers, some accounts are paying almost 10x the national average! That’s an incredible way to keep your money safe and earn more at the same time. Our top pick for high yield savings accounts includes other benefits as well. You can earn up to 3.80% with a Checking & Savings Account today Sign up and get up to $300 with direct deposit. No account fees. FDIC Insured.
Click here to see how much more you could be earning on your savings today. It takes just a few minutes to open an account to make your money work for you.
Our top pick for high yield savings accounts includes other benefits as well. You can earn up to 4.00% with a Checking & Savings Account from Sofi. Sign up and get up to $300 with direct deposit. No account fees. FDIC Insured.
Thank you for reading! Have some feedback for us?
Contact the 24/7 Wall St. editorial team.

 24/7 Wall St.
 24/7 Wall St.
 24/7 Wall St.
