Special Report
The County In Every State Where The Most People Live Below The Poverty Line

Published:
Last Updated:

The World Bank predicts that the effects of the pandemic will have pushed somewhere between 88 million and 115 million people worldwide into extreme poverty some time this year. A number of Americans could certainly be among those falling into poverty. Even before the spread of COVID-19, parts of the country already struggled much more with poverty than the nation overall.
The U.S. five-year poverty rate as of 2019, the most recent year available through the census, is 13.4%. In some parts of the U.S., poverty rates are considerably higher, including a number of counties where more than 30.0% of the population lives in a household with poverty-level income.
Many Americans owe months of back rent, and many still face an unstable job situation or ongoing unemployment. According to a survey conducted between late May and early June by the Center on Budget and Policy Priorities, 27% of Americans surveyed said that it was somewhat difficult or very difficult to afford their usual expenses.
To determine the county with the highest poverty rate in every state, 24/7 Wall St. reviewed five-year estimates of the percentage of people in each state who live below the poverty line from the U.S. Census Bureau’s 2019 American Community Survey. For reference, the U.S. Department of Health and Human services sets the official poverty threshold at an annual income of no more than approximately $26,000 for a family of four.
Poverty can be found all across the country. Still, in some states, even the poorest county has a lower poverty rate than the U.S. as a whole. In Connecticut, for example, the poorest county — New Haven — has a poverty rate of 11.7%, compared to the national five-year poverty rate of 13.4%.
Click here to see the county in every state where the most people live below the poverty line.
Click here to see our detailed methodology.
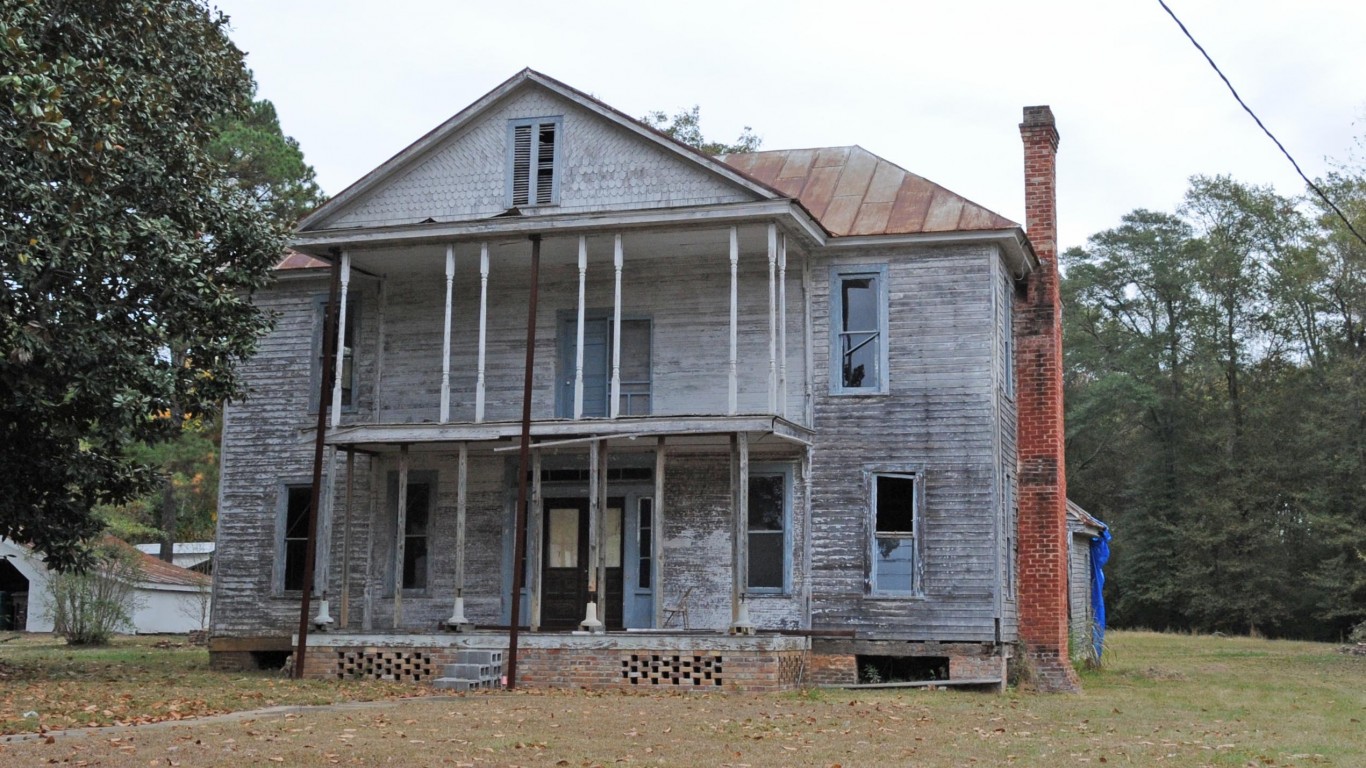
Alabama: Greene County
> Poverty rate: 38.1% (Alabama: 16.7%)
> Number of people living below poverty line: 3,140 (Alabama: 795,989)
> Households receiving SNAP benefits: 38.9% (Alabama: 14.0%)
> Median household income: $24,145 (Alabama: $50,536)
[in-text-ad]

Alaska: Kusilvak Census Area
> Poverty rate: 39.0% (Alaska: 10.7%)
> Number of people living below poverty line: 3,195 (Alaska: 76,933)
> Households receiving SNAP benefits: 59.2% (Alaska: 10.5%)
> Median household income: $36,754 (Alaska: $77,640)

Arizona: Apache County
> Poverty rate: 35.5% (Arizona: 15.1%)
> Number of people living below poverty line: 24,963 (Arizona: 1,043,764)
> Households receiving SNAP benefits: 25.9% (Arizona: 11.1%)
> Median household income: $32,508 (Arizona: $58,945)

Arkansas: Phillips County
> Poverty rate: 34.5% (Arkansas: 17.0%)
> Number of people living below poverty line: 6,362 (Arkansas: 496,260)
> Households receiving SNAP benefits: 31.0% (Arkansas: 12.1%)
> Median household income: $29,320 (Arkansas: $47,597)
[in-text-ad-2]

California: Imperial County
> Poverty rate: 24.1% (California: 13.4%)
> Number of people living below poverty line: 41,100 (California: 5,149,742)
> Households receiving SNAP benefits: 21.3% (California: 8.9%)
> Median household income: $47,622 (California: $75,235)

Colorado: Bent County
> Poverty rate: 29.5% (Colorado: 10.3%)
> Number of people living below poverty line: 1,177 (Colorado: 565,873)
> Households receiving SNAP benefits: 29.9% (Colorado: 7.5%)
> Median household income: $30,900 (Colorado: $72,331)
[in-text-ad]

Connecticut: New Haven County
> Poverty rate: 11.7% (Connecticut: 9.9%)
> Number of people living below poverty line: 97,553 (Connecticut: 344,146)
> Households receiving SNAP benefits: 14.8% (Connecticut: 11.9%)
> Median household income: $69,905 (Connecticut: $78,444)

Delaware: Kent County
> Poverty rate: 13.5% (Delaware: 11.8%)
> Number of people living below poverty line: 23,134 (Delaware: 109,400)
> Households receiving SNAP benefits: 15.8% (Delaware: 10.9%)
> Median household income: $60,910 (Delaware: $68,287)

Florida: Hamilton County
> Poverty rate: 29.9% (Florida: 14.0%)
> Number of people living below poverty line: 3,296 (Florida: 2,870,487)
> Households receiving SNAP benefits: 30.2% (Florida: 13.6%)
> Median household income: $38,569 (Florida: $55,660)
[in-text-ad-2]

Georgia: Clinch County
> Poverty rate: 40.2% (Georgia: 15.1%)
> Number of people living below poverty line: 2,649 (Georgia: 1,528,558)
> Households receiving SNAP benefits: 18.4% (Georgia: 12.8%)
> Median household income: $27,658 (Georgia: $58,700)

Hawaii: Hawaii County
> Poverty rate: 15.6% (Hawaii: 9.4%)
> Number of people living below poverty line: 30,632 (Hawaii: 130,649)
> Households receiving SNAP benefits: 19.7% (Hawaii: 10.8%)
> Median household income: $62,409 (Hawaii: $81,275)
[in-text-ad]

Idaho: Shoshone County
> Poverty rate: 19.4% (Idaho: 13.1%)
> Number of people living below poverty line: 2,398 (Idaho: 221,256)
> Households receiving SNAP benefits: 18.2% (Idaho: 9.8%)
> Median household income: $39,386 (Idaho: $55,785)

Illinois: Jackson County
> Poverty rate: 26.5% (Illinois: 12.5%)
> Number of people living below poverty line: 14,307 (Illinois: 1,557,873)
> Households receiving SNAP benefits: 19.0% (Illinois: 12.8%)
> Median household income: $37,241 (Illinois: $65,886)
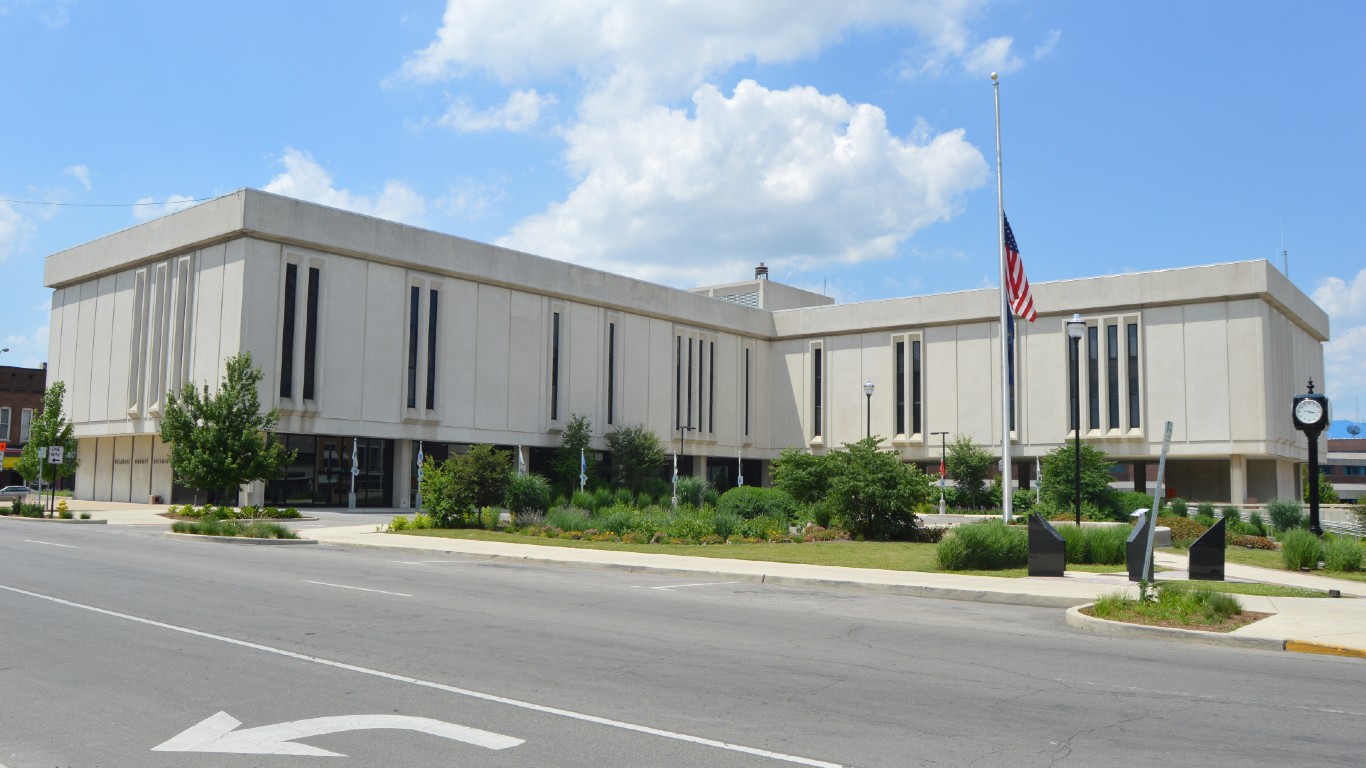
Indiana: Delaware County
> Poverty rate: 21.9% (Indiana: 13.4%)
> Number of people living below poverty line: 23,562 (Indiana: 867,996)
> Households receiving SNAP benefits: 14.4% (Indiana: 9.8%)
> Median household income: $43,512 (Indiana: $56,303)
[in-text-ad-2]

Iowa: Decatur County
> Poverty rate: 18.4% (Iowa: 11.5%)
> Number of people living below poverty line: 1,331 (Iowa: 348,122)
> Households receiving SNAP benefits: 14.6% (Iowa: 10.2%)
> Median household income: $44,462 (Iowa: $60,523)
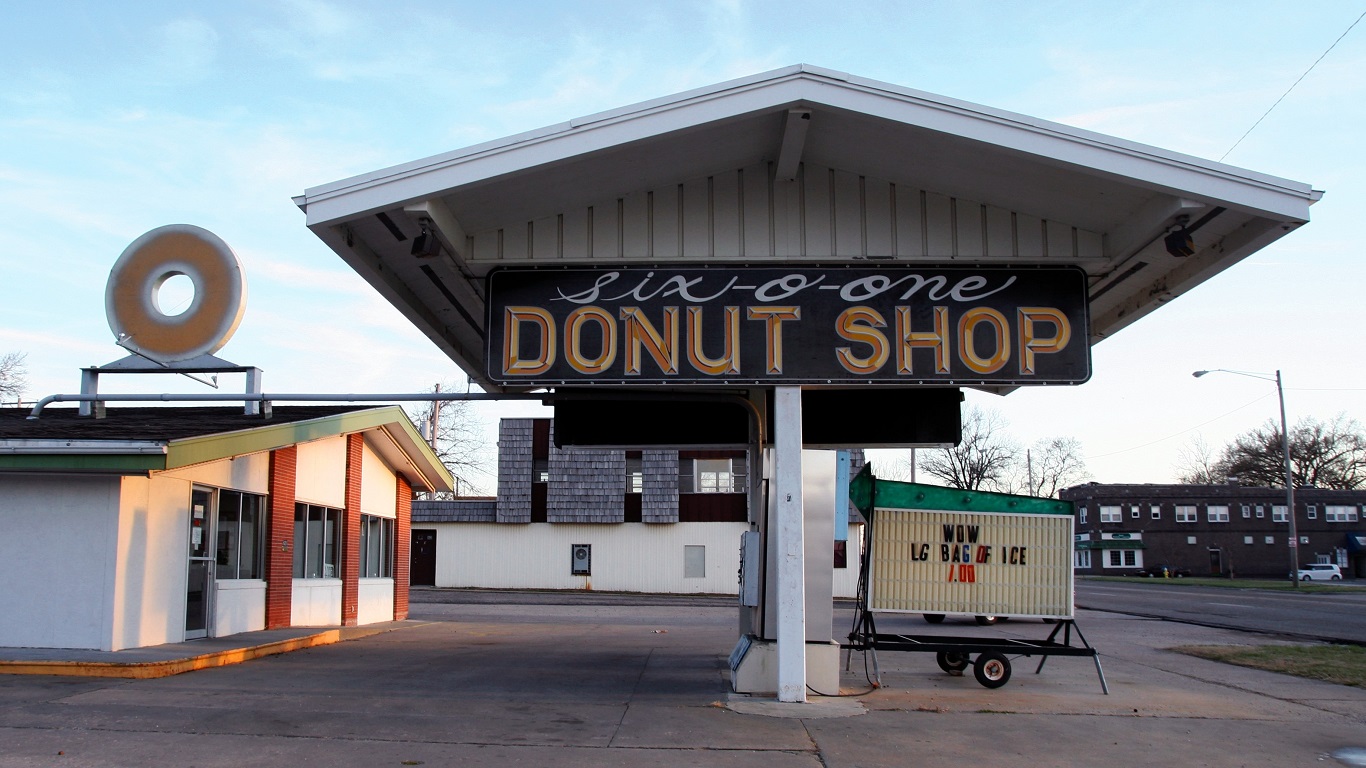
Kansas: Crawford County
> Poverty rate: 20.3% (Kansas: 12.0%)
> Number of people living below poverty line: 7,513 (Kansas: 337,739)
> Households receiving SNAP benefits: 11.8% (Kansas: 7.5%)
> Median household income: $41,004 (Kansas: $59,597)
[in-text-ad]
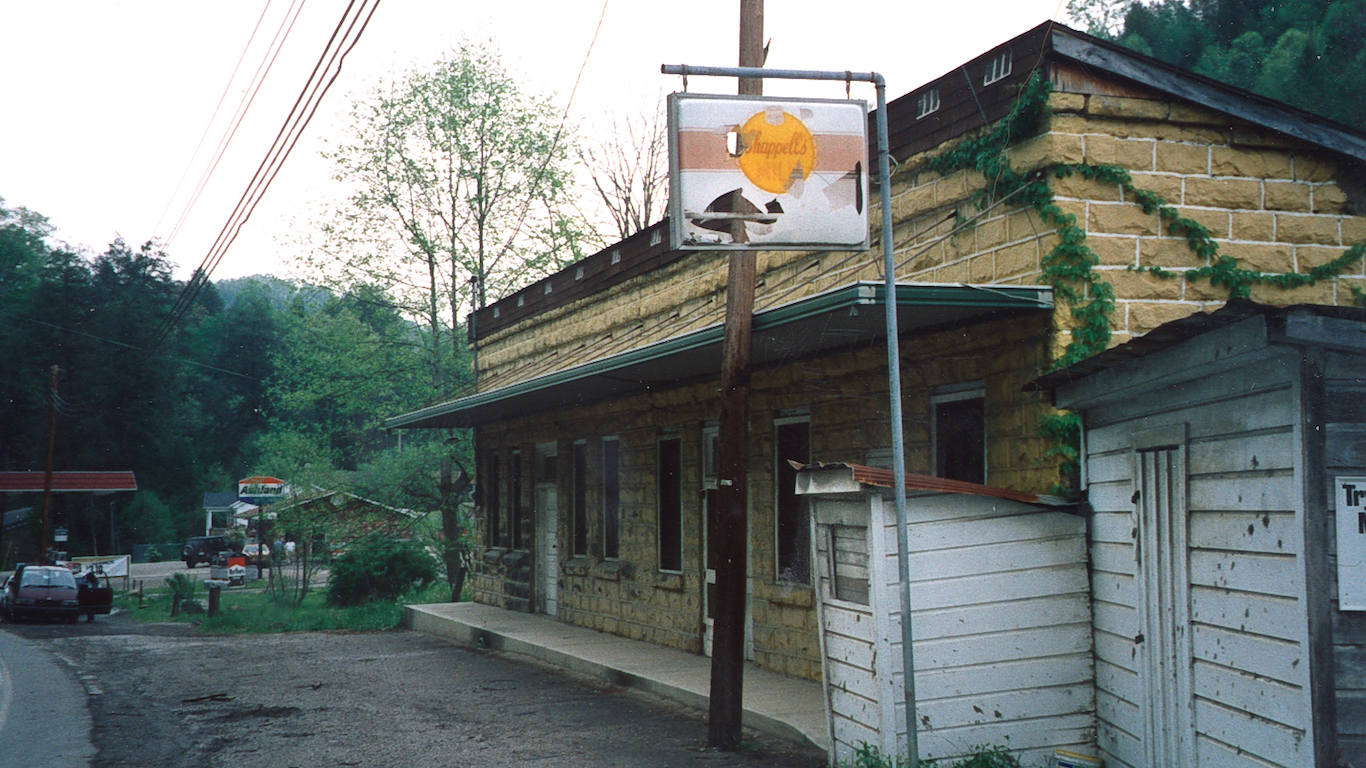
Kentucky: Leslie County
> Poverty rate: 38.0% (Kentucky: 17.3%)
> Number of people living below poverty line: 3,680 (Kentucky: 747,010)
> Households receiving SNAP benefits: 25.6% (Kentucky: 14.0%)
> Median household income: $31,627 (Kentucky: $50,589)
Louisiana: East Carroll Parish
> Poverty rate: 44.6% (Louisiana: 19.2%)
> Number of people living below poverty line: 1,972 (Louisiana: 871,467)
> Households receiving SNAP benefits: 30.5% (Louisiana: 15.4%)
> Median household income: $22,346 (Louisiana: $49,469)
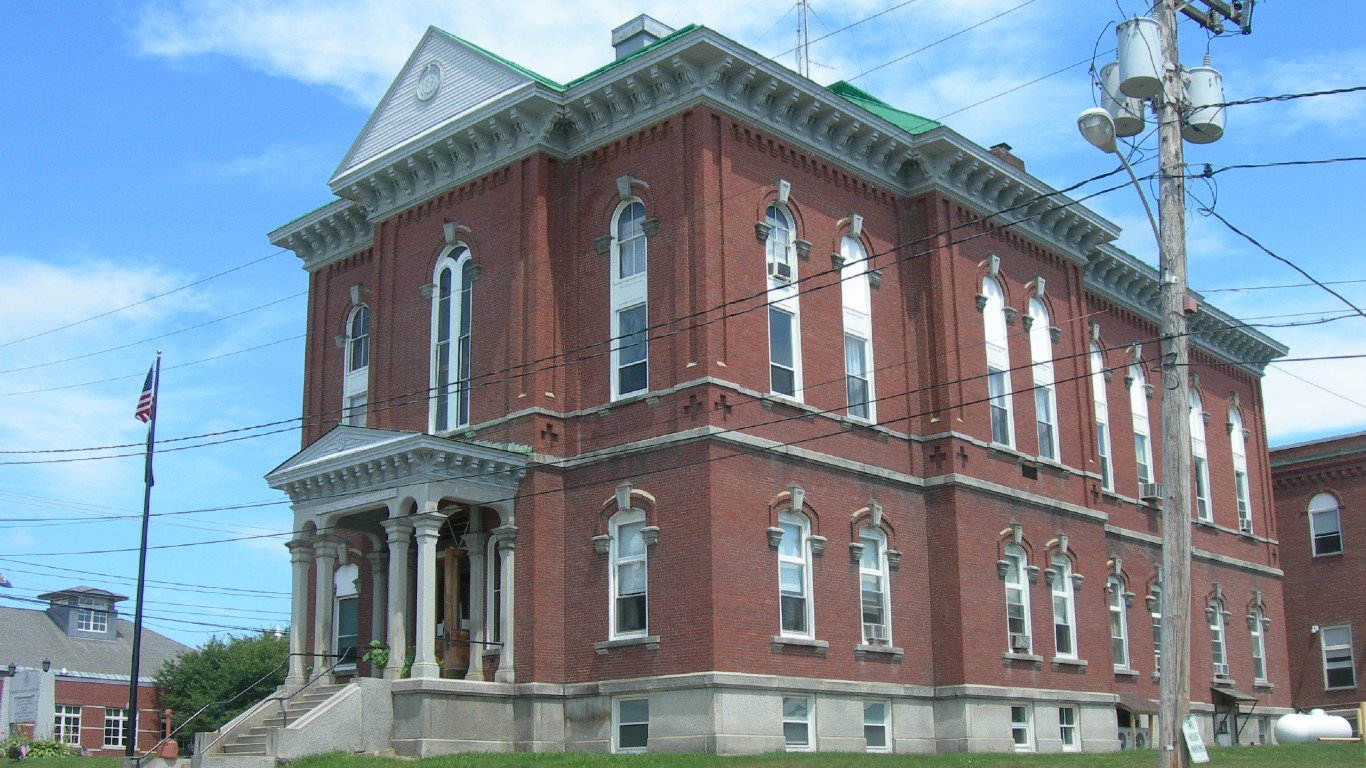
Maine: Somerset County
> Poverty rate: 20.4% (Maine: 11.8%)
> Number of people living below poverty line: 10,114 (Maine: 153,131)
> Households receiving SNAP benefits: 22.8% (Maine: 13.5%)
> Median household income: $44,256 (Maine: $57,918)
[in-text-ad-2]
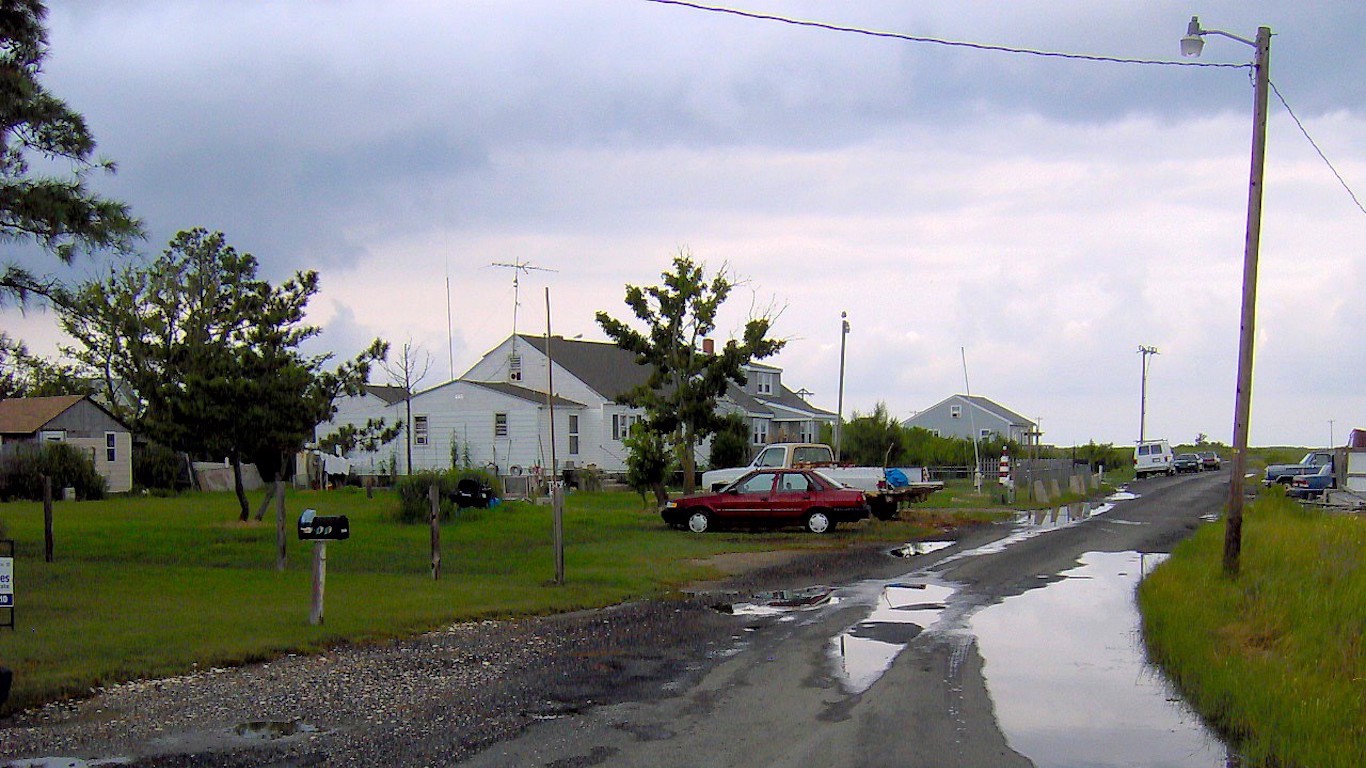
Maryland: Somerset County
> Poverty rate: 21.7% (Maryland: 9.2%)
> Number of people living below poverty line: 4,244 (Maryland: 539,991)
> Households receiving SNAP benefits: 24.4% (Maryland: 10.2%)
> Median household income: $37,803 (Maryland: $84,805)

Massachusetts: Suffolk County
> Poverty rate: 18.2% (Massachusetts: 10.3%)
> Number of people living below poverty line: 136,934 (Massachusetts: 680,962)
> Households receiving SNAP benefits: 17.2% (Massachusetts: 11.7%)
> Median household income: $69,669 (Massachusetts: $81,215)
[in-text-ad]
Michigan: Clare County
> Poverty rate: 22.7% (Michigan: 14.4%)
> Number of people living below poverty line: 6,872 (Michigan: 1,398,527)
> Households receiving SNAP benefits: 18.8% (Michigan: 13.3%)
> Median household income: $39,565 (Michigan: $57,144)
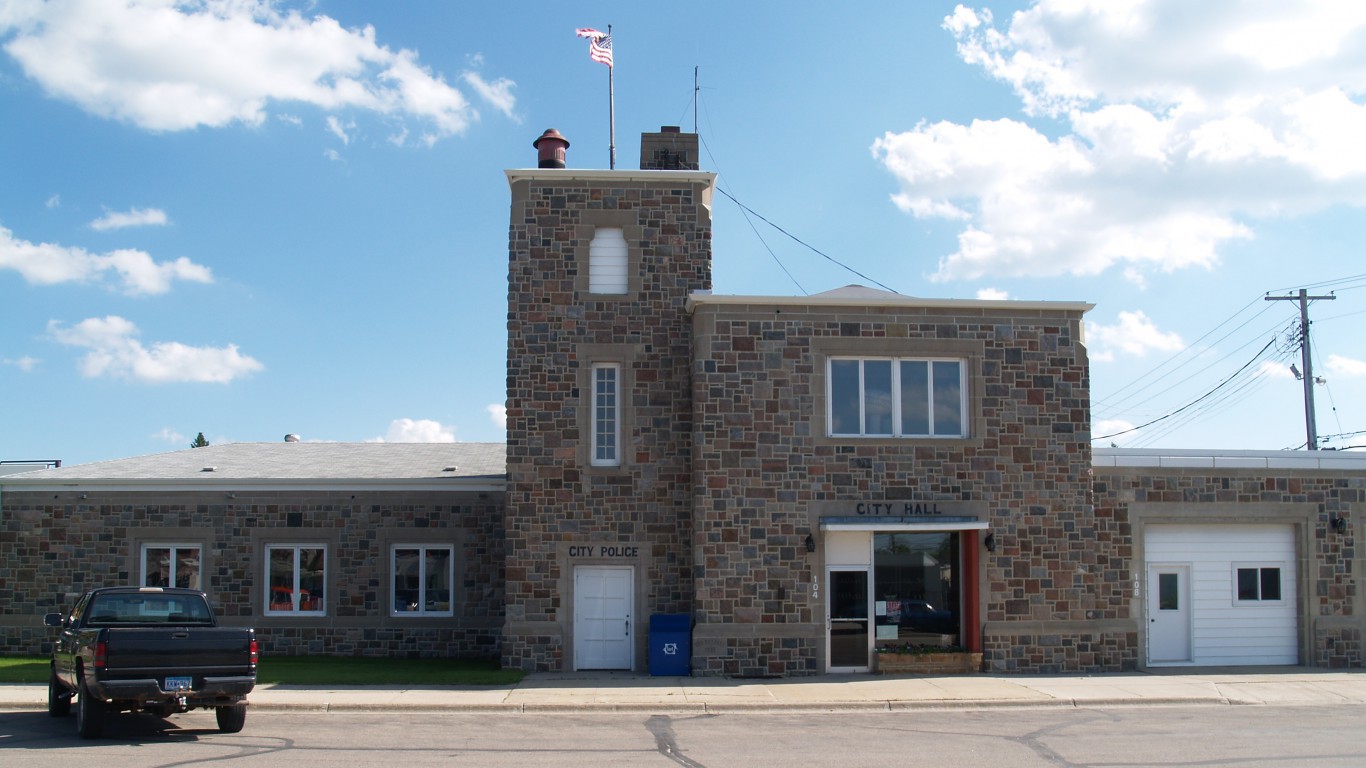
Minnesota: Mahnomen County
> Poverty rate: 23.3% (Minnesota: 9.7%)
> Number of people living below poverty line: 1,254 (Minnesota: 526,065)
> Households receiving SNAP benefits: 22.6% (Minnesota: 7.9%)
> Median household income: $44,688 (Minnesota: $71,306)
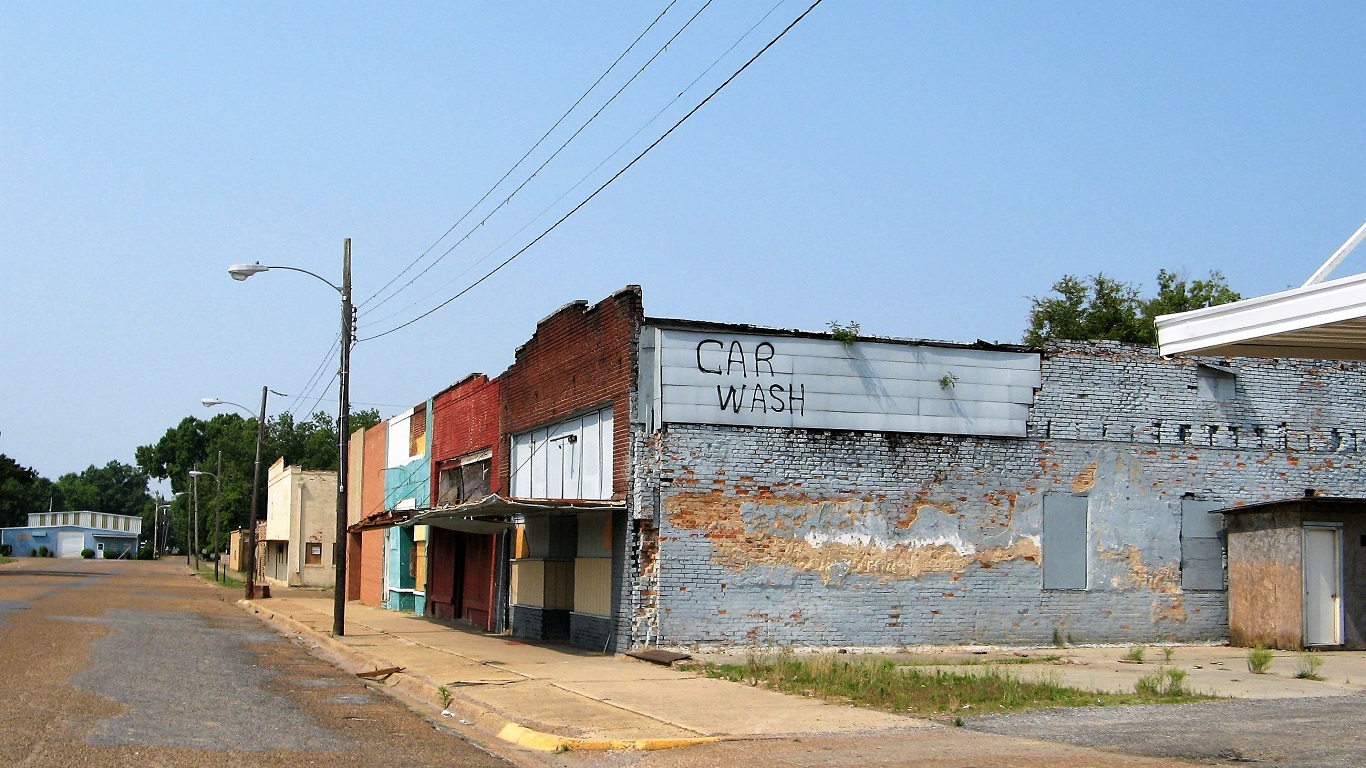
Mississippi: Holmes County
> Poverty rate: 42.4% (Mississippi: 20.3%)
> Number of people living below poverty line: 7,202 (Mississippi: 585,786)
> Households receiving SNAP benefits: 26.9% (Mississippi: 15.4%)
> Median household income: $21,504 (Mississippi: $45,081)
[in-text-ad-2]
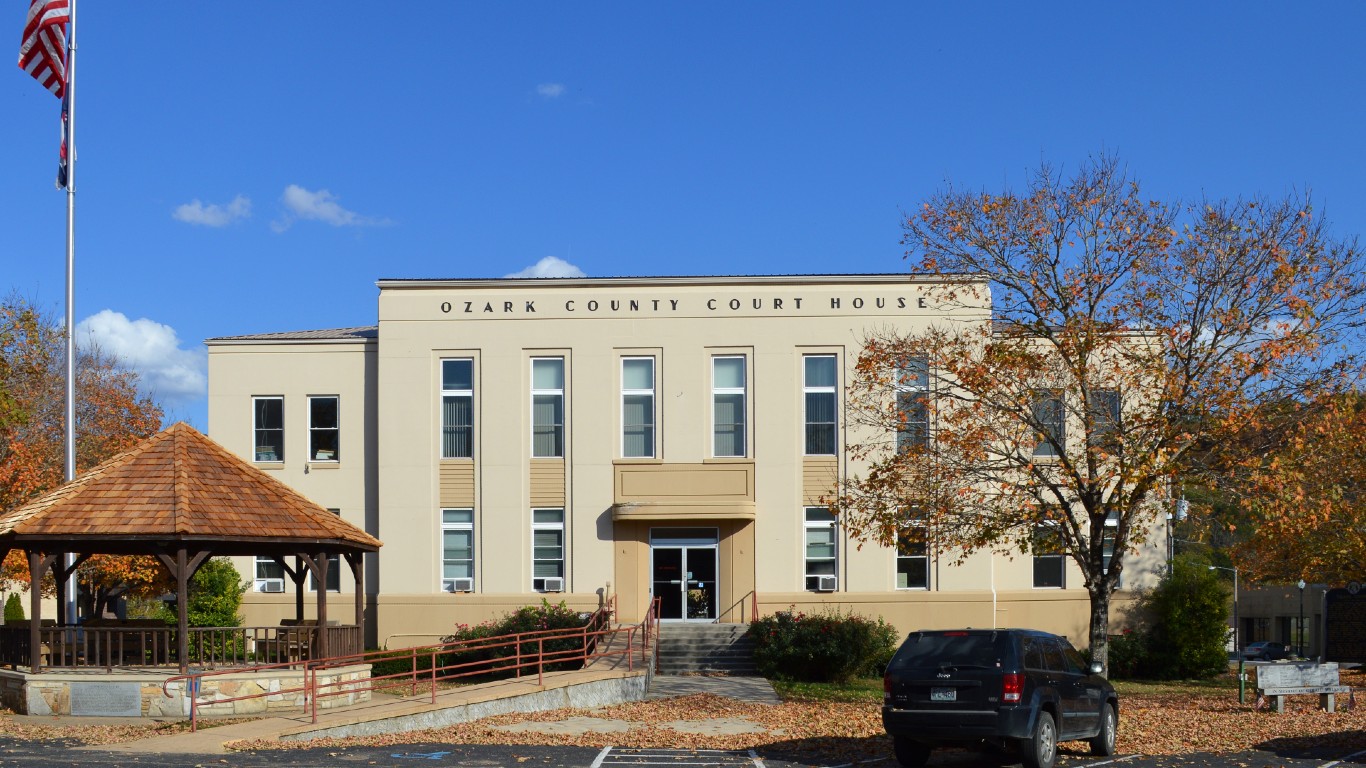
Missouri: Ozark County
> Poverty rate: 29.6% (Missouri: 13.7%)
> Number of people living below poverty line: 2,686 (Missouri: 810,045)
> Households receiving SNAP benefits: 18.3% (Missouri: 11.1%)
> Median household income: $31,947 (Missouri: $55,461)
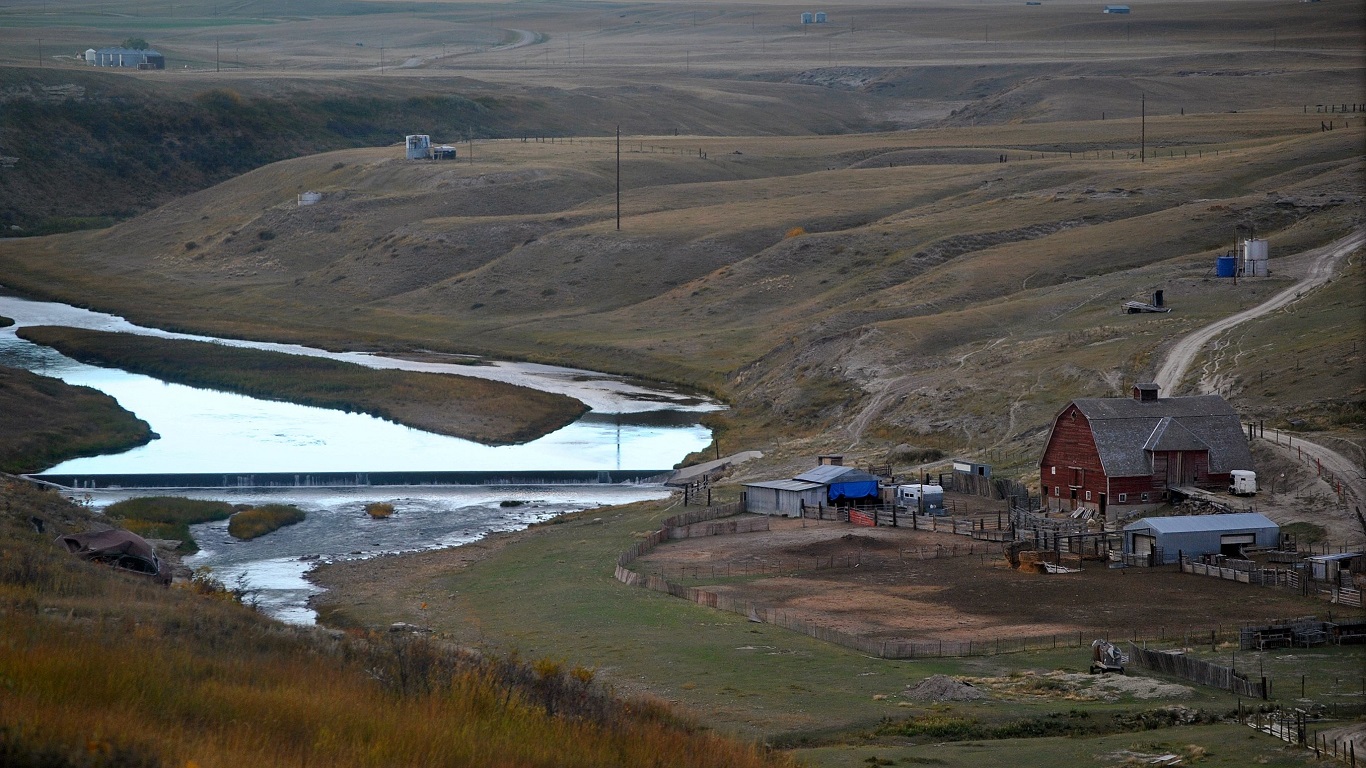
Montana: Glacier County
> Poverty rate: 31.0% (Montana: 13.1%)
> Number of people living below poverty line: 4,159 (Montana: 134,605)
> Households receiving SNAP benefits: 20.9% (Montana: 9.2%)
> Median household income: $36,045 (Montana: $54,970)
[in-text-ad]
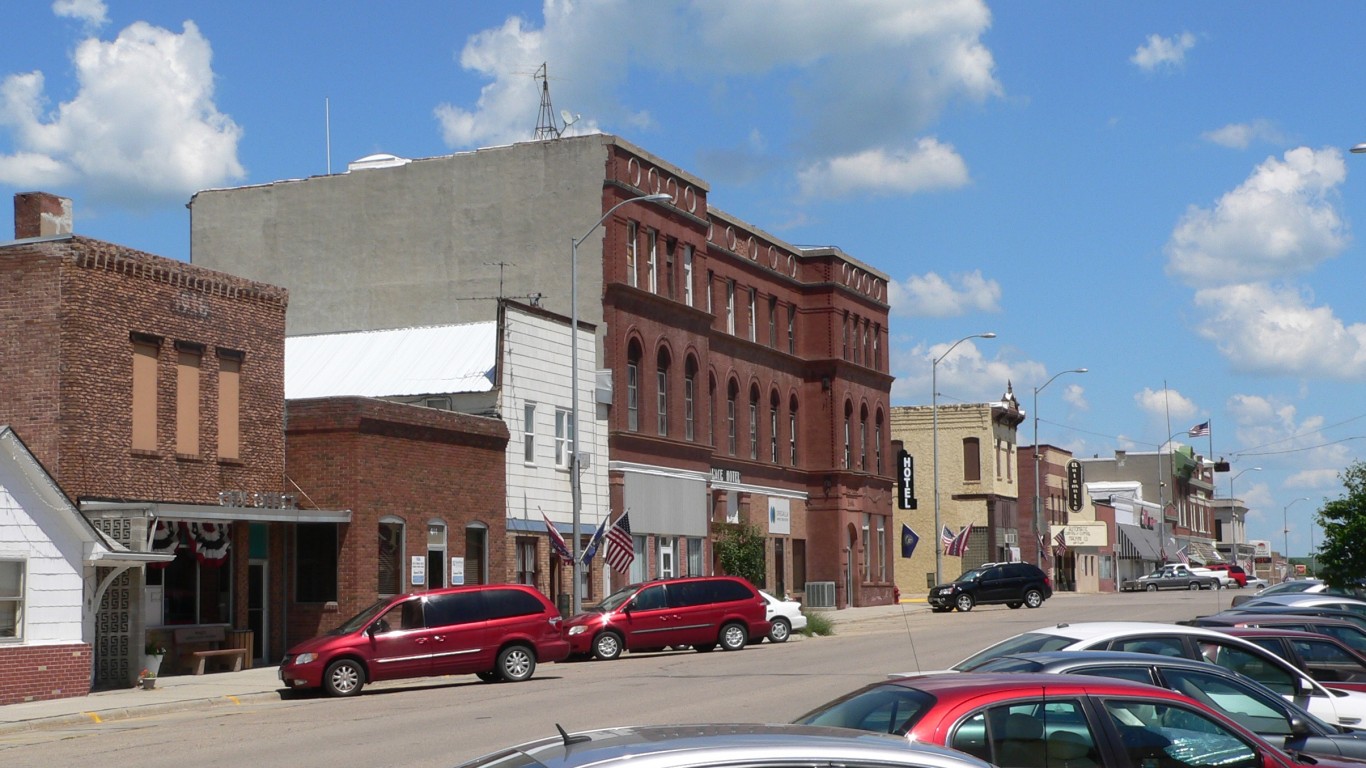
Nebraska: Thurston County
> Poverty rate: 25.5% (Nebraska: 11.1%)
> Number of people living below poverty line: 1,813 (Nebraska: 206,579)
> Households receiving SNAP benefits: 21.1% (Nebraska: 8.3%)
> Median household income: $51,034 (Nebraska: $61,439)
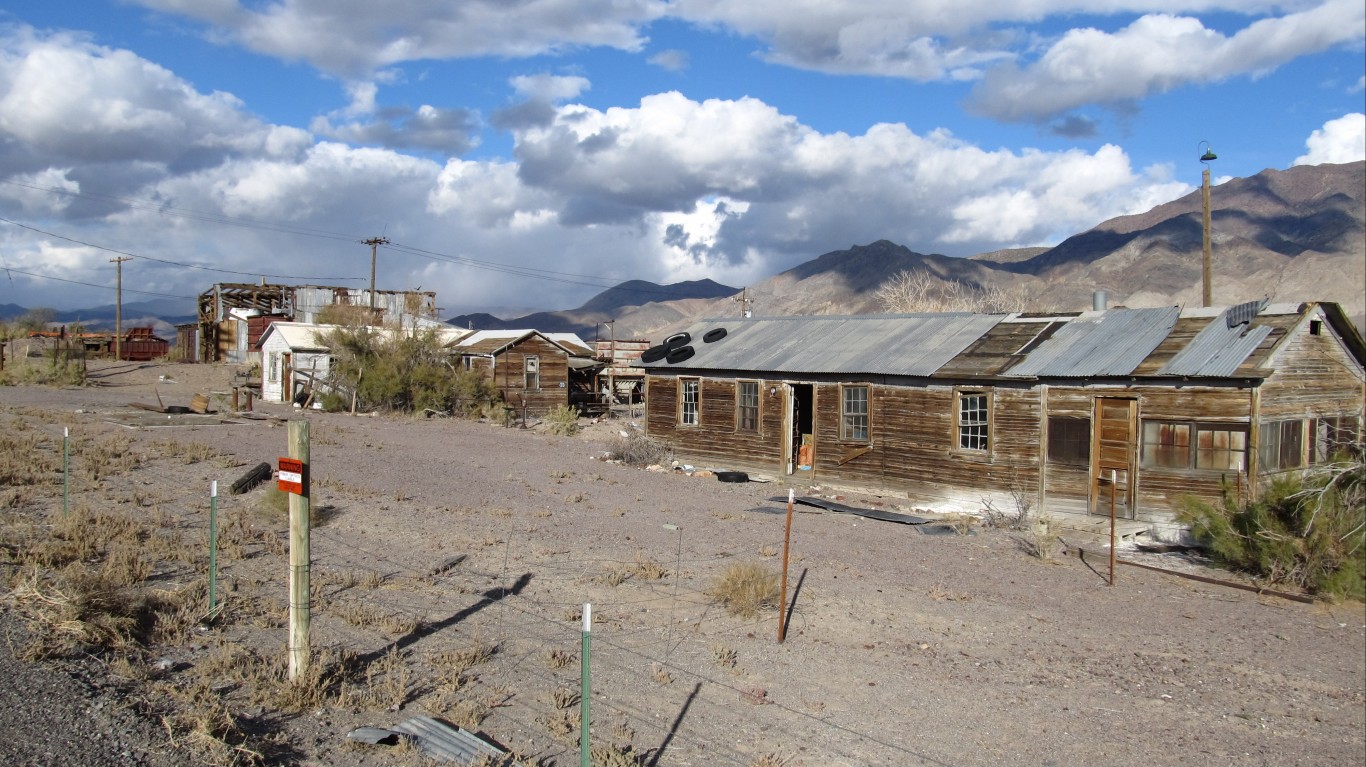
Nevada: Mineral County
> Poverty rate: 19.8% (Nevada: 13.1%)
> Number of people living below poverty line: 871 (Nevada: 384,690)
> Households receiving SNAP benefits: 14.6% (Nevada: 11.8%)
> Median household income: $35,806 (Nevada: $60,365)

New Hampshire: Coos County
> Poverty rate: 12.5% (New Hampshire: 7.6%)
> Number of people living below poverty line: 3,675 (New Hampshire: 98,682)
> Households receiving SNAP benefits: 13.2% (New Hampshire: 6.9%)
> Median household income: $47,117 (New Hampshire: $76,768)
[in-text-ad-2]

New Jersey: Cumberland County
> Poverty rate: 16.5% (New Jersey: 10.0%)
> Number of people living below poverty line: 23,051 (New Jersey: 869,081)
> Households receiving SNAP benefits: 16.5% (New Jersey: 8.7%)
> Median household income: $54,149 (New Jersey: $82,545)

New Mexico: McKinley County
> Poverty rate: 34.8% (New Mexico: 19.1%)
> Number of people living below poverty line: 24,982 (New Mexico: 392,065)
> Households receiving SNAP benefits: 26.2% (New Mexico: 17.2%)
> Median household income: $33,834 (New Mexico: $49,754)
[in-text-ad]
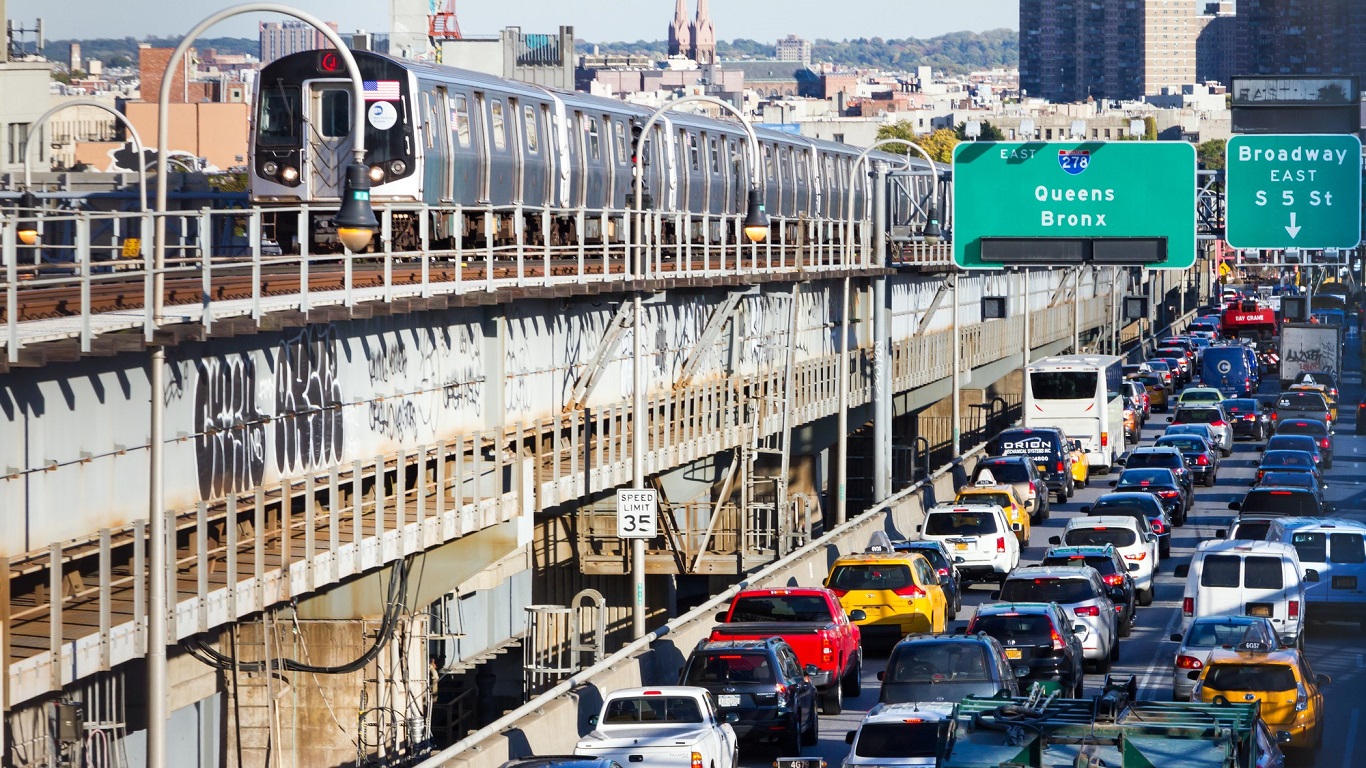
New York: Bronx County
> Poverty rate: 28.0% (New York: 14.1%)
> Number of people living below poverty line: 392,172 (New York: 2,681,277)
> Households receiving SNAP benefits: 35.7% (New York: 14.7%)
> Median household income: $40,088 (New York: $68,486)
North Carolina: Robeson County
> Poverty rate: 27.7% (North Carolina: 14.7%)
> Number of people living below poverty line: 35,706 (North Carolina: 1,467,591)
> Households receiving SNAP benefits: 28.4% (North Carolina: 12.6%)
> Median household income: $34,976 (North Carolina: $54,602)
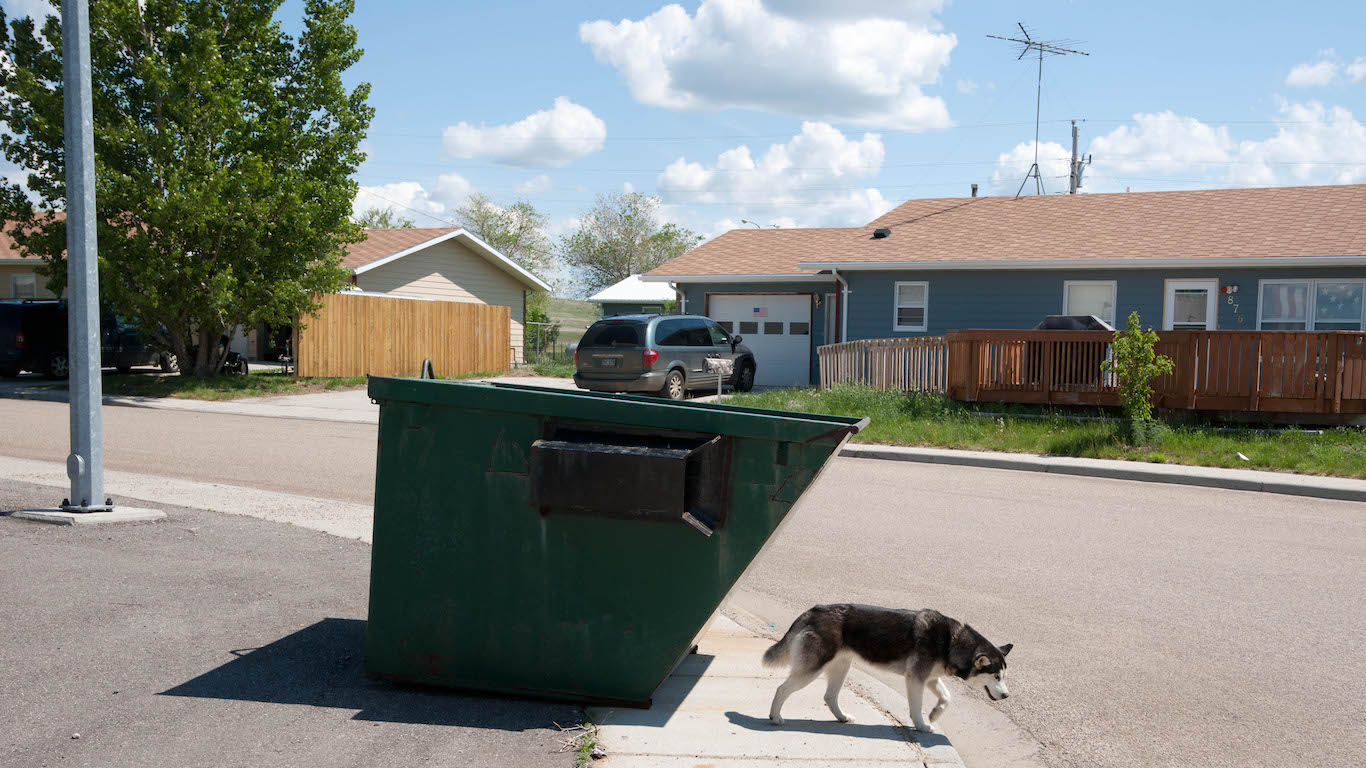
North Dakota: Sioux County
> Poverty rate: 38.2% (North Dakota: 10.7%)
> Number of people living below poverty line: 1,641 (North Dakota: 78,198)
> Households receiving SNAP benefits: 23.7% (North Dakota: 6.7%)
> Median household income: $38,939 (North Dakota: $64,894)
[in-text-ad-2]
Ohio: Scioto County
> Poverty rate: 22.6% (Ohio: 14.0%)
> Number of people living below poverty line: 16,330 (Ohio: 1,588,343)
> Households receiving SNAP benefits: 28.4% (Ohio: 13.1%)
> Median household income: $41,330 (Ohio: $56,602)

Oklahoma: Adair County
> Poverty rate: 27.8% (Oklahoma: 15.7%)
> Number of people living below poverty line: 6,124 (Oklahoma: 598,373)
> Households receiving SNAP benefits: 22.3% (Oklahoma: 12.8%)
> Median household income: $34,695 (Oklahoma: $52,919)
[in-text-ad]

Oregon: Malheur County
> Poverty rate: 21.8% (Oregon: 13.2%)
> Number of people living below poverty line: 5,808 (Oregon: 533,527)
> Households receiving SNAP benefits: 27.4% (Oregon: 15.8%)
> Median household income: $43,313 (Oregon: $62,818)
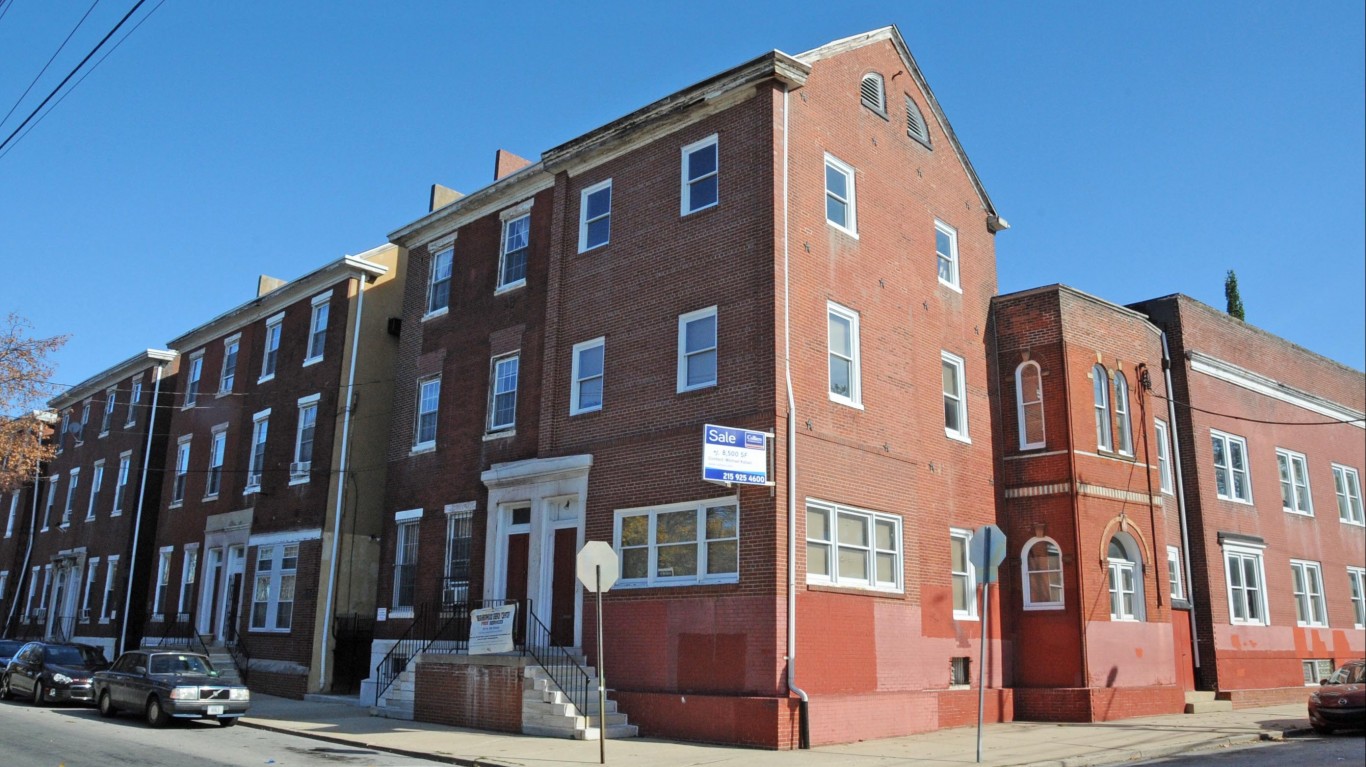
Pennsylvania: Philadelphia County
> Poverty rate: 24.3% (Pennsylvania: 12.4%)
> Number of people living below poverty line: 373,727 (Pennsylvania: 1,539,183)
> Households receiving SNAP benefits: 25.8% (Pennsylvania: 13.3%)
> Median household income: $45,927 (Pennsylvania: $61,744)

Rhode Island: Providence County
> Poverty rate: 15.2% (Rhode Island: 12.4%)
> Number of people living below poverty line: 92,879 (Rhode Island: 125,826)
> Households receiving SNAP benefits: 19.4% (Rhode Island: 15.3%)
> Median household income: $58,974 (Rhode Island: $67,167)
[in-text-ad-2]
South Carolina: Dillon County
> Poverty rate: 32.6% (South Carolina: 15.2%)
> Number of people living below poverty line: 9,852 (South Carolina: 741,650)
> Households receiving SNAP benefits: 24.3% (South Carolina: 12.3%)
> Median household income: $30,812 (South Carolina: $53,199)
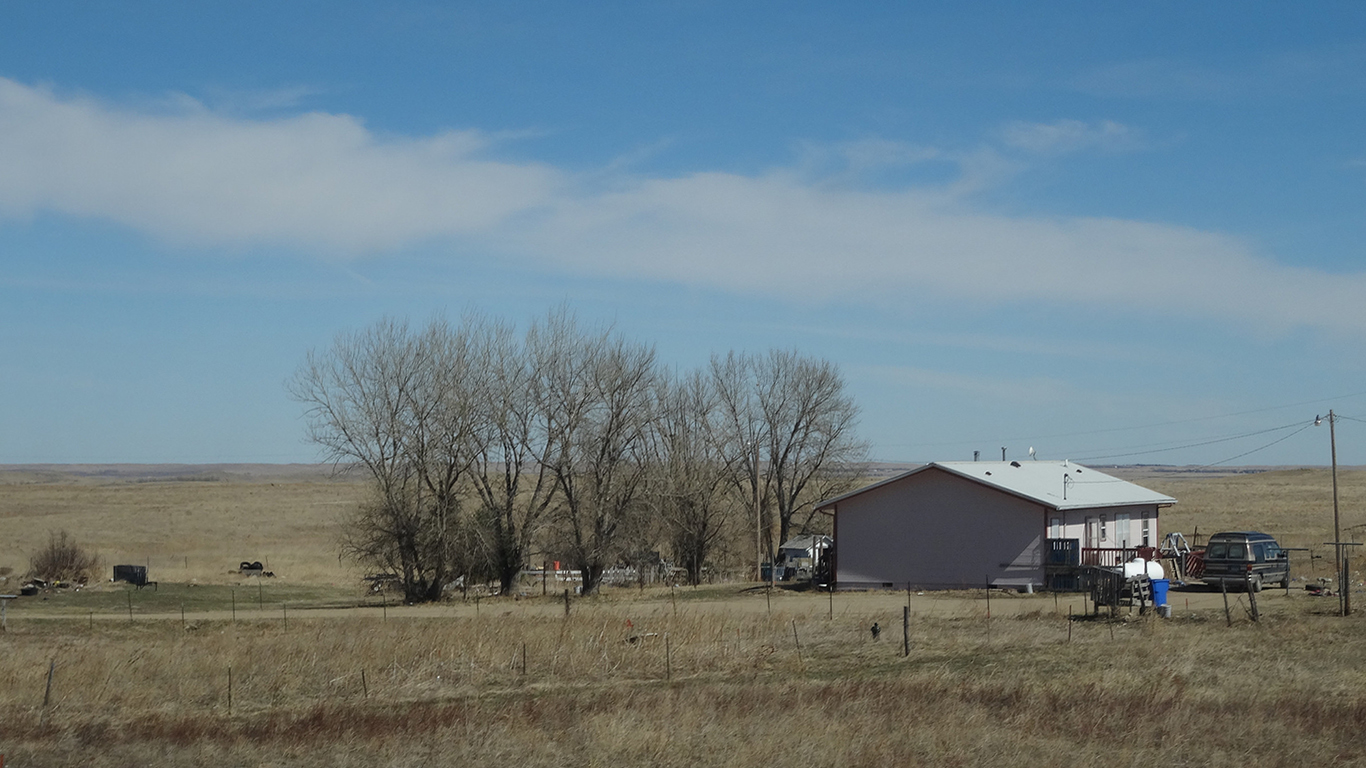
South Dakota: Todd County
> Poverty rate: 55.5% (South Dakota: 13.1%)
> Number of people living below poverty line: 5,584 (South Dakota: 110,553)
> Households receiving SNAP benefits: 38.7% (South Dakota: 9.2%)
> Median household income: $24,331 (South Dakota: $58,275)
[in-text-ad]

Tennessee: Hancock County
> Poverty rate: 28.6% (Tennessee: 15.2%)
> Number of people living below poverty line: 1,814 (Tennessee: 996,930)
> Households receiving SNAP benefits: 30.2% (Tennessee: 13.6%)
> Median household income: $30,136 (Tennessee: $53,320)
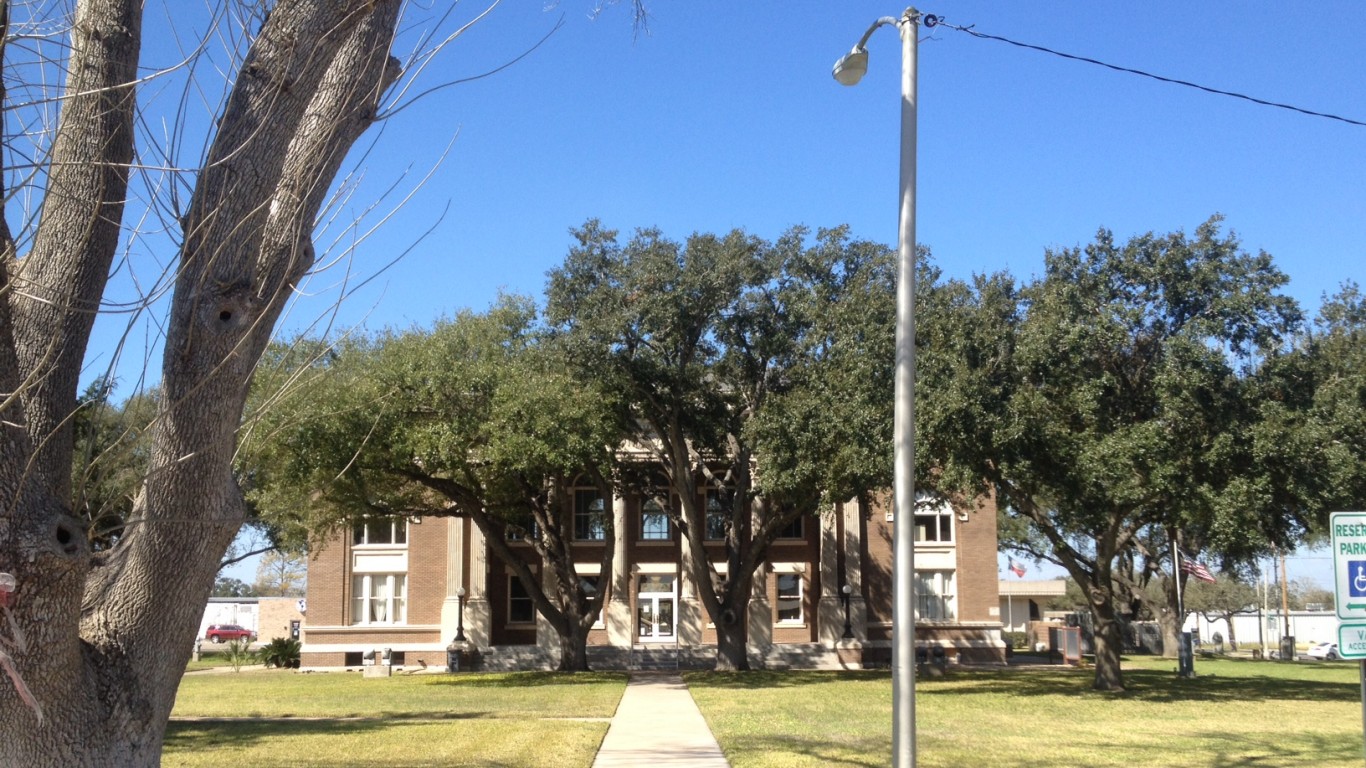
Texas: Brooks County
> Poverty rate: 41.4% (Texas: 14.7%)
> Number of people living below poverty line: 2,724 (Texas: 4,072,194)
> Households receiving SNAP benefits: 35.6% (Texas: 11.8%)
> Median household income: $28,333 (Texas: $61,874)

Utah: San Juan County
> Poverty rate: 25.0% (Utah: 9.8%)
> Number of people living below poverty line: 3,716 (Utah: 298,537)
> Households receiving SNAP benefits: 14.8% (Utah: 6.7%)
> Median household income: $45,394 (Utah: $71,621)
[in-text-ad-2]

Vermont: Windham County
> Poverty rate: 13.7% (Vermont: 10.9%)
> Number of people living below poverty line: 5,626 (Vermont: 65,652)
> Households receiving SNAP benefits: 16.4% (Vermont: 11.3%)
> Median household income: $51,985 (Vermont: $61,973)

Virginia: Buchanan County
> Poverty rate: 28.4% (Virginia: 10.6%)
> Number of people living below poverty line: 5,905 (Virginia: 865,691)
> Households receiving SNAP benefits: 19.7% (Virginia: 8.2%)
> Median household income: $31,956 (Virginia: $74,222)
[in-text-ad]
Washington: Adams County
> Poverty rate: 25.6% (Washington: 10.8%)
> Number of people living below poverty line: 4,951 (Washington: 785,244)
> Households receiving SNAP benefits: 22.4% (Washington: 11.9%)
> Median household income: $48,294 (Washington: $73,775)

West Virginia: McDowell County
> Poverty rate: 33.2% (West Virginia: 17.6%)
> Number of people living below poverty line: 5,704 (West Virginia: 310,044)
> Households receiving SNAP benefits: 34.6% (West Virginia: 16.8%)
> Median household income: $27,682 (West Virginia: $46,711)

Wisconsin: Menominee County
> Poverty rate: 35.3% (Wisconsin: 11.3%)
> Number of people living below poverty line: 1,593 (Wisconsin: 639,160)
> Households receiving SNAP benefits: 25.1% (Wisconsin: 10.8%)
> Median household income: $40,921 (Wisconsin: $61,747)
[in-text-ad-2]

Wyoming: Niobrara County
> Poverty rate: 20.1% (Wyoming: 11.0%)
> Number of people living below poverty line: 431 (Wyoming: 62,257)
> Households receiving SNAP benefits: 8.1% (Wyoming: 5.4%)
> Median household income: $39,150 (Wyoming: $64,049)
Methodology
To determine the county with the highest poverty rate in every state, 24/7 Wall St. reviewed five-year estimates of the percentage of people that live below the poverty line from the U.S. Census Bureau’s 2019 American Community Survey.
Of the 3,220 counties or county equivalents, 3,141 had boundaries that fell within one of the 50 states, while the rest were in the District of Columbia or Puerto Rico.
Counties were excluded if poverty rates were not available in the 2019 ACS, if the population for which the poverty status had been determined was less than 1,000, if 25% or more of a county’s population were enrolled in undergraduate, professional, or graduate school during the same period, or if the sampling error associated with a county’s data was deemed too high.
The sampling error was defined as too high if the coefficient of variation — a statistical assessment of how reliable an estimate is — for a county’s poverty rate was above 15% and greater than two standard deviations above the mean CV for all counties’ poverty rates. We similarly excluded counties that had a sampling error too high for their population for which poverty status had been determined, using the same definition.
The remaining 2,984 places were ranked within their state based on their poverty rates. Additional information on the number of people living below the poverty line, median household income, and the share of households receiving SNAP benefits are also five-year estimates from the 2019 ACS.
The Average American Is Losing Momentum on Their Savings Every Day (Sponsor)
If you’re like many Americans and keep your money ‘safe’ in a checking or savings account, think again. The average yield on a savings account is a paltry .4%* today. Checking accounts are even worse.
But there is good news. To win qualified customers, some accounts are paying nearly 10x the national average! That’s an incredible way to keep your money safe and earn more at the same time. Our top pick for high yield savings accounts includes other benefits as well. You can earn up to 3.80% with a Checking & Savings Account today Sign up and get up to $300 with direct deposit. No account fees. FDIC Insured.
Click here to see how much more you could be earning on your savings today. It takes just a few minutes to open an account to make your money work for you.
Thank you for reading! Have some feedback for us?
Contact the 24/7 Wall St. editorial team.