The share of Americans under the age of 65 without health insurance fell every year between 2010, when the Affordable Care Act was signed into law, and 2016, when President Barack Obama left office. Though the uninsured rate among Americans younger than 65 has inched up over the years since, it remains well below the 17%+ figures in the years leading up to the ACA.
Without a universal health care program, employer- based health insurance covers most Americans under age 65. Under this system, 10.3% of Americans younger than 65, approximately 25 million people, lacked health insurance in 2019 — and that was before the COVID-19 pandemic put over 22 million Americans out of work.
While most of those jobs have since been restored, the official 2020 uninsured rate for Americans under 65 will likely be higher than the 2019 rate, which, in some parts of the country, was already well above the national uninsured rate levels from before the passing of the ACA.
Using data from the U.S. Census Bureau, 24/7 Wall St. identified the 50 counties and county equivalents with the worst health insurance coverage. Counties are ranked based on the share of residents under age 65 — the age of eligibility for Medicare — who are uninsured.
Half of the counties and county equivalents on this list are in Southern states — including 19 in Texas alone.
Click here to see the counties with the worst health insurance coverage.
Click here to see our methodology.

50. Echols County, Georgia
> Adults under 65, no health insurance: 27.5%
> Adults under 65, Medicare coverage (or multiple types): 4.6% — 934th highest of 2,946 counties
> Adults under 65, Medicaid coverage (or multiple types): 16.2% — 660th lowest of 2,946 counties
> Adults under 65, VA coverage (or multiple types): 0.7% — 372nd lowest of 2,946 counties
> Adults under 65, employer-based insurance (or multiple types): 56.0% — 1,471st highest of 2,946 counties
> Adults under 65, direct-purchase insurance (or multiple types): 5.3% — 84th lowest of 2,946 counties
> Adults under 65, Tricare/military insurance (or many types): 2.9% — 400th highest of 2,946 counties
[in-text-ad]

49. Northwest Arctic Borough, Alaska
> Adults under 65, no health insurance: 27.7%
> Adults under 65, Medicare coverage (or multiple types): 1.3% — 78th lowest of 2,946 counties
> Adults under 65, Medicaid coverage (or multiple types): 43.1% — 64th highest of 2,946 counties
> Adults under 65, VA coverage (or multiple types): 0.6% — 257th lowest of 2,946 counties
> Adults under 65, employer-based insurance (or multiple types): 30.5% — 40th lowest of 2,946 counties
> Adults under 65, direct-purchase insurance (or multiple types): 1.4% — 5th lowest of 2,946 counties
> Adults under 65, Tricare/military insurance (or many types): 0.8% — 610th lowest of 2,946 counties

48. Rolette County, North Dakota
> Adults under 65, no health insurance: 27.9%
> Adults under 65, Medicare coverage (or multiple types): 3.2% — 1,137th lowest of 2,946 counties
> Adults under 65, Medicaid coverage (or multiple types): 32.4% — 406th highest of 2,946 counties
> Adults under 65, VA coverage (or multiple types): 0.4% — 101st lowest of 2,946 counties
> Adults under 65, employer-based insurance (or multiple types): 33.7% — 73rd lowest of 2,946 counties
> Adults under 65, direct-purchase insurance (or multiple types): 7.2% — 392nd lowest of 2,946 counties
> Adults under 65, Tricare/military insurance (or many types): 0.8% — 507th lowest of 2,946 counties

47. Okfuskee County, Oklahoma
> Adults under 65, no health insurance: 28.2%
> Adults under 65, Medicare coverage (or multiple types): 6.0% — 421st highest of 2,946 counties
> Adults under 65, Medicaid coverage (or multiple types): 29.6% — 611th highest of 2,946 counties
> Adults under 65, VA coverage (or multiple types): 1.4% — 1,373rd highest of 2,946 counties
> Adults under 65, employer-based insurance (or multiple types): 37.3% — 146th lowest of 2,946 counties
> Adults under 65, direct-purchase insurance (or multiple types): 5.0% — 65th lowest of 2,946 counties
> Adults under 65, Tricare/military insurance (or many types): 0.9% — 757th lowest of 2,946 counties
[in-text-ad-2]

46. Menominee County, Wisconsin
> Adults under 65, no health insurance: 28.4%
> Adults under 65, Medicare coverage (or multiple types): 3.4% — 1,284th lowest of 2,946 counties
> Adults under 65, Medicaid coverage (or multiple types): 34.8% — 285th highest of 2,946 counties
> Adults under 65, VA coverage (or multiple types): 1.1% — 1,059th lowest of 2,946 counties
> Adults under 65, employer-based insurance (or multiple types): 33.1% — 63rd lowest of 2,946 counties
> Adults under 65, direct-purchase insurance (or multiple types): 5.2% — 76th lowest of 2,946 counties
> Adults under 65, Tricare/military insurance (or many types): 0.2% — 43rd lowest of 2,946 counties

45. Edwards County, Texas
> Adults under 65, no health insurance: 28.4%
> Adults under 65, Medicare coverage (or multiple types): 3.3% — 1,235th lowest of 2,946 counties
> Adults under 65, Medicaid coverage (or multiple types): 37.7% — 170th highest of 2,946 counties
> Adults under 65, VA coverage (or multiple types): 3.1% — 137th highest of 2,946 counties
> Adults under 65, employer-based insurance (or multiple types): 24.4% — 15th lowest of 2,946 counties
> Adults under 65, direct-purchase insurance (or multiple types): 13.5% — 508th highest of 2,946 counties
> Adults under 65, Tricare/military insurance (or many types): 3.1% — 361st highest of 2,946 counties
[in-text-ad]
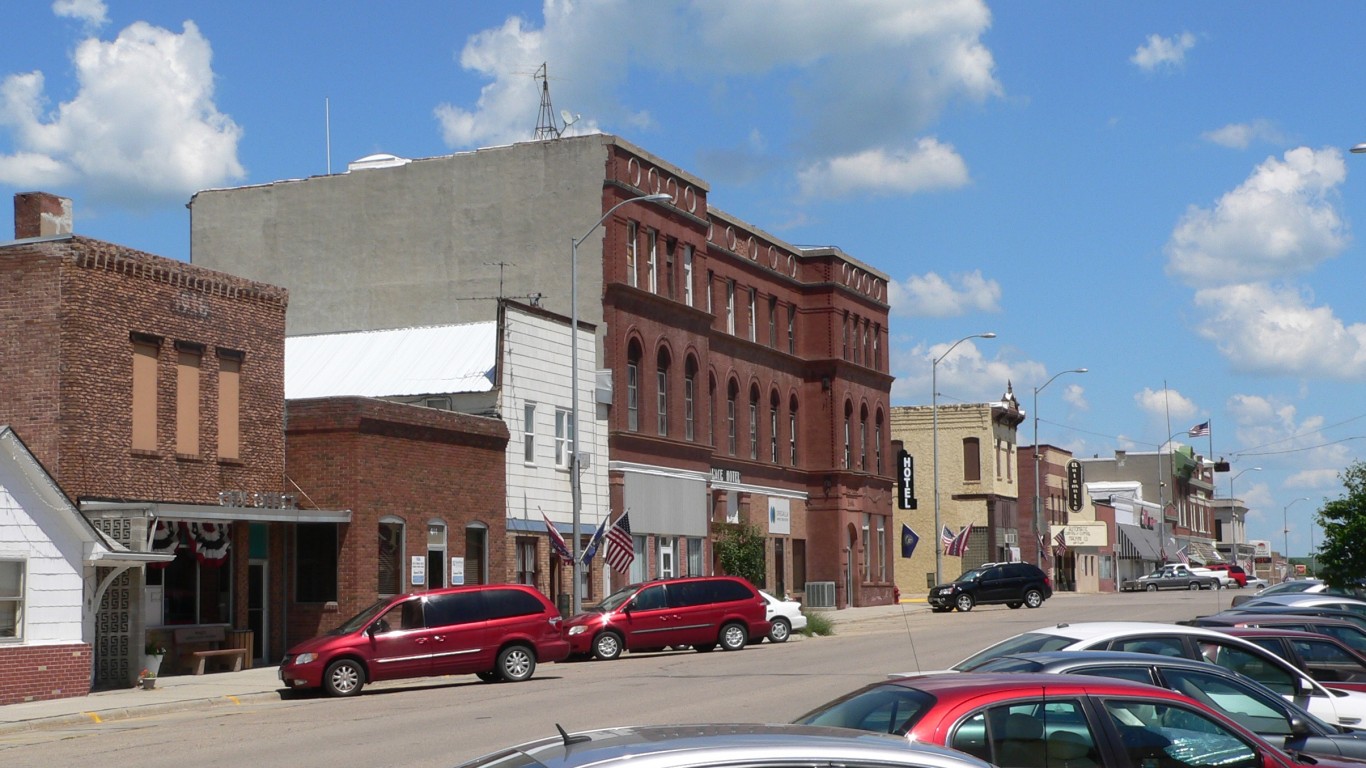
44. Thurston County, Nebraska
> Adults under 65, no health insurance: 28.5%
> Adults under 65, Medicare coverage (or multiple types): 1.9% — 273rd lowest of 2,946 counties
> Adults under 65, Medicaid coverage (or multiple types): 26.9% — 898th highest of 2,946 counties
> Adults under 65, VA coverage (or multiple types): 0.6% — 223rd lowest of 2,946 counties
> Adults under 65, employer-based insurance (or multiple types): 40.3% — 238th lowest of 2,946 counties
> Adults under 65, direct-purchase insurance (or multiple types): 5.5% — 101st lowest of 2,946 counties
> Adults under 65, Tricare/military insurance (or many types): 0.0% reported — 17th lowest of 2,946 counties
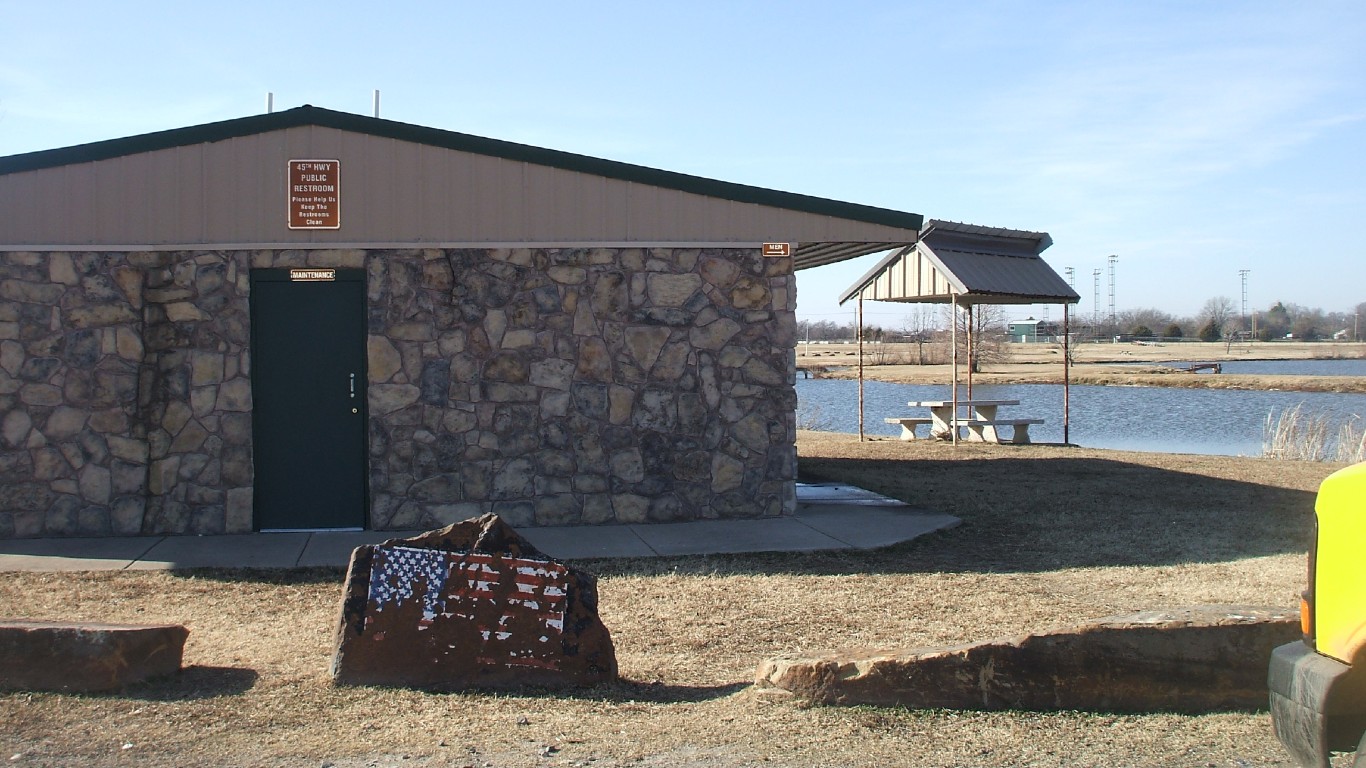
43. Coal County, Oklahoma
> Adults under 65, no health insurance: 28.6%
> Adults under 65, Medicare coverage (or multiple types): 5.2% — 699th highest of 2,946 counties
> Adults under 65, Medicaid coverage (or multiple types): 24.5% — 1,176th highest of 2,946 counties
> Adults under 65, VA coverage (or multiple types): 1.3% — 1,429th lowest of 2,946 counties
> Adults under 65, employer-based insurance (or multiple types): 39.5% — 214th lowest of 2,946 counties
> Adults under 65, direct-purchase insurance (or multiple types): 7.9% — 585th lowest of 2,946 counties
> Adults under 65, Tricare/military insurance (or many types): 1.3% — 1,233rd lowest of 2,946 counties
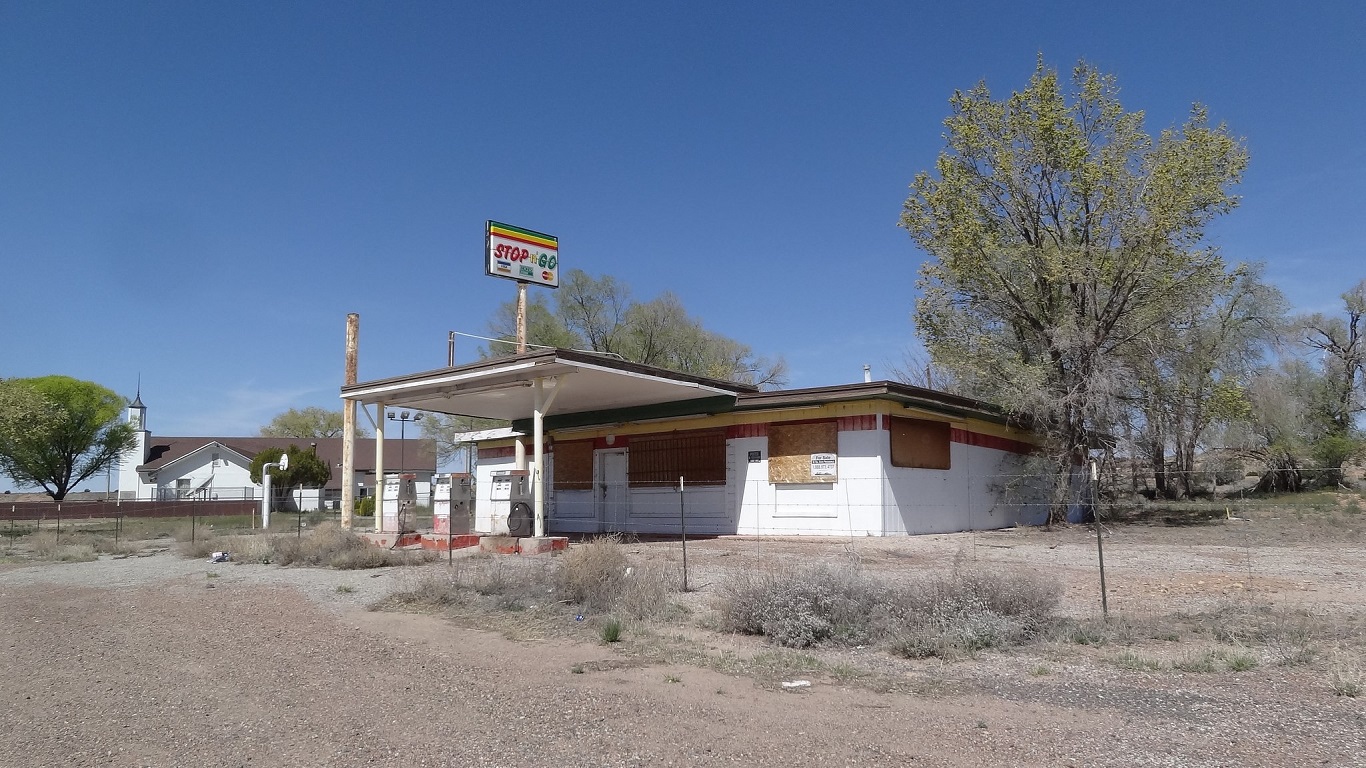
42. Apache County, Arizona
> Adults under 65, no health insurance: 28.7%
> Adults under 65, Medicare coverage (or multiple types): 3.6% — 1,432nd lowest of 2,946 counties
> Adults under 65, Medicaid coverage (or multiple types): 37.3% — 182nd highest of 2,946 counties
> Adults under 65, VA coverage (or multiple types): 0.6% — 263rd lowest of 2,946 counties
> Adults under 65, employer-based insurance (or multiple types): 31.4% — 47th lowest of 2,946 counties
> Adults under 65, direct-purchase insurance (or multiple types): 2.0% — 8th lowest of 2,946 counties
> Adults under 65, Tricare/military insurance (or many types): 0.8% — 523rd lowest of 2,946 counties
[in-text-ad-2]

41. Hendry County, Florida
> Adults under 65, no health insurance: 28.8%
> Adults under 65, Medicare coverage (or multiple types): 2.6% — 688th lowest of 2,946 counties
> Adults under 65, Medicaid coverage (or multiple types): 32.3% — 410th highest of 2,946 counties
> Adults under 65, VA coverage (or multiple types): 0.8% — 495th lowest of 2,946 counties
> Adults under 65, employer-based insurance (or multiple types): 32.5% — 60th lowest of 2,946 counties
> Adults under 65, direct-purchase insurance (or multiple types): 8.8% — 952nd lowest of 2,946 counties
> Adults under 65, Tricare/military insurance (or many types): 0.7% — 436th lowest of 2,946 counties

40. Prince of Wales-Hyder Census Area, Alaska
> Adults under 65, no health insurance: 29.0%
> Adults under 65, Medicare coverage (or multiple types): 3.3% — 1,219th lowest of 2,946 counties
> Adults under 65, Medicaid coverage (or multiple types): 28.9% — 679th highest of 2,946 counties
> Adults under 65, VA coverage (or multiple types): 1.5% — 1,137th highest of 2,946 counties
> Adults under 65, employer-based insurance (or multiple types): 36.9% — 136th lowest of 2,946 counties
> Adults under 65, direct-purchase insurance (or multiple types): 5.1% — 70th lowest of 2,946 counties
> Adults under 65, Tricare/military insurance (or many types): 0.5% — 217th lowest of 2,946 counties
[in-text-ad]

39. Daviess County, Indiana
> Adults under 65, no health insurance: 29.5%
> Adults under 65, Medicare coverage (or multiple types): 3.2% — 1,163rd lowest of 2,946 counties
> Adults under 65, Medicaid coverage (or multiple types): 17.1% — 769th lowest of 2,946 counties
> Adults under 65, VA coverage (or multiple types): 0.6% — 259th lowest of 2,946 counties
> Adults under 65, employer-based insurance (or multiple types): 44.4% — 431st lowest of 2,946 counties
> Adults under 65, direct-purchase insurance (or multiple types): 10.6% — 1,198th highest of 2,946 counties
> Adults under 65, Tricare/military insurance (or many types): 0.6% — 353rd lowest of 2,946 counties

38. Webb County, Texas
> Adults under 65, no health insurance: 30.0%
> Adults under 65, Medicare coverage (or multiple types): 1.7% — 210th lowest of 2,946 counties
> Adults under 65, Medicaid coverage (or multiple types): 27.5% — 823rd highest of 2,946 counties
> Adults under 65, VA coverage (or multiple types): 0.6% — 212th lowest of 2,946 counties
> Adults under 65, employer-based insurance (or multiple types): 36.0% — 113th lowest of 2,946 counties
> Adults under 65, direct-purchase insurance (or multiple types): 8.4% — 787th lowest of 2,946 counties
> Adults under 65, Tricare/military insurance (or many types): 0.4% — 177th lowest of 2,946 counties

37. Ziebach County, South Dakota
> Adults under 65, no health insurance: 30.1%
> Adults under 65, Medicare coverage (or multiple types): 1.0% — 43rd lowest of 2,946 counties
> Adults under 65, Medicaid coverage (or multiple types): 41.0% — 95th highest of 2,946 counties
> Adults under 65, VA coverage (or multiple types): 0.9% — 593rd lowest of 2,946 counties
> Adults under 65, employer-based insurance (or multiple types): 20.0% — 6th lowest of 2,946 counties
> Adults under 65, direct-purchase insurance (or multiple types): 10.2% — 1,359th highest of 2,946 counties
> Adults under 65, Tricare/military insurance (or many types): 0.1% — 28th lowest of 2,946 counties
[in-text-ad-2]

36. Dewey County, South Dakota
> Adults under 65, no health insurance: 30.2%
> Adults under 65, Medicare coverage (or multiple types): 1.8% — 231st lowest of 2,946 counties
> Adults under 65, Medicaid coverage (or multiple types): 39.1% — 127th highest of 2,946 counties
> Adults under 65, VA coverage (or multiple types): 1.3% — 1,413th lowest of 2,946 counties
> Adults under 65, employer-based insurance (or multiple types): 24.2% — 14th lowest of 2,946 counties
> Adults under 65, direct-purchase insurance (or multiple types): 5.6% — 104th lowest of 2,946 counties
> Adults under 65, Tricare/military insurance (or many types): 0.5% — 212th lowest of 2,946 counties
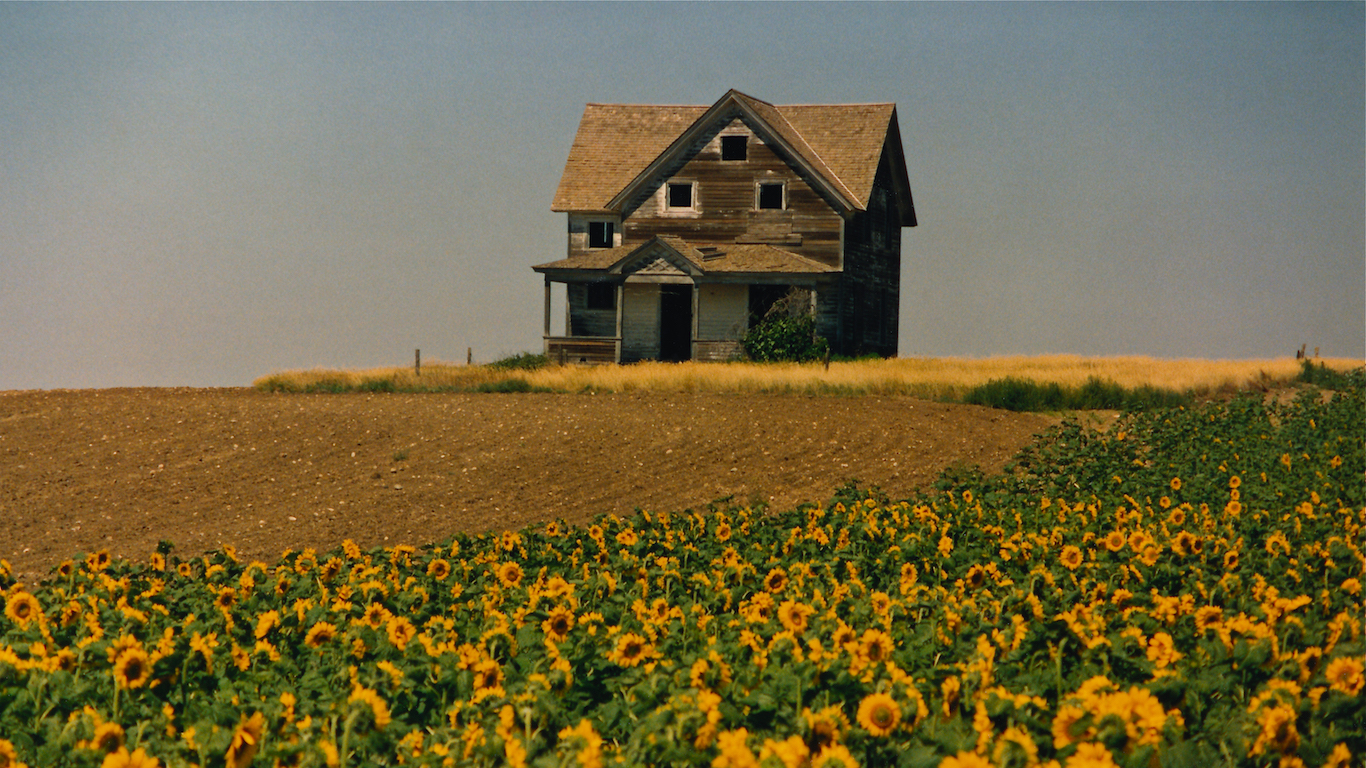
35. Roosevelt County, Montana
> Adults under 65, no health insurance: 30.2%
> Adults under 65, Medicare coverage (or multiple types): 1.9% — 256th lowest of 2,946 counties
> Adults under 65, Medicaid coverage (or multiple types): 28.3% — 744th highest of 2,946 counties
> Adults under 65, VA coverage (or multiple types): 1.5% — 1,133rd highest of 2,946 counties
> Adults under 65, employer-based insurance (or multiple types): 32.9% — 61st lowest of 2,946 counties
> Adults under 65, direct-purchase insurance (or multiple types): 9.3% — 1,181st lowest of 2,946 counties
> Adults under 65, Tricare/military insurance (or many types): 1.5% — 1,470th highest of 2,946 counties
[in-text-ad]

34. Coleman County, Texas
> Adults under 65, no health insurance: 30.7%
> Adults under 65, Medicare coverage (or multiple types): 4.4% — 1,074th highest of 2,946 counties
> Adults under 65, Medicaid coverage (or multiple types): 15.0% — 534th lowest of 2,946 counties
> Adults under 65, VA coverage (or multiple types): 0.6% — 242nd lowest of 2,946 counties
> Adults under 65, employer-based insurance (or multiple types): 46.6% — 594th lowest of 2,946 counties
> Adults under 65, direct-purchase insurance (or multiple types): 8.2% — 697th lowest of 2,946 counties
> Adults under 65, Tricare/military insurance (or many types): 0.9% — 679th lowest of 2,946 counties
33. Jackson County, South Dakota
> Adults under 65, no health insurance: 30.9%
> Adults under 65, Medicare coverage (or multiple types): 3.4% — 1,283rd lowest of 2,946 counties
> Adults under 65, Medicaid coverage (or multiple types): 37.3% — 183rd highest of 2,946 counties
> Adults under 65, VA coverage (or multiple types): 2.5% — 287th highest of 2,946 counties
> Adults under 65, employer-based insurance (or multiple types): 20.6% — 8th lowest of 2,946 counties
> Adults under 65, direct-purchase insurance (or multiple types): 9.4% — 1,261st lowest of 2,946 counties
> Adults under 65, Tricare/military insurance (or many types): 0.6% — 328th lowest of 2,946 counties

32. Hall County, Texas
> Adults under 65, no health insurance: 30.9%
> Adults under 65, Medicare coverage (or multiple types): 2.9% — 914th lowest of 2,946 counties
> Adults under 65, Medicaid coverage (or multiple types): 25.9% — 1,021st highest of 2,946 counties
> Adults under 65, VA coverage (or multiple types): 1.9% — 674th highest of 2,946 counties
> Adults under 65, employer-based insurance (or multiple types): 32.3% — 54th lowest of 2,946 counties
> Adults under 65, direct-purchase insurance (or multiple types): 13.0% — 570th highest of 2,946 counties
> Adults under 65, Tricare/military insurance (or many types): 1.7% — 1,232nd highest of 2,946 counties
[in-text-ad-2]
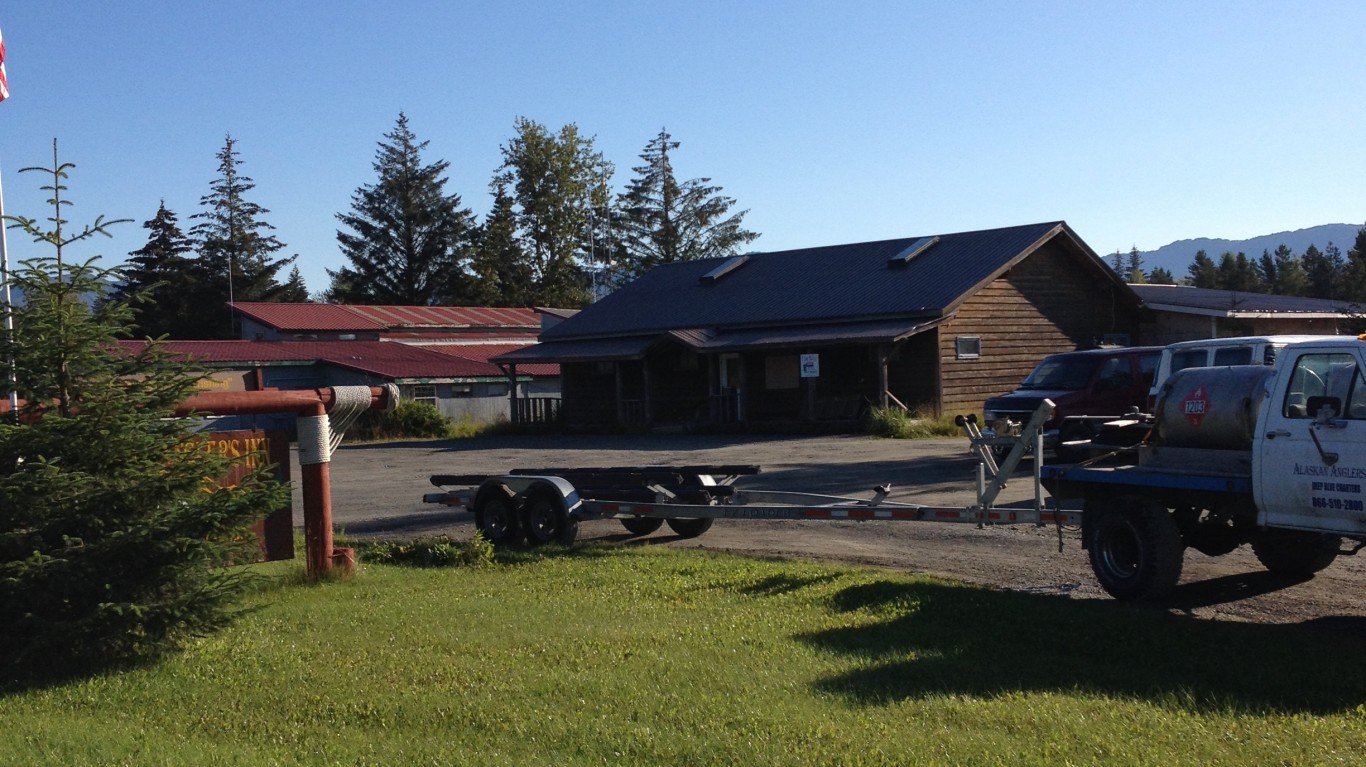
31. Hoonah-Angoon Census Area, Alaska
> Adults under 65, no health insurance: 30.9%
> Adults under 65, Medicare coverage (or multiple types): 3.2% — 1,134th lowest of 2,946 counties
> Adults under 65, Medicaid coverage (or multiple types): 25.4% — 1,078th highest of 2,946 counties
> Adults under 65, VA coverage (or multiple types): 1.4% — 1,442nd highest of 2,946 counties
> Adults under 65, employer-based insurance (or multiple types): 36.1% — 117th lowest of 2,946 counties
> Adults under 65, direct-purchase insurance (or multiple types): 9.5% — 1,300th lowest of 2,946 counties
> Adults under 65, Tricare/military insurance (or many types): 2.9% — 415th highest of 2,946 counties

30. Yukon-Koyukuk Census Area, Alaska
> Adults under 65, no health insurance: 31.0%
> Adults under 65, Medicare coverage (or multiple types): 0.8% — 18th lowest of 2,946 counties
> Adults under 65, Medicaid coverage (or multiple types): 38.6% — 136th highest of 2,946 counties
> Adults under 65, VA coverage (or multiple types): 0.7% — 350th lowest of 2,946 counties
> Adults under 65, employer-based insurance (or multiple types): 30.5% — 38th lowest of 2,946 counties
> Adults under 65, direct-purchase insurance (or multiple types): 2.8% — 14th lowest of 2,946 counties
> Adults under 65, Tricare/military insurance (or many types): 0.8% — 595th lowest of 2,946 counties
[in-text-ad]

29. Briscoe County, Texas
> Adults under 65, no health insurance: 31.1%
> Adults under 65, Medicare coverage (or multiple types): 2.5% — 607th lowest of 2,946 counties
> Adults under 65, Medicaid coverage (or multiple types): 13.5% — 368th lowest of 2,946 counties
> Adults under 65, VA coverage (or multiple types): 1.2% — 1,214th lowest of 2,946 counties
> Adults under 65, employer-based insurance (or multiple types): 44.7% — 451st lowest of 2,946 counties
> Adults under 65, direct-purchase insurance (or multiple types): 7.7% — 526th lowest of 2,946 counties
> Adults under 65, Tricare/military insurance (or many types): 2.4% — 616th highest of 2,946 counties
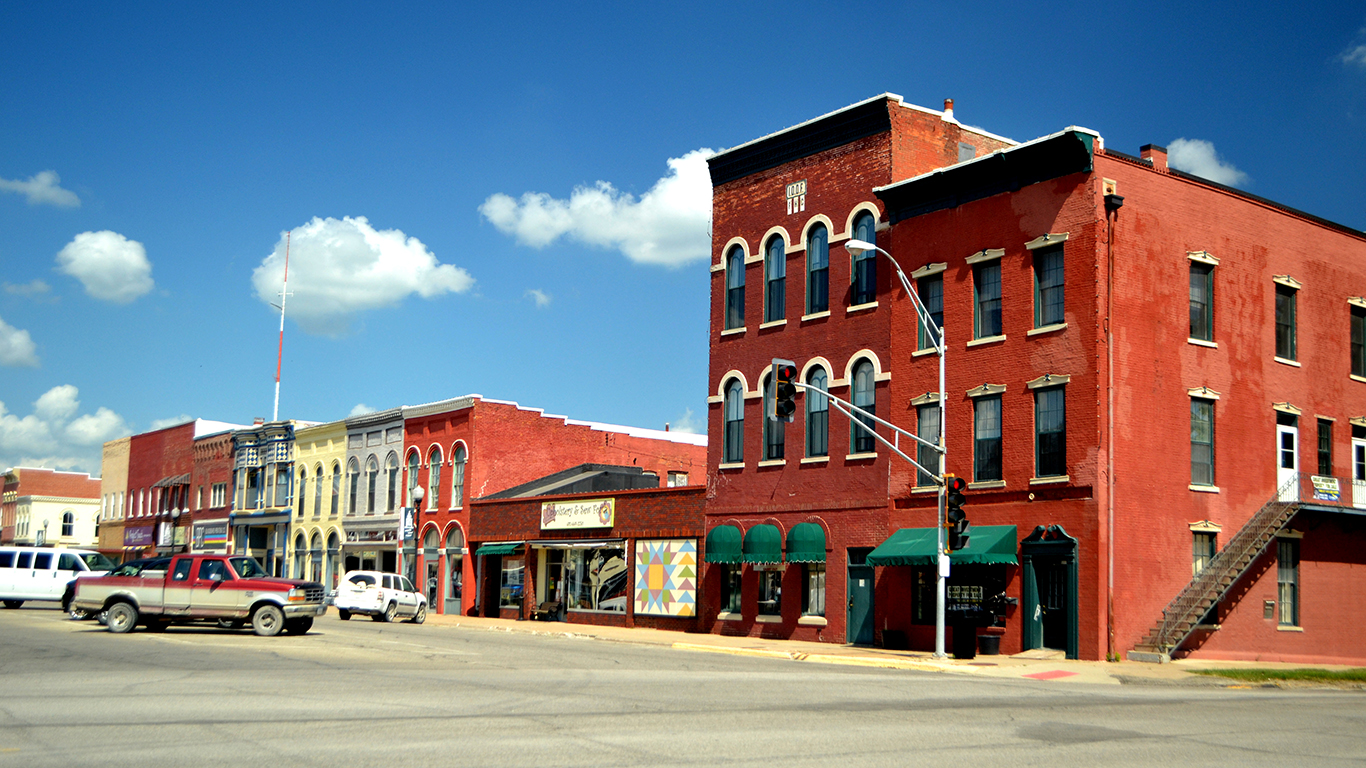
28. Davis County, Iowa
> Adults under 65, no health insurance: 31.1%
> Adults under 65, Medicare coverage (or multiple types): 2.0% — 332nd lowest of 2,946 counties
> Adults under 65, Medicaid coverage (or multiple types): 18.4% — 933rd lowest of 2,946 counties
> Adults under 65, VA coverage (or multiple types): 0.7% — 363rd lowest of 2,946 counties
> Adults under 65, employer-based insurance (or multiple types): 43.7% — 393rd lowest of 2,946 counties
> Adults under 65, direct-purchase insurance (or multiple types): 8.7% — 900th lowest of 2,946 counties
> Adults under 65, Tricare/military insurance (or many types): 0.7% — 429th lowest of 2,946 counties

27. Yoakum County, Texas
> Adults under 65, no health insurance: 31.2%
> Adults under 65, Medicare coverage (or multiple types): 0.9% — 26th lowest of 2,946 counties
> Adults under 65, Medicaid coverage (or multiple types): 13.3% — 344th lowest of 2,946 counties
> Adults under 65, VA coverage (or multiple types): 0.0% reported — 1st lowest of 2,946 counties (tied)
> Adults under 65, employer-based insurance (or multiple types): 49.1% — 807th lowest of 2,946 counties
> Adults under 65, direct-purchase insurance (or multiple types): 9.8% — 1,401st lowest of 2,946 counties
> Adults under 65, Tricare/military insurance (or many types): 0.1% — 25th lowest of 2,946 counties
[in-text-ad-2]

26. Adair County, Oklahoma
> Adults under 65, no health insurance: 31.7%
> Adults under 65, Medicare coverage (or multiple types): 5.1% — 725th highest of 2,946 counties
> Adults under 65, Medicaid coverage (or multiple types): 31.7% — 451st highest of 2,946 counties
> Adults under 65, VA coverage (or multiple types): 1.6% — 1,047th highest of 2,946 counties
> Adults under 65, employer-based insurance (or multiple types): 29.1% — 28th lowest of 2,946 counties
> Adults under 65, direct-purchase insurance (or multiple types): 7.6% — 472nd lowest of 2,946 counties
> Adults under 65, Tricare/military insurance (or many types): 0.8% — 580th lowest of 2,946 counties

25. Willacy County, Texas
> Adults under 65, no health insurance: 31.9%
> Adults under 65, Medicare coverage (or multiple types): 3.6% — 1,395th lowest of 2,946 counties
> Adults under 65, Medicaid coverage (or multiple types): 32.6% — 393rd highest of 2,946 counties
> Adults under 65, VA coverage (or multiple types): 0.8% — 427th lowest of 2,946 counties
> Adults under 65, employer-based insurance (or multiple types): 30.3% — 37th lowest of 2,946 counties
> Adults under 65, direct-purchase insurance (or multiple types): 7.1% — 346th lowest of 2,946 counties
> Adults under 65, Tricare/military insurance (or many types): 0.4% — 184th lowest of 2,946 counties
[in-text-ad]

24. Cameron County, Texas
> Adults under 65, no health insurance: 32.1%
> Adults under 65, Medicare coverage (or multiple types): 2.7% — 732nd lowest of 2,946 counties
> Adults under 65, Medicaid coverage (or multiple types): 28.3% — 737th highest of 2,946 counties
> Adults under 65, VA coverage (or multiple types): 0.9% — 576th lowest of 2,946 counties
> Adults under 65, employer-based insurance (or multiple types): 33.5% — 70th lowest of 2,946 counties
> Adults under 65, direct-purchase insurance (or multiple types): 6.2% — 172nd lowest of 2,946 counties
> Adults under 65, Tricare/military insurance (or many types): 0.8% — 501st lowest of 2,946 counties
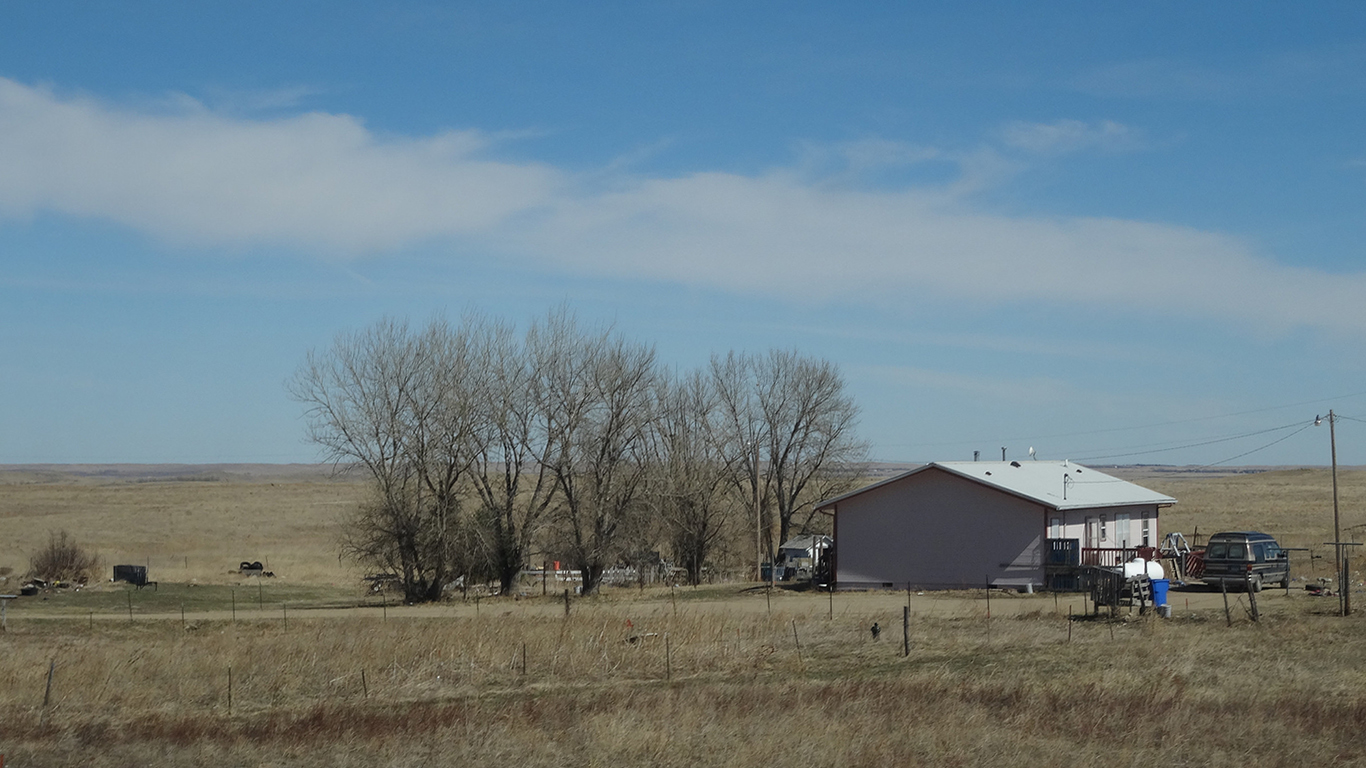
23. Todd County, South Dakota
> Adults under 65, no health insurance: 32.3%
> Adults under 65, Medicare coverage (or multiple types): 5.1% — 711th highest of 2,946 counties
> Adults under 65, Medicaid coverage (or multiple types): 49.8% — 20th highest of 2,946 counties
> Adults under 65, VA coverage (or multiple types): 0.7% — 347th lowest of 2,946 counties
> Adults under 65, employer-based insurance (or multiple types): 14.3% — 3rd lowest of 2,946 counties
> Adults under 65, direct-purchase insurance (or multiple types): 1.4% — 6th lowest of 2,946 counties
> Adults under 65, Tricare/military insurance (or many types): 0.1% — 24th lowest of 2,946 counties

22. Cochran County, Texas
> Adults under 65, no health insurance: 32.5%
> Adults under 65, Medicare coverage (or multiple types): 1.9% — 259th lowest of 2,946 counties
> Adults under 65, Medicaid coverage (or multiple types): 21.2% — 1,315th lowest of 2,946 counties
> Adults under 65, VA coverage (or multiple types): 1.0% — 744th lowest of 2,946 counties
> Adults under 65, employer-based insurance (or multiple types): 36.7% — 128th lowest of 2,946 counties
> Adults under 65, direct-purchase insurance (or multiple types): 8.5% — 826th lowest of 2,946 counties
> Adults under 65, Tricare/military insurance (or many types): 0.9% — 701st lowest of 2,946 counties
[in-text-ad-2]
21. Hudspeth County, Texas
> Adults under 65, no health insurance: 32.6%
> Adults under 65, Medicare coverage (or multiple types): 6.7% — 281st highest of 2,946 counties
> Adults under 65, Medicaid coverage (or multiple types): 37.0% — 193rd highest of 2,946 counties
> Adults under 65, VA coverage (or multiple types): 1.9% — 724th highest of 2,946 counties
> Adults under 65, employer-based insurance (or multiple types): 26.5% — 18th lowest of 2,946 counties
> Adults under 65, direct-purchase insurance (or multiple types): 2.7% — 13th lowest of 2,946 counties
> Adults under 65, Tricare/military insurance (or many types): 2.3% — 654th highest of 2,946 counties

20. Zapata County, Texas
> Adults under 65, no health insurance: 32.8%
> Adults under 65, Medicare coverage (or multiple types): 1.3% — 95th lowest of 2,946 counties
> Adults under 65, Medicaid coverage (or multiple types): 33.7% — 338th highest of 2,946 counties
> Adults under 65, VA coverage (or multiple types): 0.3% — 68th lowest of 2,946 counties
> Adults under 65, employer-based insurance (or multiple types): 31.9% — 52nd lowest of 2,946 counties
> Adults under 65, direct-purchase insurance (or multiple types): 3.9% — 34th lowest of 2,946 counties
> Adults under 65, Tricare/military insurance (or many types): 0.0% reported — 1st lowest of 2,946 counties (tied)
[in-text-ad]
19. Presidio County, Texas
> Adults under 65, no health insurance: 33.0%
> Adults under 65, Medicare coverage (or multiple types): 3.9% — 1,336th highest of 2,946 counties
> Adults under 65, Medicaid coverage (or multiple types): 26.5% — 957th highest of 2,946 counties
> Adults under 65, VA coverage (or multiple types): 0.0% reported — 1st lowest of 2,946 counties (tied)
> Adults under 65, employer-based insurance (or multiple types): 31.8% — 50th lowest of 2,946 counties
> Adults under 65, direct-purchase insurance (or multiple types): 9.4% — 1,216th lowest of 2,946 counties (tied)
> Adults under 65, Tricare/military insurance (or many types): 0.0% reported — 1st lowest of 2,946 counties (tied)

18. Hidalgo County, Texas
> Adults under 65, no health insurance: 33.4%
> Adults under 65, Medicare coverage (or multiple types): 2.4% — 564th lowest of 2,946 counties
> Adults under 65, Medicaid coverage (or multiple types): 29.0% — 662nd highest of 2,946 counties
> Adults under 65, VA coverage (or multiple types): 0.8% — 412th lowest of 2,946 counties
> Adults under 65, employer-based insurance (or multiple types): 29.5% — 30th lowest of 2,946 counties
> Adults under 65, direct-purchase insurance (or multiple types): 8.4% — 795th lowest of 2,946 counties
> Adults under 65, Tricare/military insurance (or many types): 0.6% — 308th lowest of 2,946 counties

17. Glades County, Florida
> Adults under 65, no health insurance: 33.8%
> Adults under 65, Medicare coverage (or multiple types): 5.1% — 751st highest of 2,946 counties
> Adults under 65, Medicaid coverage (or multiple types): 27.5% — 818th highest of 2,946 counties
> Adults under 65, VA coverage (or multiple types): 2.6% — 234th highest of 2,946 counties
> Adults under 65, employer-based insurance (or multiple types): 29.0% — 26th lowest of 2,946 counties
> Adults under 65, direct-purchase insurance (or multiple types): 8.1% — 655th lowest of 2,946 counties
> Adults under 65, Tricare/military insurance (or many types): 0.3% — 110th lowest of 2,946 counties
[in-text-ad-2]
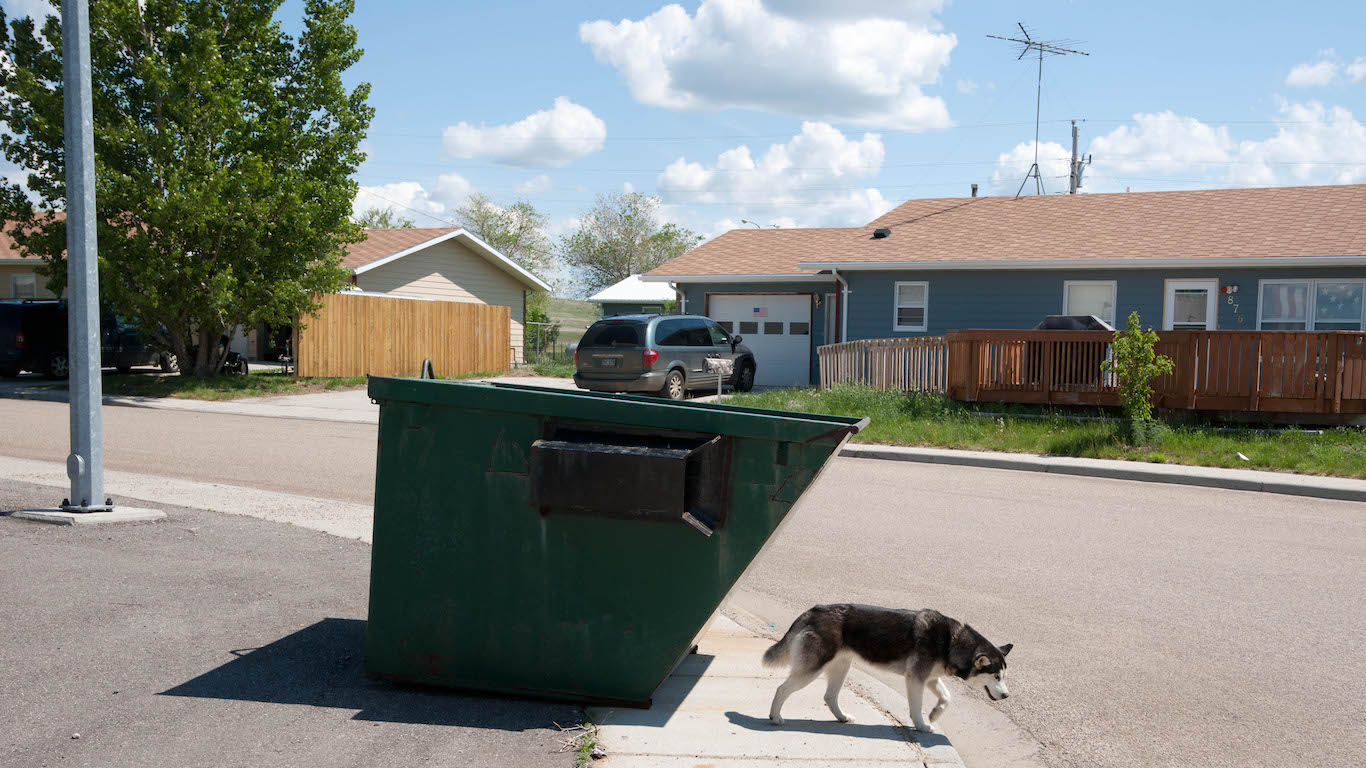
16. Sioux County, North Dakota
> Adults under 65, no health insurance: 34.0%
> Adults under 65, Medicare coverage (or multiple types): 2.2% — 436th lowest of 2,946 counties
> Adults under 65, Medicaid coverage (or multiple types): 32.2% — 422nd highest of 2,946 counties
> Adults under 65, VA coverage (or multiple types): 1.2% — 1,128th lowest of 2,946 counties
> Adults under 65, employer-based insurance (or multiple types): 27.1% — 21st lowest of 2,946 counties
> Adults under 65, direct-purchase insurance (or multiple types): 7.2% — 395th lowest of 2,946 counties
> Adults under 65, Tricare/military insurance (or many types): 1.1% — 1,015th lowest of 2,946 counties

15. Dallam County, Texas
> Adults under 65, no health insurance: 34.3%
> Adults under 65, Medicare coverage (or multiple types): 1.0% — 44th lowest of 2,946 counties
> Adults under 65, Medicaid coverage (or multiple types): 12.7% — 297th lowest of 2,946 counties
> Adults under 65, VA coverage (or multiple types): 0.6% — 203rd lowest of 2,946 counties
> Adults under 65, employer-based insurance (or multiple types): 41.6% — 295th lowest of 2,946 counties
> Adults under 65, direct-purchase insurance (or multiple types): 12.0% — 753rd highest of 2,946 counties
> Adults under 65, Tricare/military insurance (or many types): 0.2% — 57th lowest of 2,946 counties
[in-text-ad]

14. Maverick County, Texas
> Adults under 65, no health insurance: 35.0%
> Adults under 65, Medicare coverage (or multiple types): 1.7% — 189th lowest of 2,946 counties
> Adults under 65, Medicaid coverage (or multiple types): 25.4% — 1,077th highest of 2,946 counties
> Adults under 65, VA coverage (or multiple types): 0.3% — 55th lowest of 2,946 counties
> Adults under 65, employer-based insurance (or multiple types): 34.2% — 83rd lowest of 2,946 counties
> Adults under 65, direct-purchase insurance (or multiple types): 6.8% — 275th lowest of 2,946 counties
> Adults under 65, Tricare/military insurance (or many types): 0.1% — 26th lowest of 2,946 counties
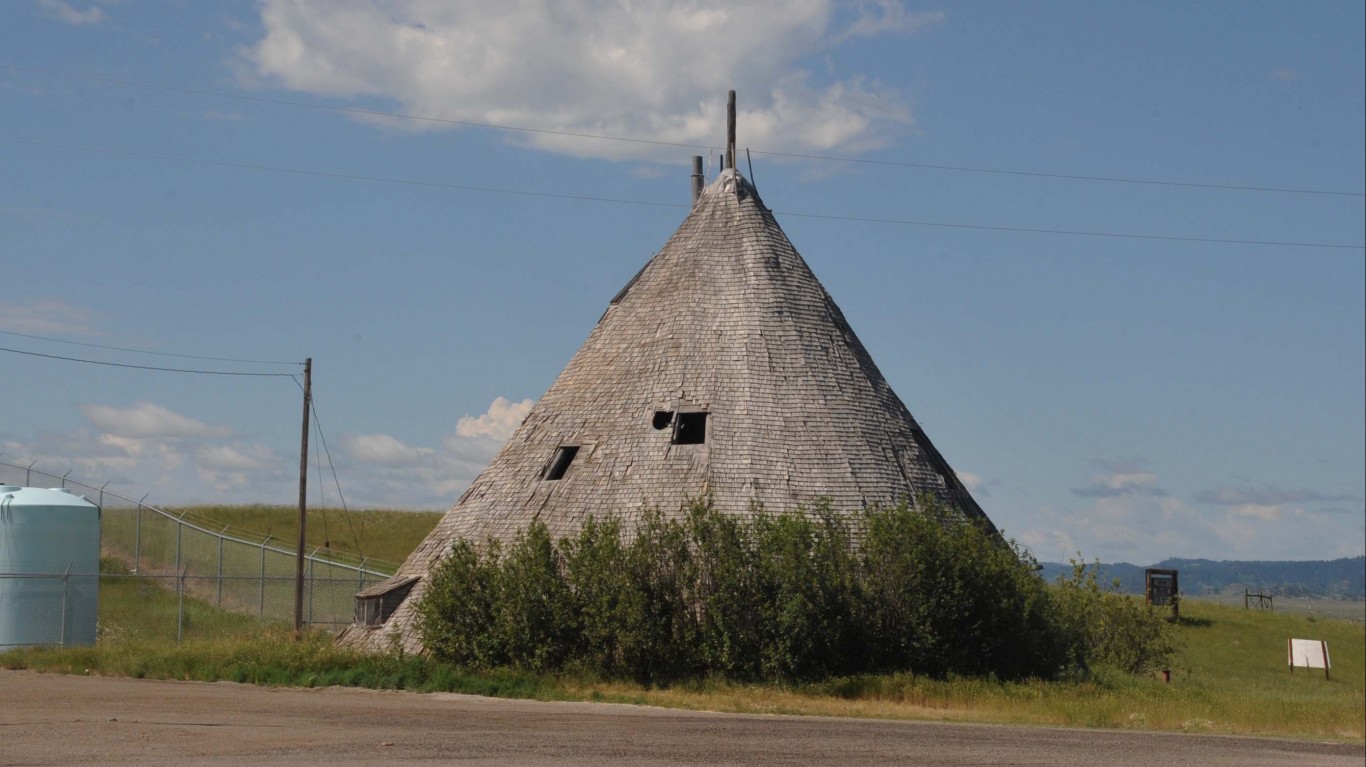
13. Big Horn County, Montana
> Adults under 65, no health insurance: 36.1%
> Adults under 65, Medicare coverage (or multiple types): 2.5% — 593rd lowest of 2,946 counties
> Adults under 65, Medicaid coverage (or multiple types): 32.3% — 417th highest of 2,946 counties
> Adults under 65, VA coverage (or multiple types): 0.8% — 418th lowest of 2,946 counties
> Adults under 65, employer-based insurance (or multiple types): 27.1% — 20th lowest of 2,946 counties
> Adults under 65, direct-purchase insurance (or multiple types): 4.8% — 52nd lowest of 2,946 counties
> Adults under 65, Tricare/military insurance (or many types): 0.9% — 767th lowest of 2,946 counties
12. Real County, Texas
> Adults under 65, no health insurance: 36.5%
> Adults under 65, Medicare coverage (or multiple types): 2.4% — 546th lowest of 2,946 counties
> Adults under 65, Medicaid coverage (or multiple types): 31.2% — 486th highest of 2,946 counties
> Adults under 65, VA coverage (or multiple types): 0.4% — 100th lowest of 2,946 counties
> Adults under 65, employer-based insurance (or multiple types): 26.1% — 17th lowest of 2,946 counties
> Adults under 65, direct-purchase insurance (or multiple types): 6.3% — 200th lowest of 2,946 counties
> Adults under 65, Tricare/military insurance (or many types): 2.2% — 730th highest of 2,946 counties
[in-text-ad-2]

11. Gaines County, Texas
> Adults under 65, no health insurance: 36.8%
> Adults under 65, Medicare coverage (or multiple types): 2.1% — 386th lowest of 2,946 counties
> Adults under 65, Medicaid coverage (or multiple types): 13.5% — 372nd lowest of 2,946 counties
> Adults under 65, VA coverage (or multiple types): 0.4% — 109th lowest of 2,946 counties
> Adults under 65, employer-based insurance (or multiple types): 44.9% — 471st lowest of 2,946 counties
> Adults under 65, direct-purchase insurance (or multiple types): 5.1% — 68th lowest of 2,946 counties
> Adults under 65, Tricare/military insurance (or many types): 1.2% — 1,155th lowest of 2,946 counties

10. Starr County, Texas
> Adults under 65, no health insurance: 38.6%
> Adults under 65, Medicare coverage (or multiple types): 3.2% — 1,132nd lowest of 2,946 counties
> Adults under 65, Medicaid coverage (or multiple types): 35.5% — 255th highest of 2,946 counties
> Adults under 65, VA coverage (or multiple types): 0.3% — 42nd lowest of 2,946 counties
> Adults under 65, employer-based insurance (or multiple types): 22.3% — 9th lowest of 2,946 counties
> Adults under 65, direct-purchase insurance (or multiple types): 4.3% — 40th lowest of 2,946 counties
> Adults under 65, Tricare/military insurance (or many types): 0.2% — 45th lowest of 2,946 counties
[in-text-ad]
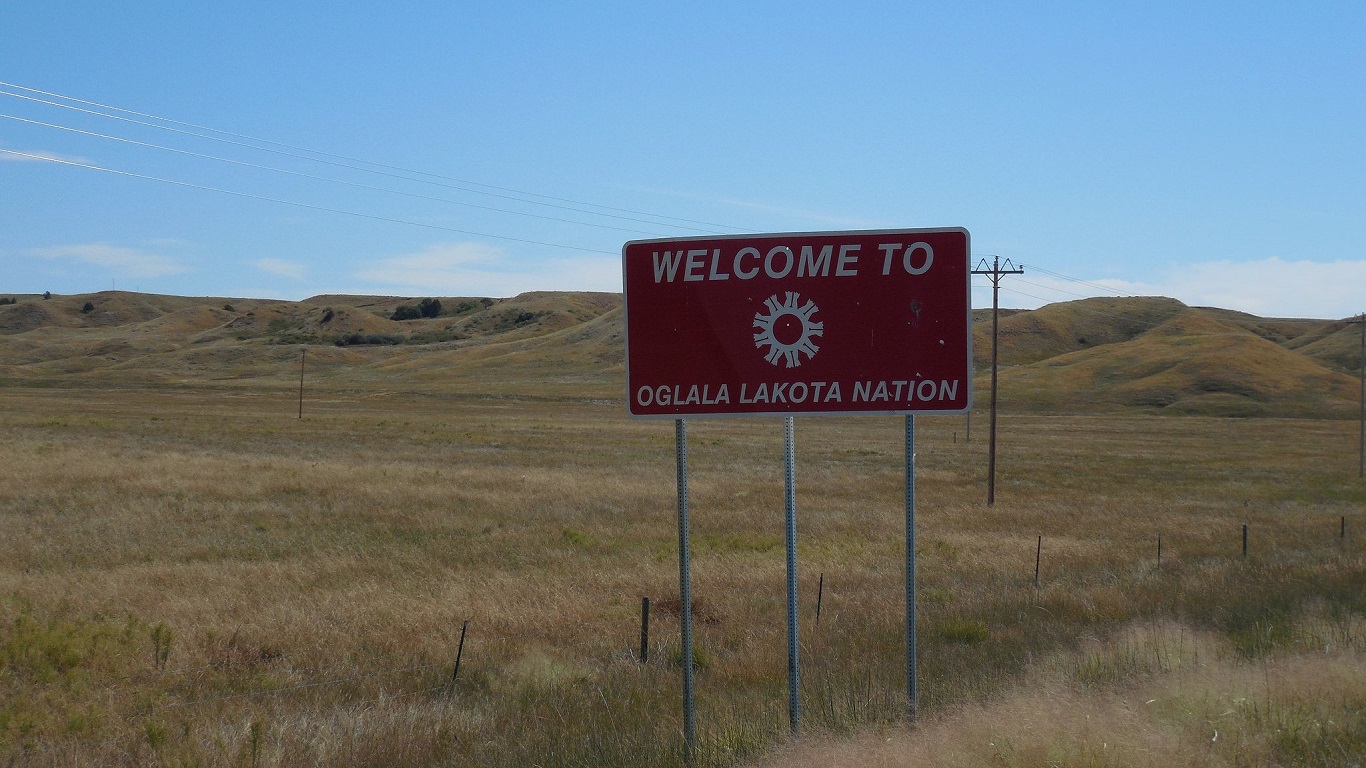
9. Oglala Lakota County, South Dakota
> Adults under 65, no health insurance: 39.1%
> Adults under 65, Medicare coverage (or multiple types): 2.5% — 594th lowest of 2,946 counties
> Adults under 65, Medicaid coverage (or multiple types): 46.7% — 29th highest of 2,946 counties
> Adults under 65, VA coverage (or multiple types): 0.9% — 675th lowest of 2,946 counties
> Adults under 65, employer-based insurance (or multiple types): 12.2% — 1st lowest of 2,946 counties
> Adults under 65, direct-purchase insurance (or multiple types): 1.1% — 4th lowest of 2,946 counties
> Adults under 65, Tricare/military insurance (or many types): 0.1% — 30th lowest of 2,946 counties

8. Mellette County, South Dakota
> Adults under 65, no health insurance: 39.3%
> Adults under 65, Medicare coverage (or multiple types): 4.9% — 795th highest of 2,946 counties
> Adults under 65, Medicaid coverage (or multiple types): 38.2% — 152nd highest of 2,946 counties
> Adults under 65, VA coverage (or multiple types): 0.2% — 25th lowest of 2,946 counties
> Adults under 65, employer-based insurance (or multiple types): 15.2% — 4th lowest of 2,946 counties
> Adults under 65, direct-purchase insurance (or multiple types): 6.1% — 171st lowest of 2,946 counties
> Adults under 65, Tricare/military insurance (or many types): 0.2% — 41st lowest of 2,946 counties

7. Scotland County, Missouri
> Adults under 65, no health insurance: 39.6%
> Adults under 65, Medicare coverage (or multiple types): 1.6% — 174th lowest of 2,946 counties
> Adults under 65, Medicaid coverage (or multiple types): 14.7% — 503rd lowest of 2,946 counties
> Adults under 65, VA coverage (or multiple types): 0.3% — 46th lowest of 2,946 counties
> Adults under 65, employer-based insurance (or multiple types): 42.8% — 353rd lowest of 2,946 counties
> Adults under 65, direct-purchase insurance (or multiple types): 7.6% — 495th lowest of 2,946 counties
> Adults under 65, Tricare/military insurance (or many types): 0.5% — 234th lowest of 2,946 counties
[in-text-ad-2]

6. Buffalo County, South Dakota
> Adults under 65, no health insurance: 41.7%
> Adults under 65, Medicare coverage (or multiple types): 5.1% — 750th highest of 2,946 counties
> Adults under 65, Medicaid coverage (or multiple types): 35.6% — 249th highest of 2,946 counties
> Adults under 65, VA coverage (or multiple types): 1.1% — 1,056th lowest of 2,946 counties
> Adults under 65, employer-based insurance (or multiple types): 13.1% — 2nd lowest of 2,946 counties
> Adults under 65, direct-purchase insurance (or multiple types): 6.8% — 279th lowest of 2,946 counties
> Adults under 65, Tricare/military insurance (or many types): 0.5% — 261st lowest of 2,946 counties
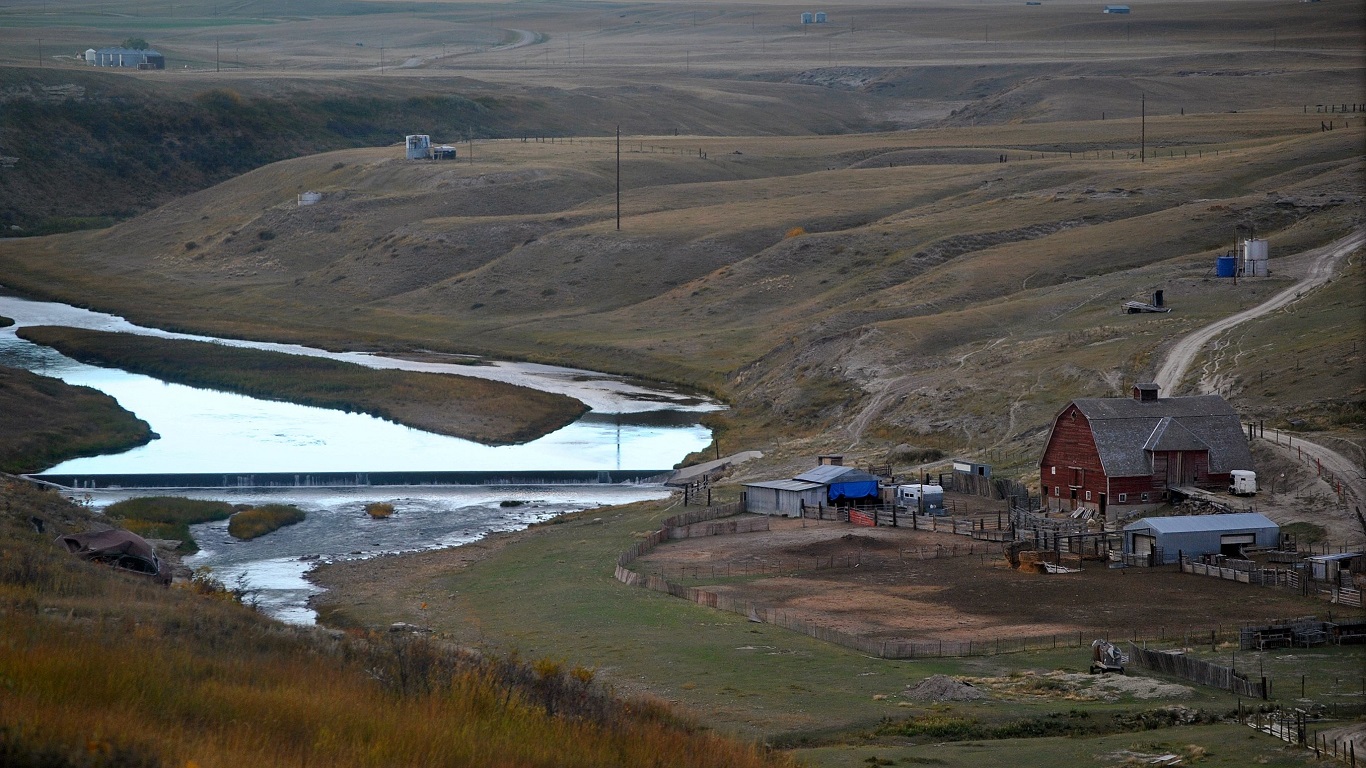
5. Glacier County, Montana
> Adults under 65, no health insurance: 42.3%
> Adults under 65, Medicare coverage (or multiple types): 2.0% — 305th lowest of 2,946 counties
> Adults under 65, Medicaid coverage (or multiple types): 31.1% — 495th highest of 2,946 counties
> Adults under 65, VA coverage (or multiple types): 1.1% — 935th lowest of 2,946 counties
> Adults under 65, employer-based insurance (or multiple types): 23.0% — 12th lowest of 2,946 counties
> Adults under 65, direct-purchase insurance (or multiple types): 3.9% — 30th lowest of 2,946 counties
> Adults under 65, Tricare/military insurance (or many types): 0.4% — 182nd lowest of 2,946 counties
[in-text-ad]
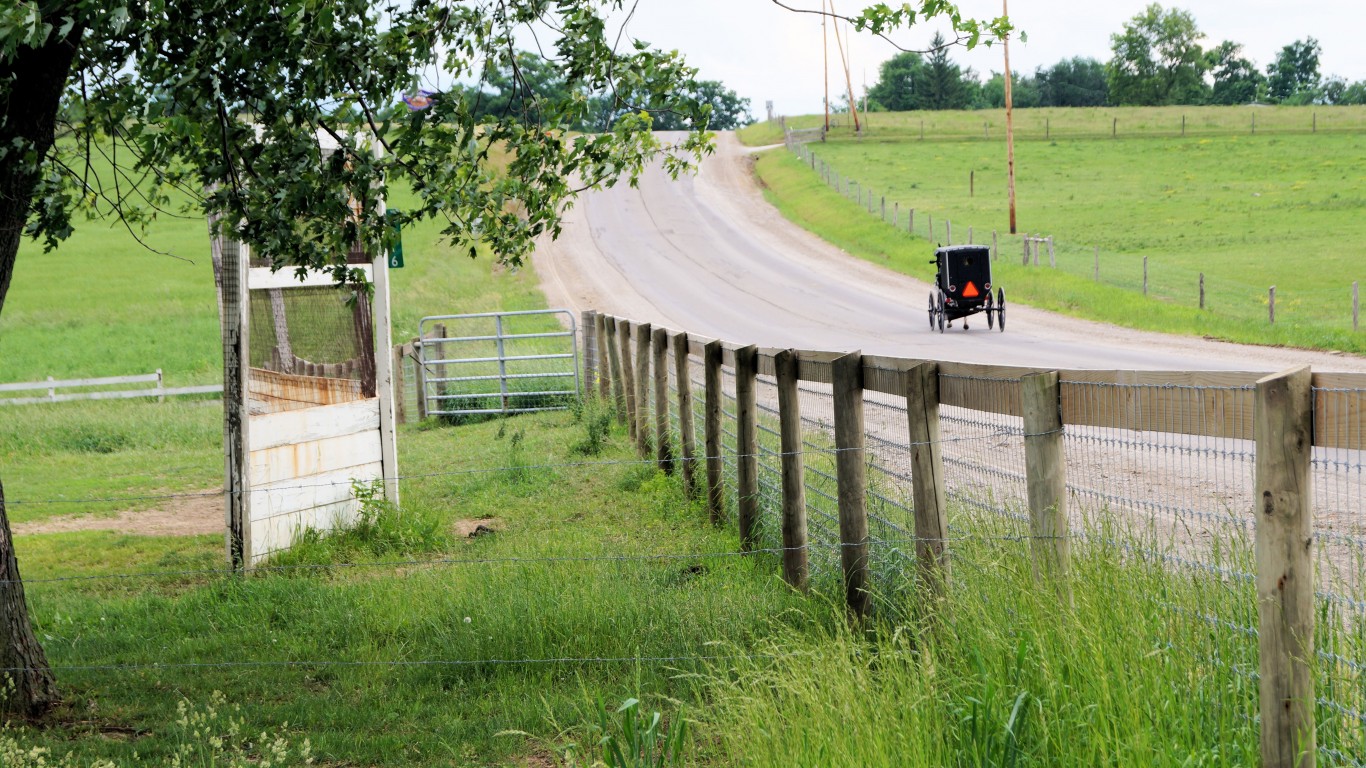
4. Holmes County, Ohio
> Adults under 65, no health insurance: 44.6%
> Adults under 65, Medicare coverage (or multiple types): 1.7% — 185th lowest of 2,946 counties
> Adults under 65, Medicaid coverage (or multiple types): 8.8% — 69th lowest of 2,946 counties
> Adults under 65, VA coverage (or multiple types): 0.6% — 233rd lowest of 2,946 counties
> Adults under 65, employer-based insurance (or multiple types): 36.8% — 133rd lowest of 2,946 counties
> Adults under 65, direct-purchase insurance (or multiple types): 10.7% — 1,164th highest of 2,946 counties
> Adults under 65, Tricare/military insurance (or many types): 0.3% — 80th lowest of 2,946 counties
3. Menard County, Texas
> Adults under 65, no health insurance: 44.7%
> Adults under 65, Medicare coverage (or multiple types): 5.3% — 654th highest of 2,946 counties
> Adults under 65, Medicaid coverage (or multiple types): 14.3% — 470th lowest of 2,946 counties
> Adults under 65, VA coverage (or multiple types): 1.7% — 963rd highest of 2,946 counties
> Adults under 65, employer-based insurance (or multiple types): 31.7% — 49th lowest of 2,946 counties
> Adults under 65, direct-purchase insurance (or multiple types): 12.9% — 597th highest of 2,946 counties
> Adults under 65, Tricare/military insurance (or many types): 1.7% — 1,211th highest of 2,946 counties
2. LaGrange County, Indiana
> Adults under 65, no health insurance: 45.6%
> Adults under 65, Medicare coverage (or multiple types): 2.5% — 613th lowest of 2,946 counties
> Adults under 65, Medicaid coverage (or multiple types): 10.5% — 150th lowest of 2,946 counties
> Adults under 65, VA coverage (or multiple types): 0.9% — 733rd lowest of 2,946 counties
> Adults under 65, employer-based insurance (or multiple types): 38.7% — 180th lowest of 2,946 counties
> Adults under 65, direct-purchase insurance (or multiple types): 6.2% — 186th lowest of 2,946 counties
> Adults under 65, Tricare/military insurance (or many types): 0.3% — 83rd lowest of 2,946 counties
[in-text-ad-2]
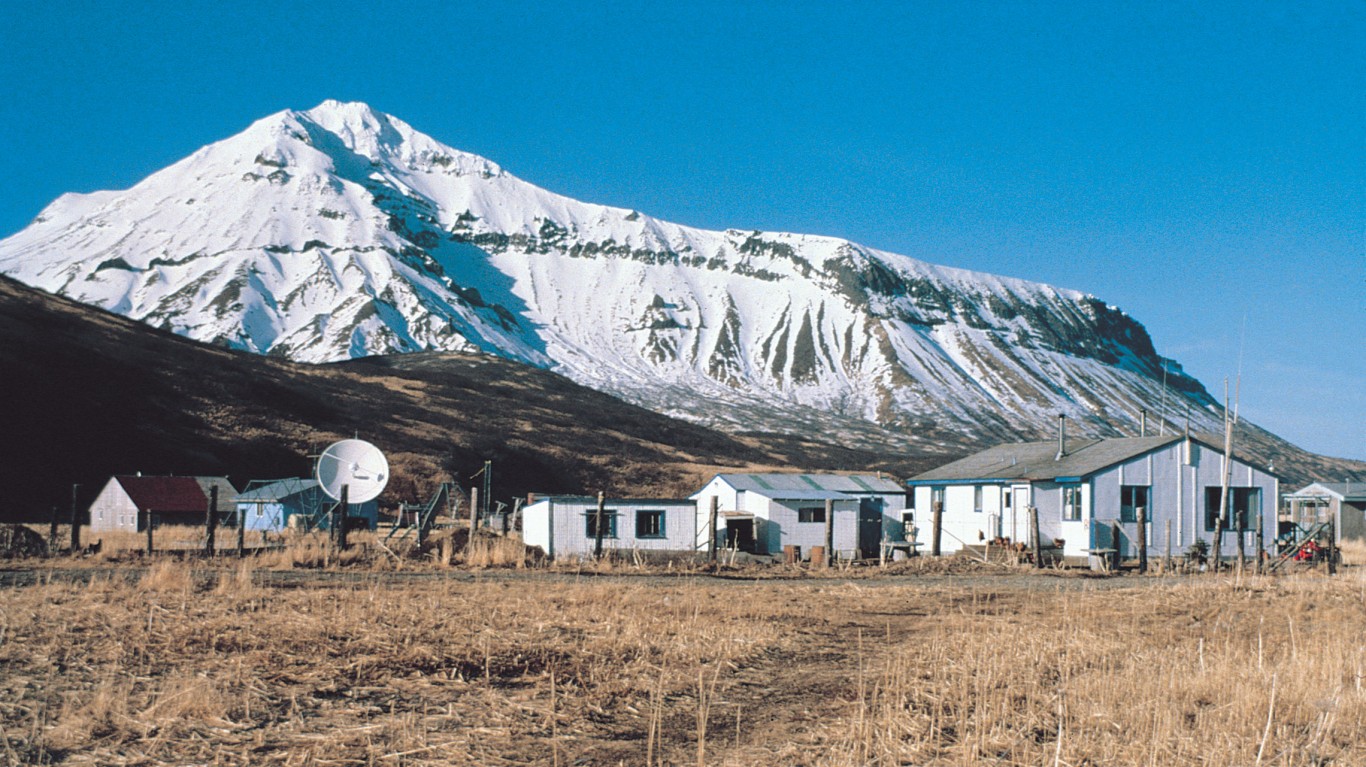
1. Aleutians East Borough, Alaska
> Adults under 65, no health insurance: 50.6%
> Adults under 65, Medicare coverage (or multiple types): 0.9% — 25th lowest of 2,946 counties
> Adults under 65, Medicaid coverage (or multiple types): 13.7% — 399th lowest of 2,946 counties
> Adults under 65, VA coverage (or multiple types): 0.4% — 102nd lowest of 2,946 counties
> Adults under 65, employer-based insurance (or multiple types): 31.8% — 51st lowest of 2,946 counties
> Adults under 65, direct-purchase insurance (or multiple types): 4.0% — 35th lowest of 2,946 counties
> Adults under 65, Tricare/military insurance (or many types): 0.3% — 89th lowest of 2,946 counties
Methodology:
To determine the counties with the worst health insurance coverage in the nation, 24/7 Wall St. reviewed five-year estimates of the percentage of the noninstitutionalized civilian population under 65 without health insurance from the U.S. Census Bureau’s 2019 American Community Survey.
Of the 3,220 counties or county equivalents, 3,142 had boundaries that fell within one of the 50 states or the District of Columbia.
Counties were excluded if the noninstitutionalized civilian population under 65 was less than 1,000, or if the sampling error associated with a county’s data was deemed too high.
The sampling error was defined as too high if the coefficient of variation — a statistical assessment of how reliable an estimate is — for a county’s under 65 uninsured rate was above 15% and greater than two standard deviations above the mean CV for all counties’ under 65 uninsured rates. We similarly excluded counties that had a sampling error too high for their under 65 noninstitutionalized civilian population, using the same definition.
We selected the under 65 age group because Americans become eligible for Medicare at age 65, and the uninsured rate for the population above this age is less than 1% nationwide. However, because the census doesn’t publish insurance coverage estimates specifically for the under 65 age group, we aggregated the data from more granular age breakdowns.
To ensure each aggregate estimate’s sampling error could be assessed using the definition above, we derived a margin of error for each aggregate estimate using the successive differences replication variance estimation methodology recommended and used by the U.S. Census Bureau.
The remaining 2,946 places were ranked based on their under 65 uninsured rates. To break ties, we used the number of insured people in the same population group.
The shares of the population covered by each type of insurance — Medicare, Medicaid, VA, employer, direct-purchase, and Tricare/military — are for the same cohort and are also aggregated from five-year ACS estimates. The estimates reflect people who are covered by that type of insurance alone or in combination with other types on the list. So, when a person is covered by more than one type of insurance, they are included in each group.
Thank you for reading! Have some feedback for us?
Contact the 24/7 Wall St. editorial team.
 24/7 Wall St.
 24/7 Wall St.
 24/7 Wall St.


