Special Report
How Many People Are Still Alive From the Year You Were Born
Published:

The number of births in the United States declined again in 2020, with fertility rates dropping or staying flat across all age and racial groups. Falling from 3.75 million births in 2019 to 3.61 million births in 2020, the 4% drop marks the sixth consecutive year the U.S. birth rate has decreased, according to the National Center for Health Statistics. In addition, the total fertility rate has been below replacement level of about 2.1 children per woman — the level at which a population exactly replaces itself from one generation to the next, without accounting for migration — since 1971.
Even so, the nation’s population continues to grow, climbing to about 330 million as of the middle of last year, according to estimates from the U.S. Census Bureau. The U.S. population has been rising generally because of immigration and longer life expectancy.
The inexorable cycle of births and deaths is often very different from one generation to the next, and tends to change as people age. Some might wonder, how many people in a given age group are still around?
24/7 Tempo has determined how many people born each year since 1937 are alive today. We used data collected from government agencies such as the U.S. Census Bureau and the Bureau of Economic Analysis to create the list.
Largely due to developments in medical technology such as treatments for cancer and heart disease, life expectancy rose significantly over the decades since 1930. The average person born in 1930 had an average life expectancy of 59.7 years; by 2012, the average life expectancy at birth had increased to 78.8 years. (Click here to see the most famous person the same age as you.)
More recently, however, due to sharp increases in opioid overdose deaths as well as to some extent high levels of COVID-19 deaths last year, life expectancy has declined in recent years. In the first half of 2020, life expectancy at birth for the U.S. population was 77.8 years, down from 78.8 years in 2019. (Here is the city with the longest life expectancy in every state.)
Click here to see how many people from the year you were born are still alive
To identify how many people are still alive from the year you were born, 24/7 Tempo reviewed native-born population estimates from the U.S. Census Bureau. These estimates adjust for both naturalized citizens as well as native-born Americans living outside the United States. The share of people born each year since 1937 alive in 2021 was calculated by comparing these U.S. Census Bureau population projections to the number of births each year from the Centers for Disease Control and Prevention’s Vital Statistics of the United States report series. Total U.S. population figures in each year are from the Bureau of Economic Analysis.

> 84-year-old pop., 2021:
> People born in 1937 still alive today: 38.8%
> Births in 1937: 2,413,000
> U.S. population, 1937: 128,824,829
[in-text-ad]
> 83-year-old pop., 2021:
> People born in 1938 still alive today: 42.4%
> Births in 1938: 2,496,000
> U.S. population, 1938: 129,824,939
> 82-year-old pop., 2021:
> People born in 1939 still alive today: 46.4%
> Births in 1939: 2,466,000
> U.S. population, 1939: 130,879,718

> 81-year-old pop., 2021:
> People born in 1940 still alive today: 48.9%
> Births in 1940: 2,559,000
> U.S. population, 1940: 132,122,446
> 80-year-old pop., 2021:
> People born in 1941 still alive today: 50.4%
> Births in 1941: 2,703,000
> U.S. population, 1941: 133,402,471
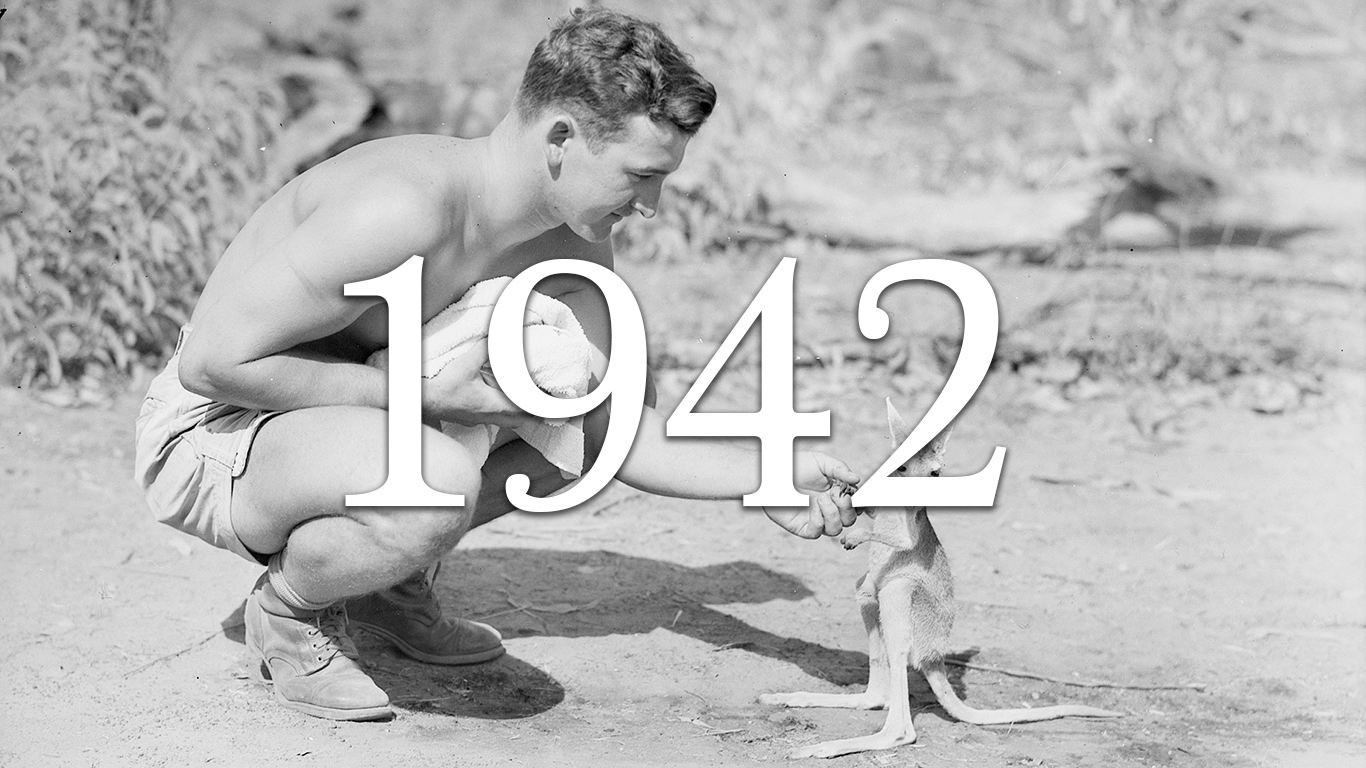
> 79-year-old pop., 2021:
> People born in 1942 still alive today: 51.2%
> Births in 1942: 2,989,000
> U.S. population, 1942: 134,859,553

> 78-year-old pop., 2021:
> People born in 1943 still alive today: 58.1%
> Births in 1943: 3,104,000
> U.S. population, 1943: 136,739,353
[in-text-ad-2]

> 77-year-old pop., 2021:
> People born in 1944 still alive today: 60.7%
> Births in 1944: 2,939,000
> U.S. population, 1944: 138,397,345
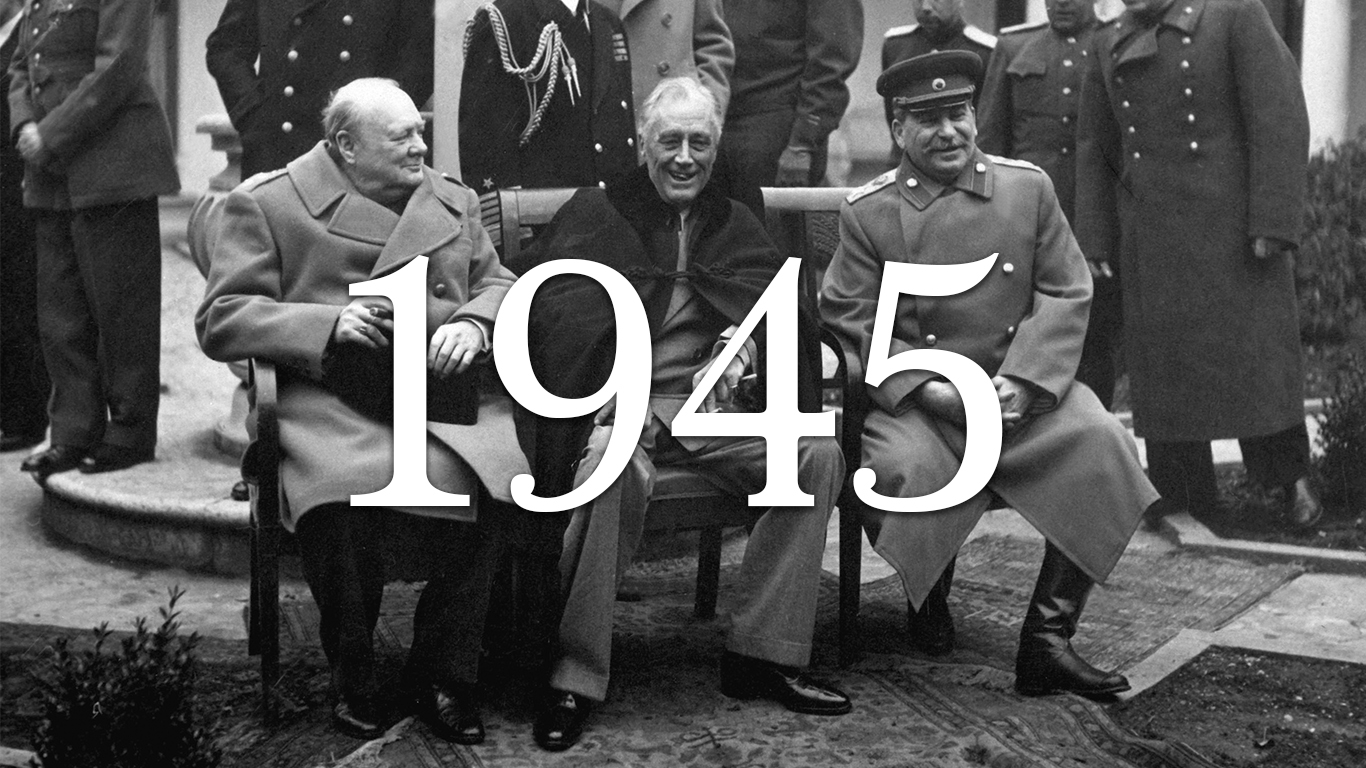
> 76-year-old pop., 2021:
> People born in 1945 still alive today: 64.9%
> Births in 1945: 2,858,000
> U.S. population, 1945: 139,928,165
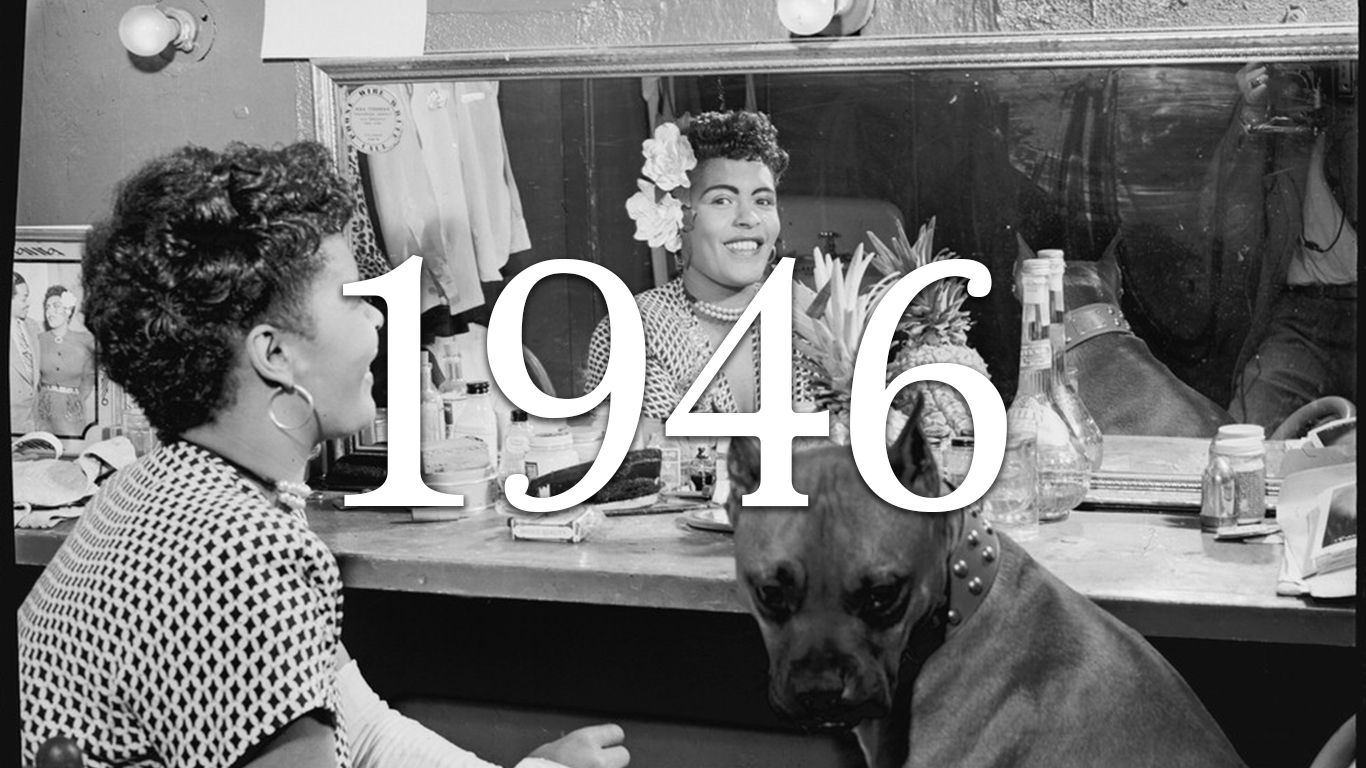
> 75-year-old pop., 2021:
> People born in 1946 still alive today: 55.8%
> Births in 1946: 3,411,000
> U.S. population, 1946: 141,388,566

> 74-year-old pop., 2021:
> People born in 1947 still alive today: 69.4%
> Births in 1947: 3,817,000
> U.S. population, 1947: 144,126,071
[in-text-ad]

> 73-year-old pop., 2021:
> People born in 1948 still alive today: 70.2%
> Births in 1948: 3,637,000
> U.S. population, 1948: 146,631,302

> 72-year-old pop., 2021:
> People born in 1949 still alive today: 71.2%
> Births in 1949: 3,649,000
> U.S. population, 1949: 149,188,130

> 71-year-old pop., 2021:
> People born in 1950 still alive today: 74.0%
> Births in 1950: 3,632,000
> U.S. population, 1950: 152,271,417

> 70-year-old pop., 2021:
> People born in 1951 still alive today: 72.8%
> Births in 1951: 3,820,000
> U.S. population, 1951: 154,877,889
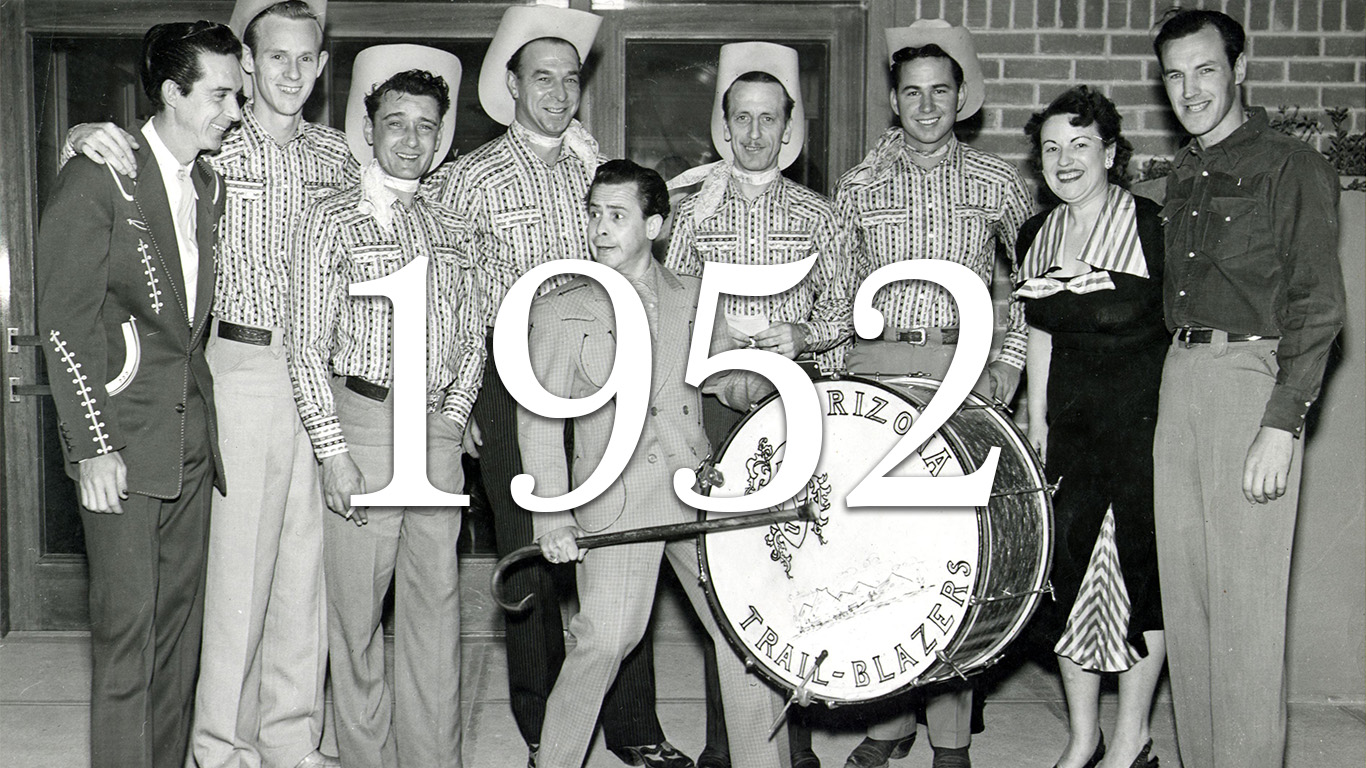
> 69-year-old pop., 2021:
> People born in 1952 still alive today: 73.9%
> Births in 1952: 3,909,000
> U.S. population, 1952: 157,552,740
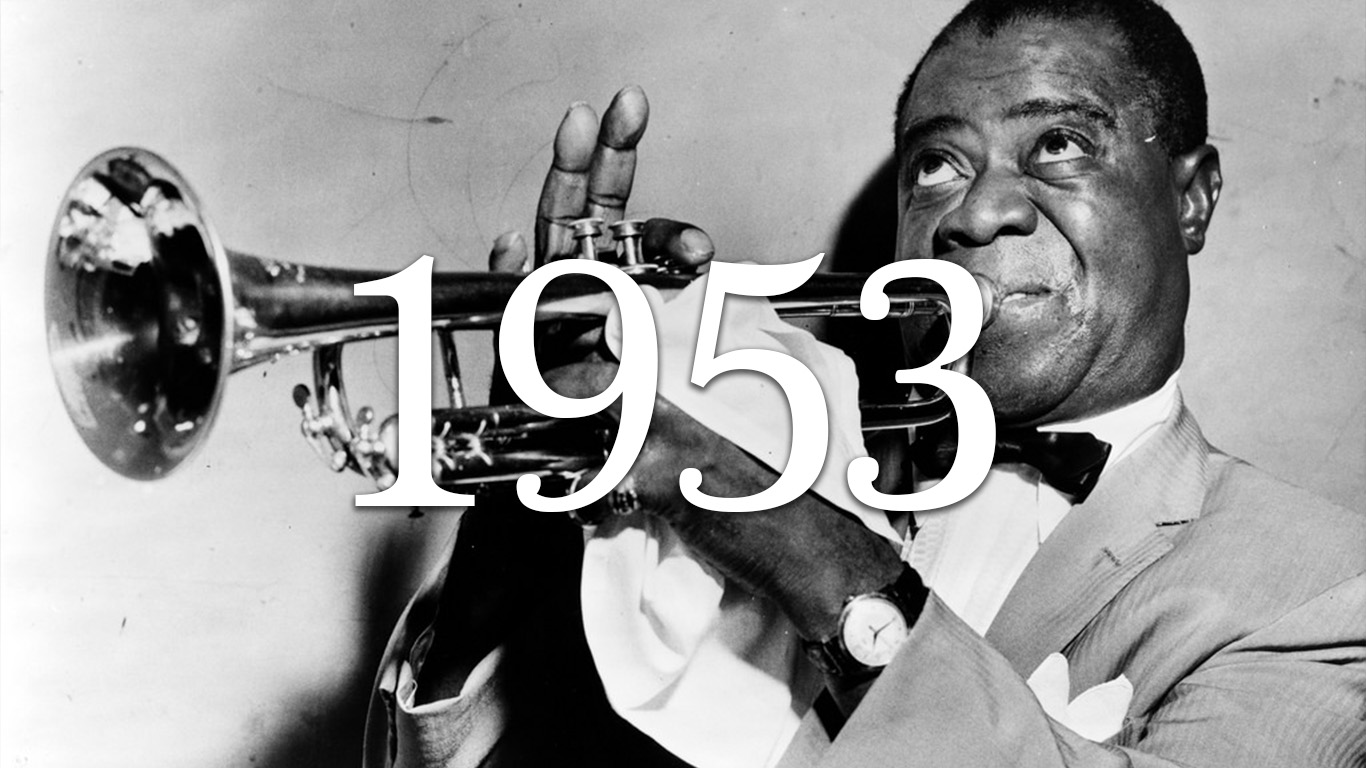
> 68-year-old pop., 2021:
> People born in 1953 still alive today: 76.2%
> Births in 1953: 3,959,000
> U.S. population, 1953: 160,184,192
[in-text-ad-2]
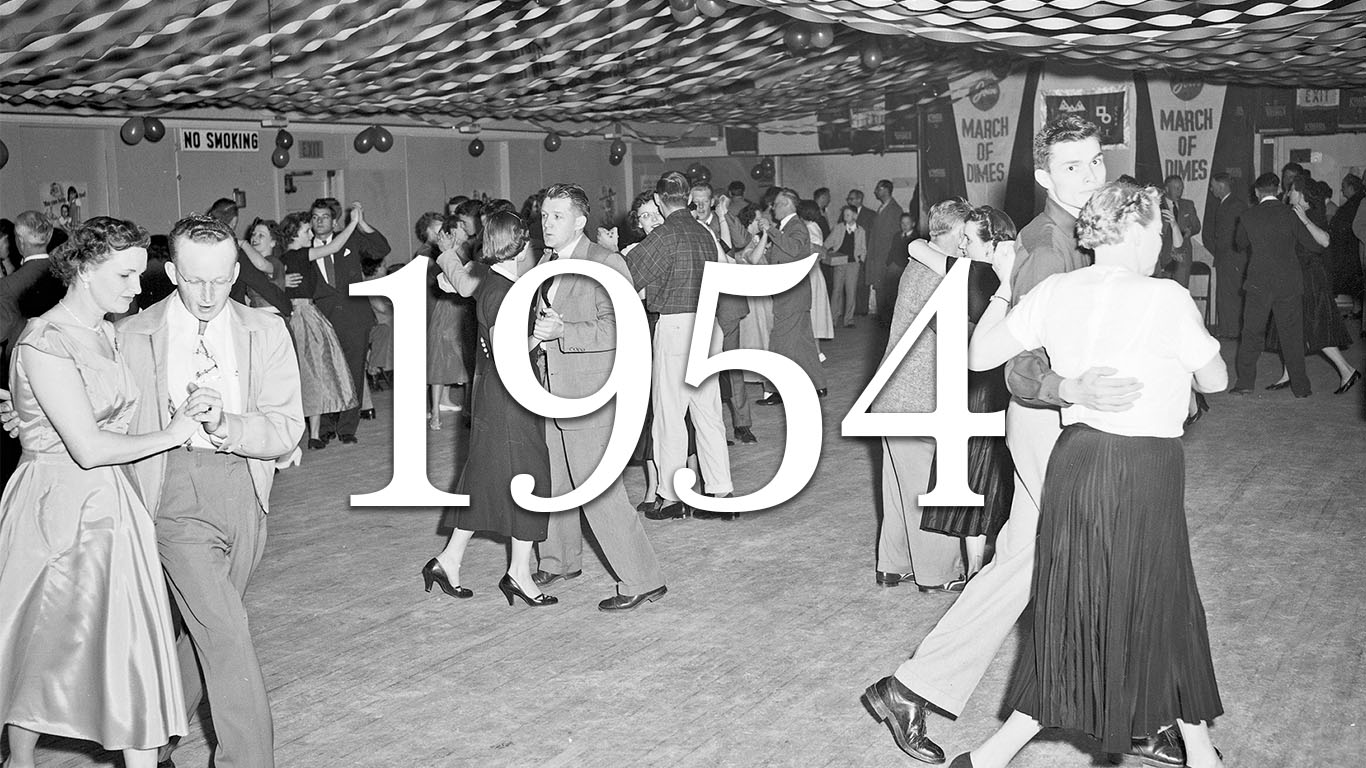
> 67-year-old pop., 2021:
> People born in 1954 still alive today: 77.3%
> Births in 1954: 4,071,000
> U.S. population, 1954: 163,025,854

> 66-year-old pop., 2021:
> People born in 1955 still alive today: 80.2%
> Births in 1955: 4,097,000
> U.S. population, 1955: 165,931,202
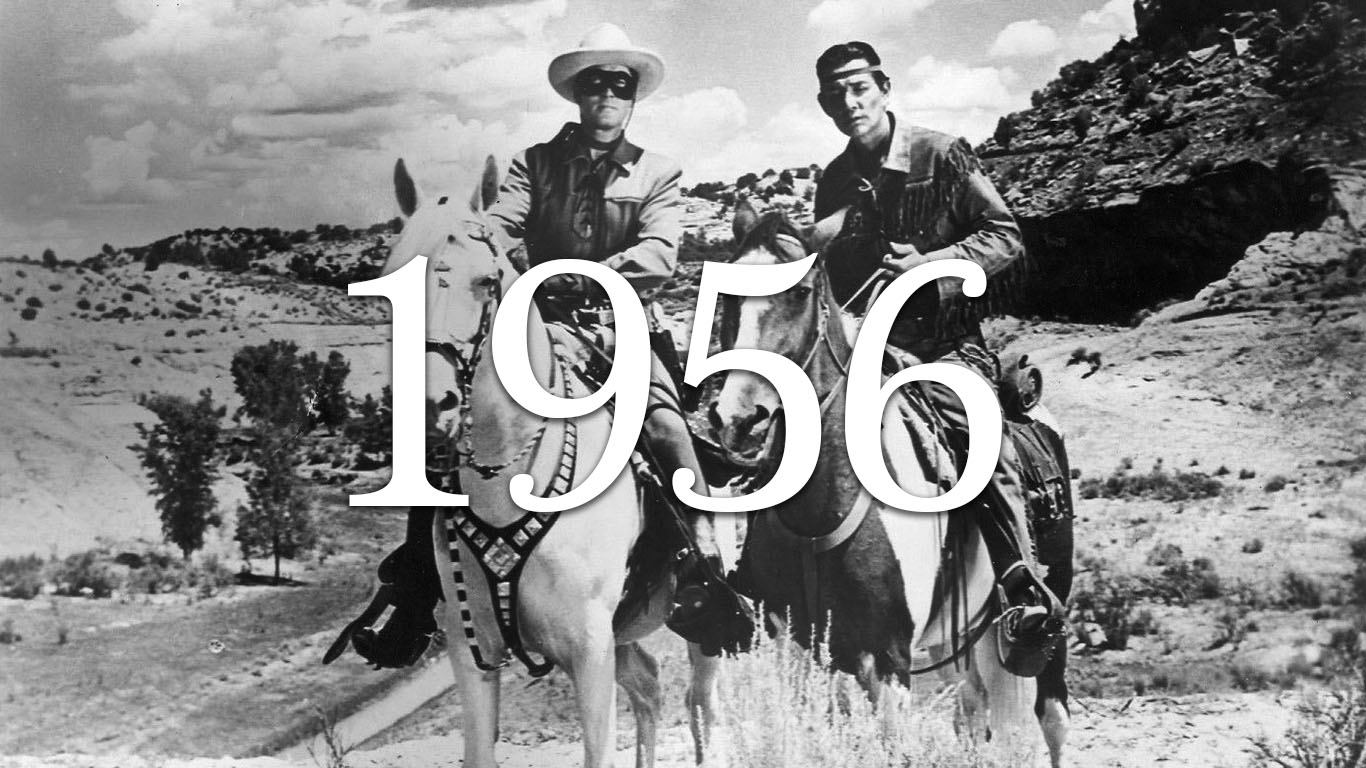
> 65-year-old pop., 2021:
> People born in 1956 still alive today: 78.9%
> Births in 1956: 4,210,000
> U.S. population, 1956: 168,903,031
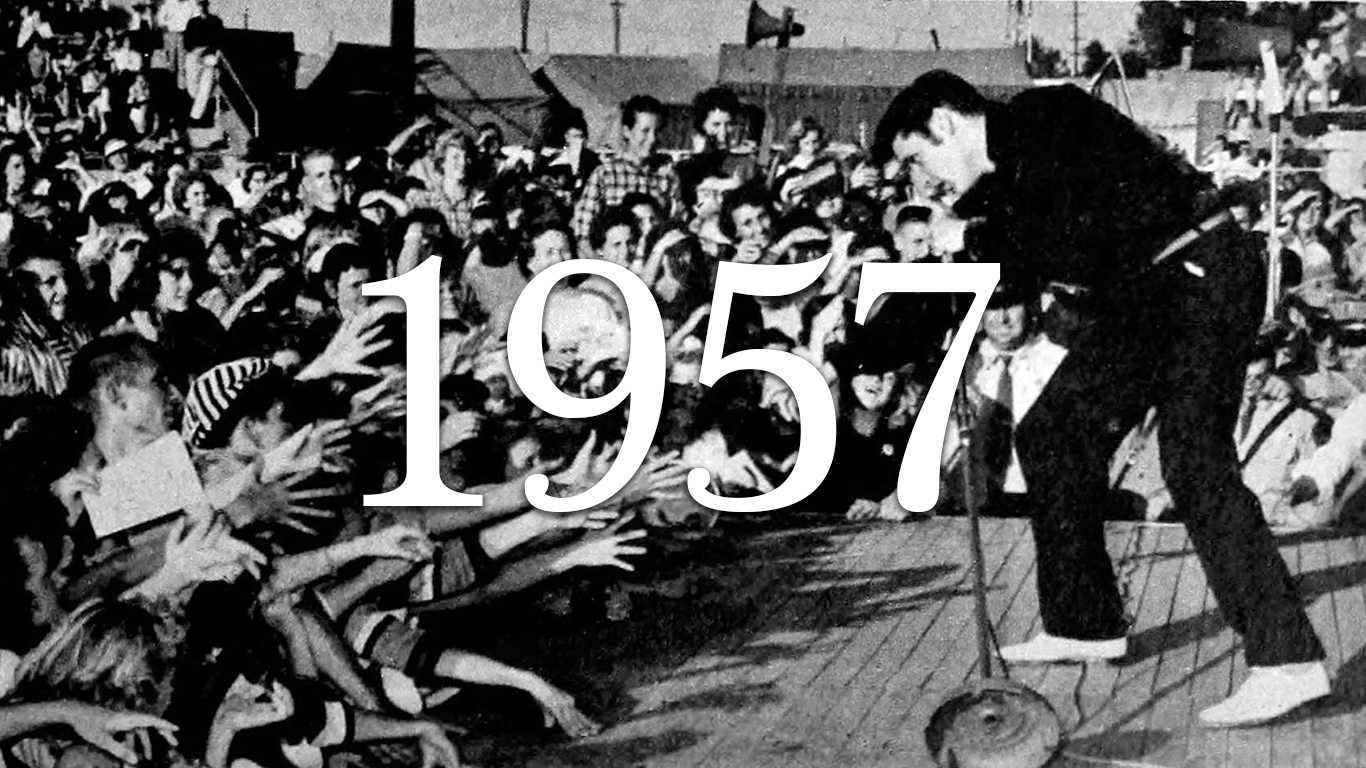
> 64-year-old pop., 2021:
> People born in 1957 still alive today: 80.5%
> Births in 1957: 4,300,000
> U.S. population, 1957: 171,984,130
[in-text-ad]
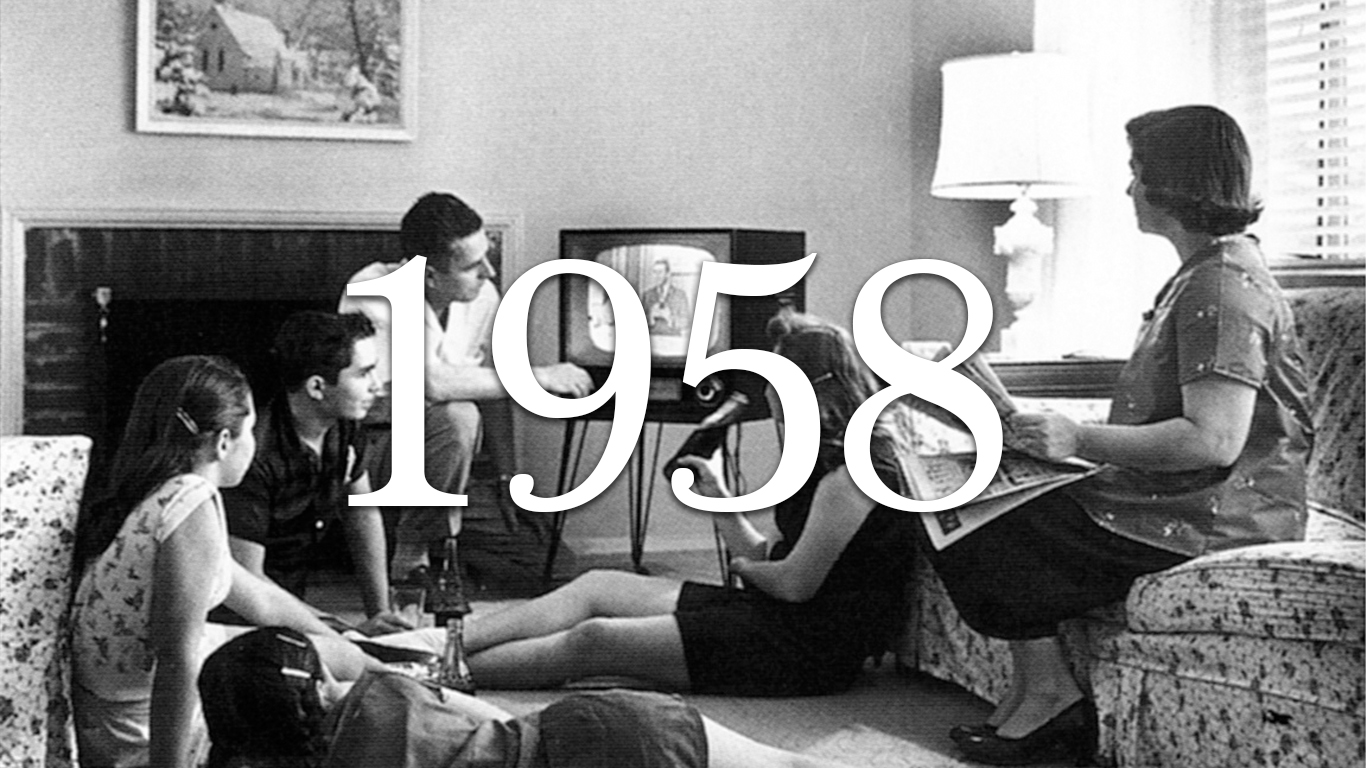
> 63-year-old pop., 2021:
> People born in 1958 still alive today: 82.5%
> Births in 1958: 4,246,000
> U.S. population, 1958: 174,881,904

> 62-year-old pop., 2021:
> People born in 1959 still alive today: 82.9%
> Births in 1959: 4,244,796
> U.S. population, 1959: 177,829,628
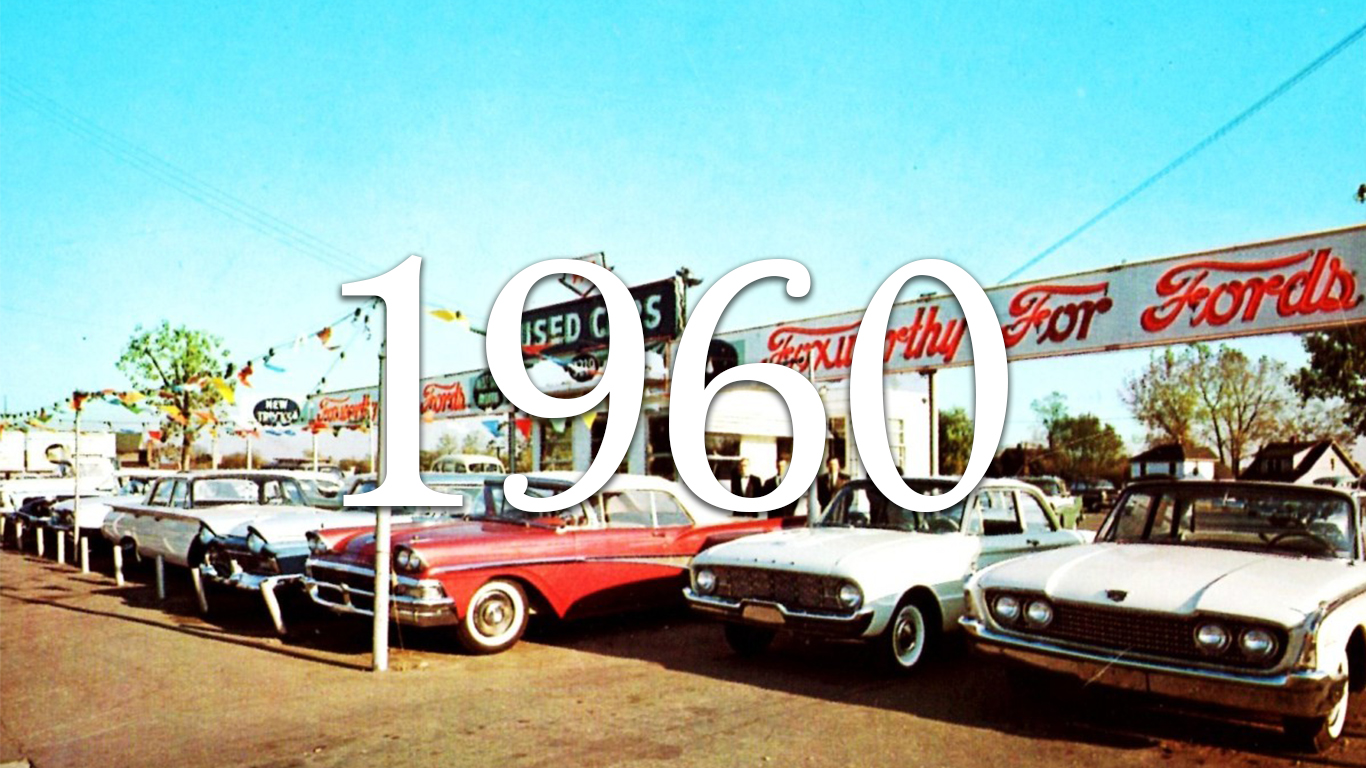
> 61-year-old pop., 2021:
> People born in 1960 still alive today: 85.3%
> Births in 1960: 4,257,850
> U.S. population, 1960: 180,671,158
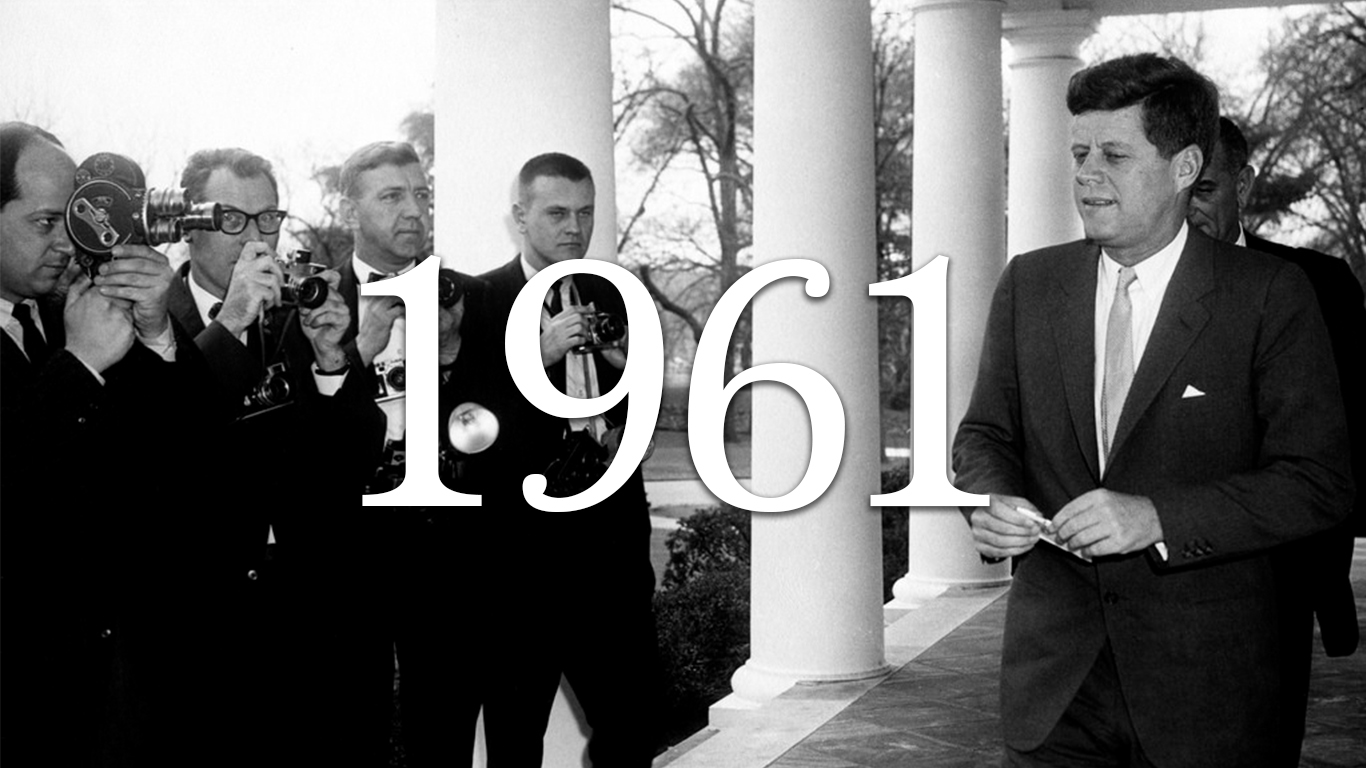
> 60-year-old pop., 2021:
> People born in 1961 still alive today: 84.7%
> Births in 1961: 4,268,326
> U.S. population, 1961: 183,691,481

> 59-year-old pop., 2021:
> People born in 1962 still alive today: 85.3%
> Births in 1962: 4,167,362
> U.S. population, 1962: 186,537,737
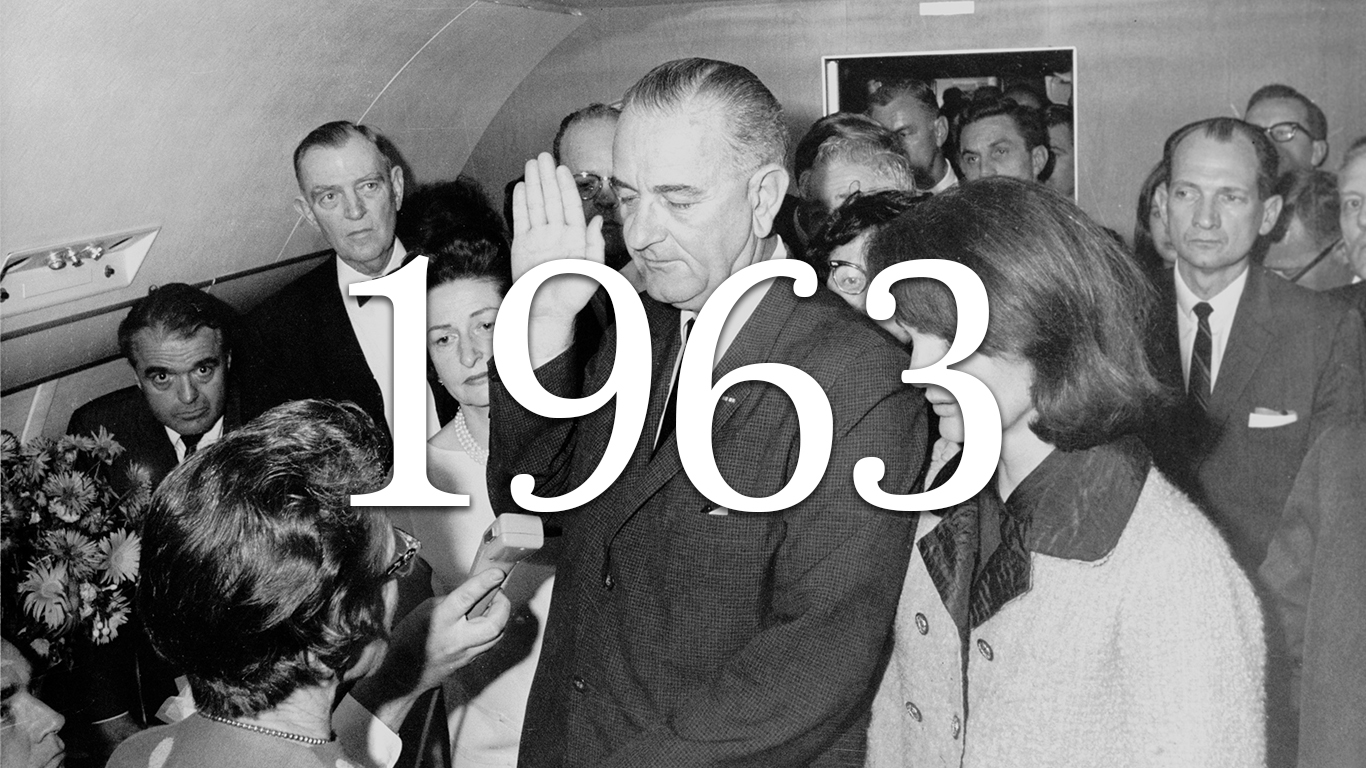
> 58-year-old pop., 2021:
> People born in 1963 still alive today: 86.4%
> Births in 1963: 4,098,020
> U.S. population, 1963: 189,241,798
[in-text-ad-2]
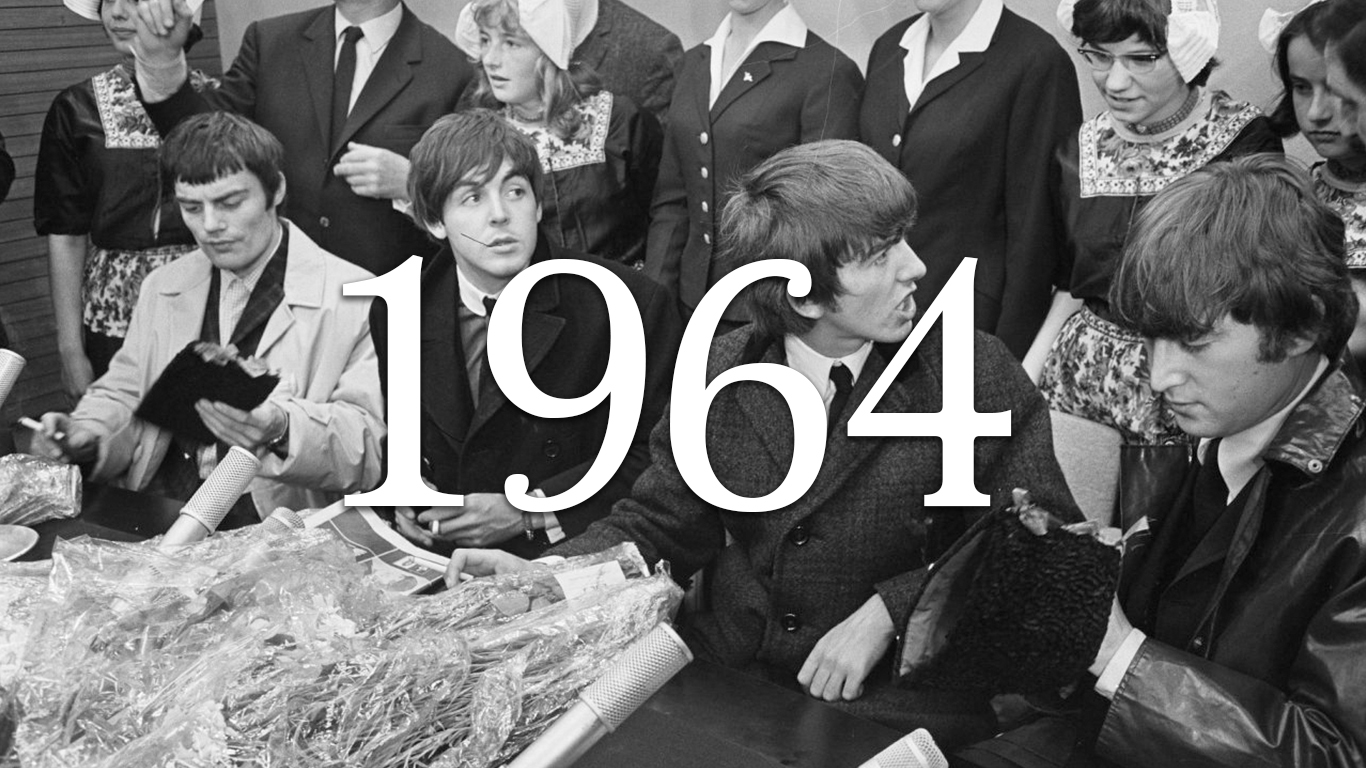
> 57-year-old pop., 2021:
> People born in 1964 still alive today: 87.8%
> Births in 1964: 4,027,490
> U.S. population, 1964: 191,888,791

> 56-year-old pop., 2021:
> People born in 1965 still alive today: 91.9%
> Births in 1965: 3,760,358
> U.S. population, 1965: 194,302,963
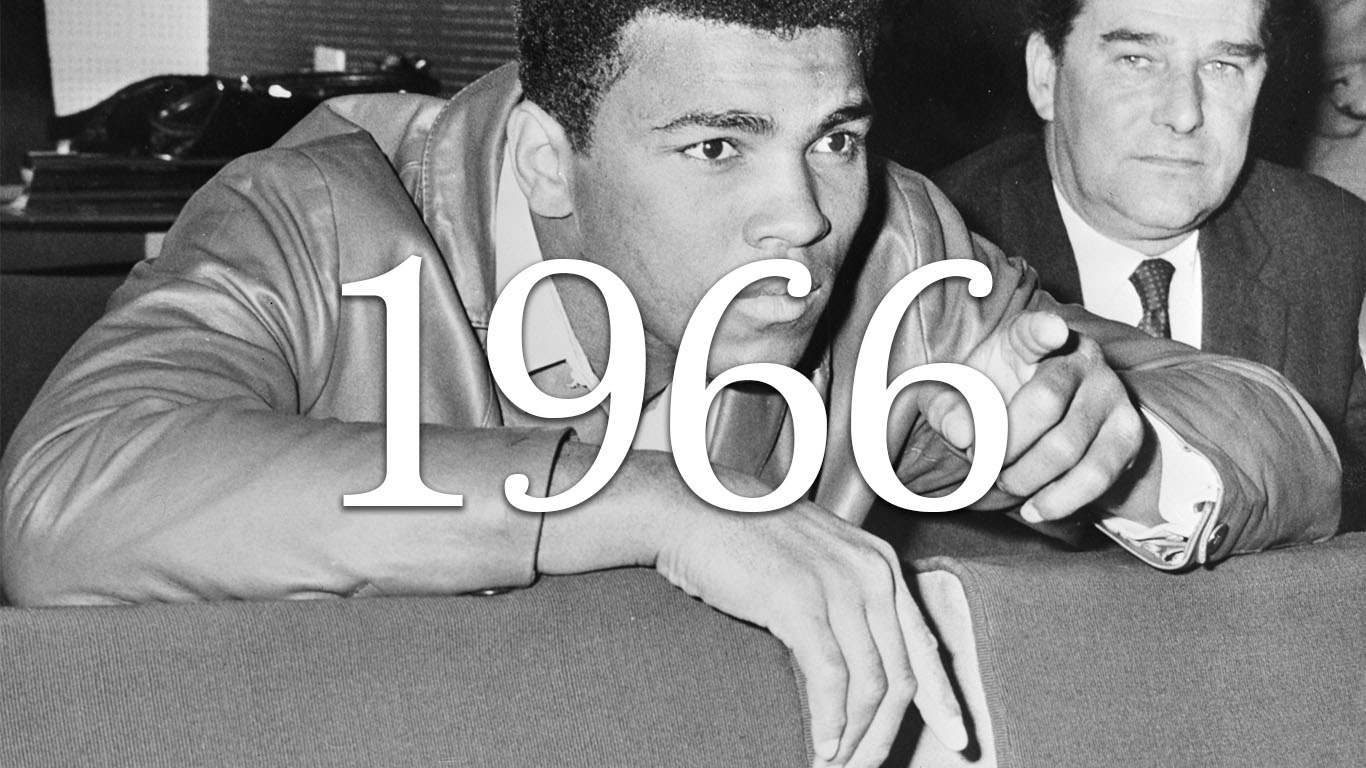
> 55-year-old pop., 2021:
> People born in 1966 still alive today: 89.8%
> Births in 1966: 3,606,274
> U.S. population, 1966: 196,560,338
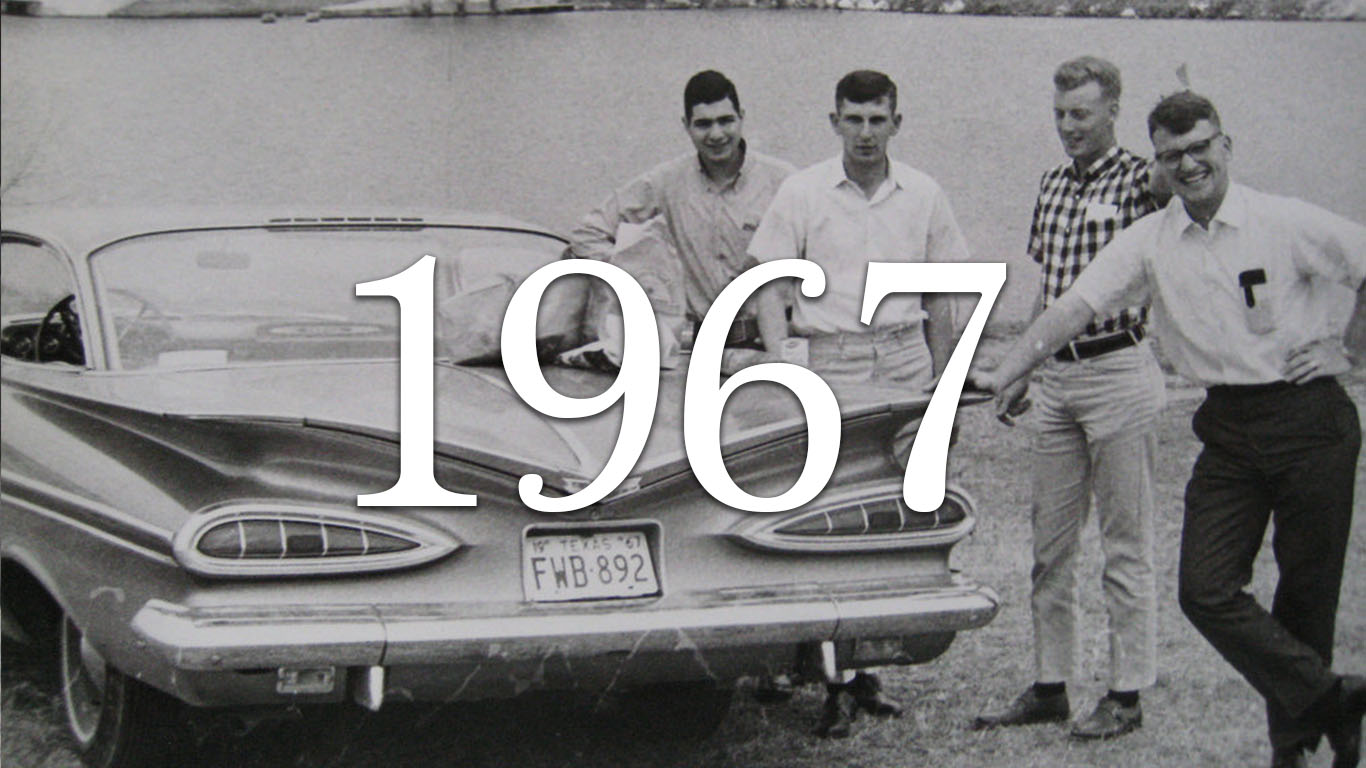
> 54-year-old pop., 2021:
> People born in 1967 still alive today: 90.2%
> Births in 1967: 3,520,959
> U.S. population, 1967: 198,712,056
[in-text-ad]

> 53-year-old pop., 2021:
> People born in 1968 still alive today: 89.8%
> Births in 1968: 3,501,564
> U.S. population, 1968: 200,706,052
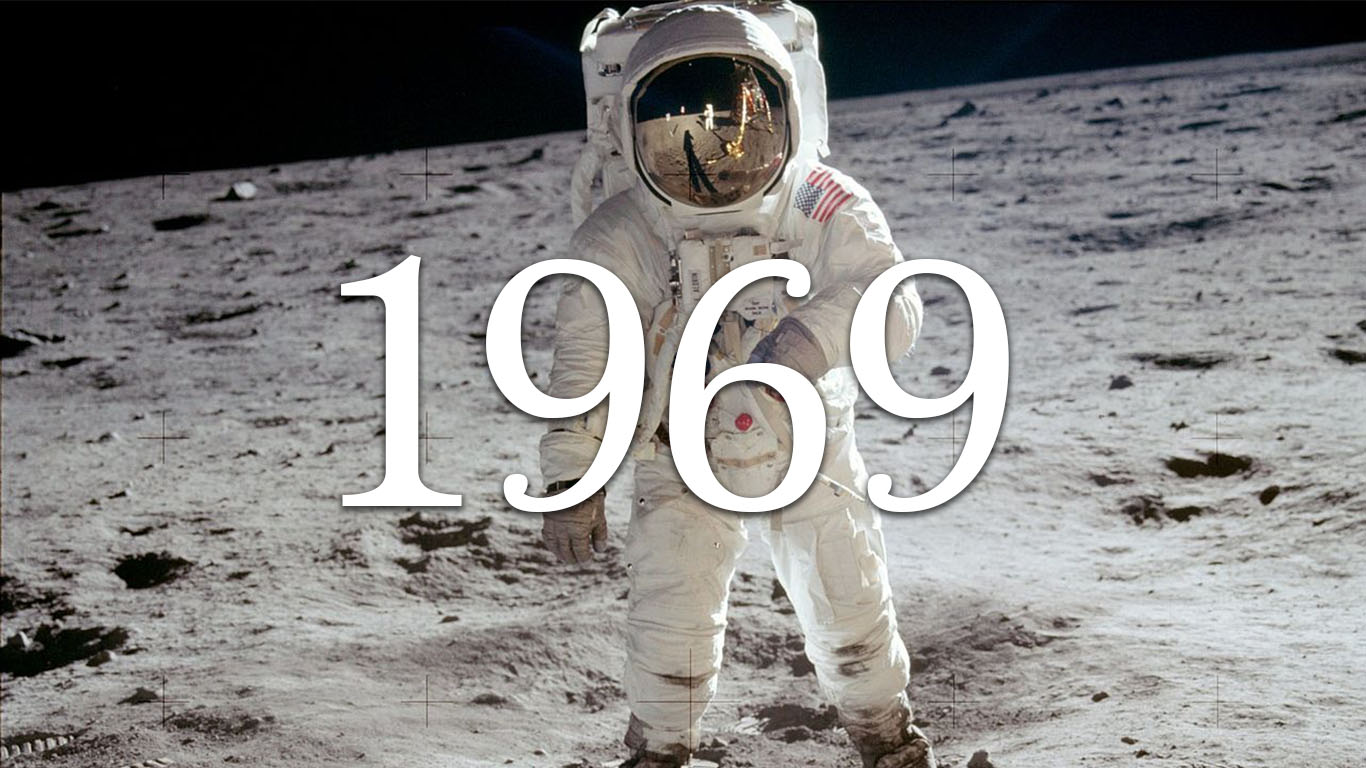
> 52-year-old pop., 2021:
> People born in 1969 still alive today: 89.2%
> Births in 1969: 3,600,206
> U.S. population, 1969: 202,676,946
> 51-year-old pop., 2021:
> People born in 1970 still alive today: 90.8%
> Births in 1970: 3,731,386
> U.S. population, 1970: 205,052,174

> 50-year-old pop., 2021:
> People born in 1971 still alive today: 94.1%
> Births in 1971: 3,555,970
> U.S. population, 1971: 207,660,677
> 49-year-old pop., 2021:
> People born in 1972 still alive today: 96.1%
> Births in 1972: 3,258,411
> U.S. population, 1972: 209,896,021

> 48-year-old pop., 2021:
> People born in 1973 still alive today: 94.8%
> Births in 1973: 3,136,965
> U.S. population, 1973: 211,908,788
[in-text-ad-2]

> 47-year-old pop., 2021:
> People born in 1974 still alive today: 92.6%
> Births in 1974: 3,159,958
> U.S. population, 1974: 213,853,928
> 46-year-old pop., 2021:
> People born in 1975 still alive today: 96.4%
> Births in 1975: 3,144,198
> U.S. population, 1975: 215,973,199

> 45-year-old pop., 2021:
> People born in 1976 still alive today: 93.0%
> Births in 1976: 3,167,788
> U.S. population, 1976: 218,035,164
> 44-year-old pop., 2021:
> People born in 1977 still alive today: 92.1%
> Births in 1977: 3,326,632
> U.S. population, 1977: 220,239,425
[in-text-ad]

> 43-year-old pop., 2021:
> People born in 1978 still alive today: 93.5%
> Births in 1978: 3,333,279
> U.S. population, 1978: 222,584,545
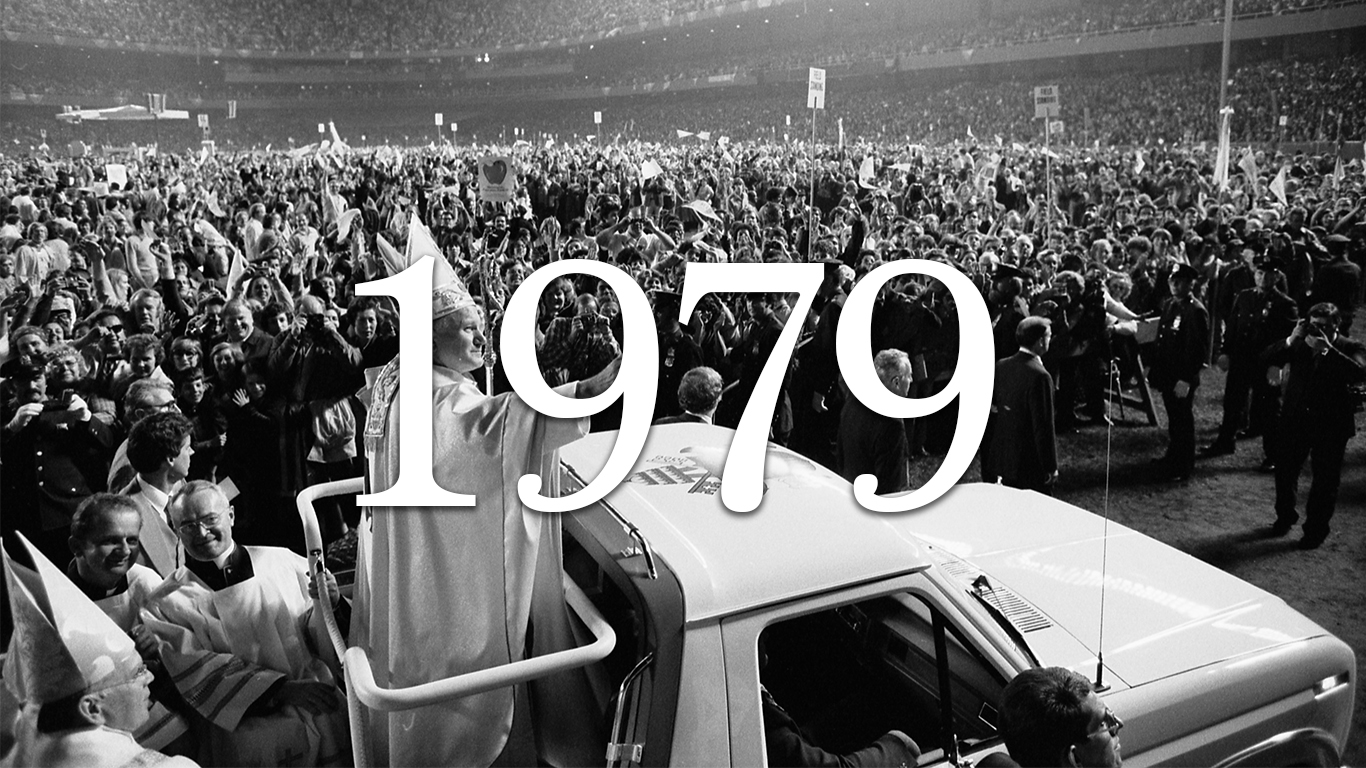
> 42-year-old pop., 2021:
> People born in 1979 still alive today: 91.6%
> Births in 1979: 3,494,398
> U.S. population, 1979: 225,055,487
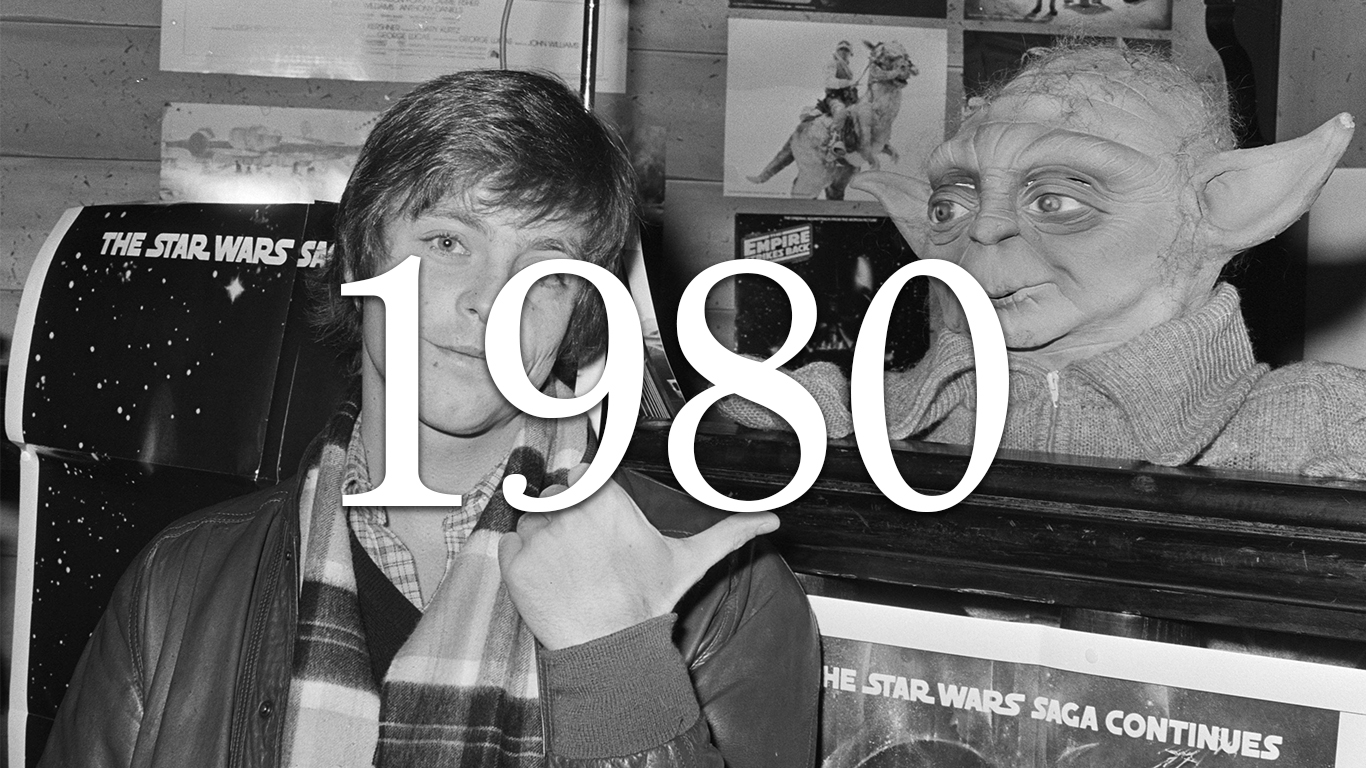
> 41-year-old pop., 2021:
> People born in 1980 still alive today: 95.0%
> Births in 1980: 3,612,258
> U.S. population, 1980: 227,224,681

> 40-year-old pop., 2021:
> People born in 1981 still alive today: 93.5%
> Births in 1981: 3,629,238
> U.S. population, 1981: 229,465,714

> 39-year-old pop., 2021:
> People born in 1982 still alive today: 93.7%
> Births in 1982: 3,680,537
> U.S. population, 1982: 231,664,458
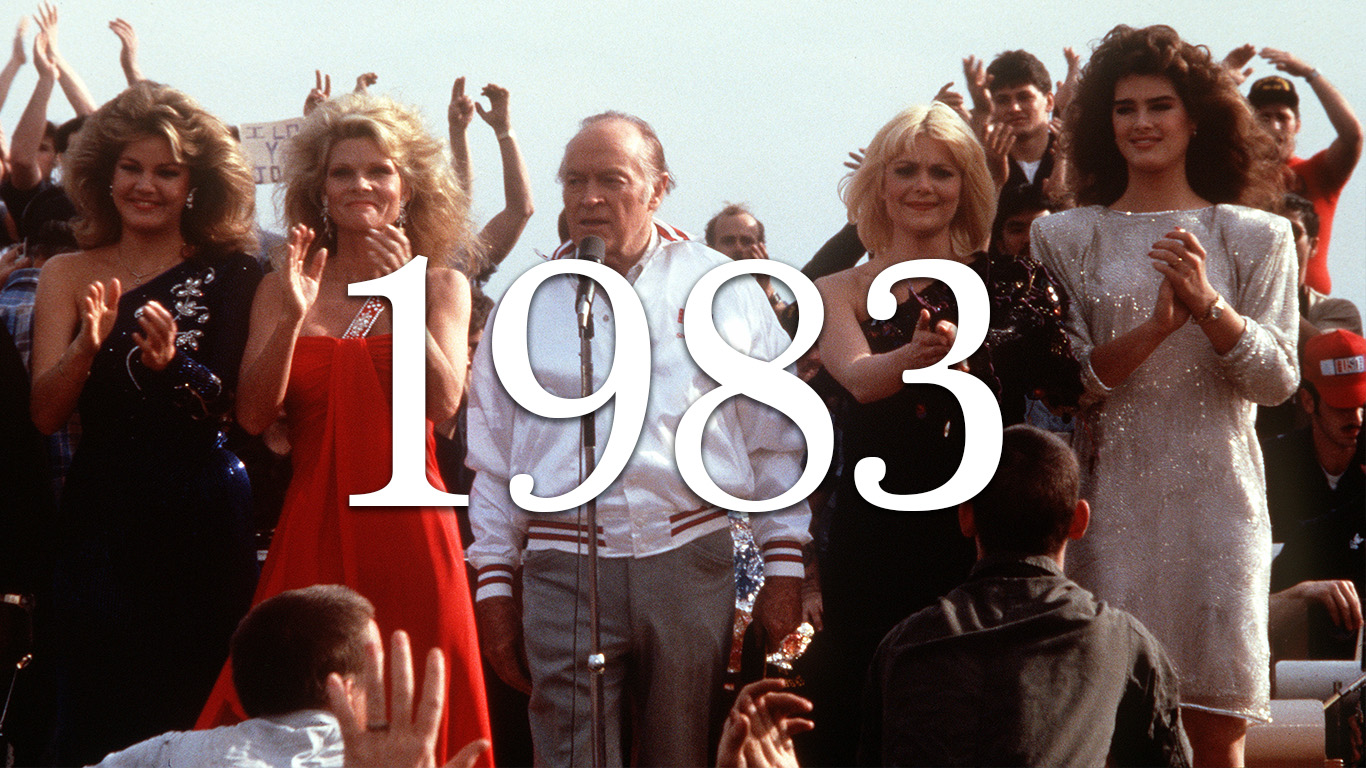
> 38-year-old pop., 2021:
> People born in 1983 still alive today: 95.7%
> Births in 1983: 3,638,933
> U.S. population, 1983: 233,791,994
[in-text-ad-2]
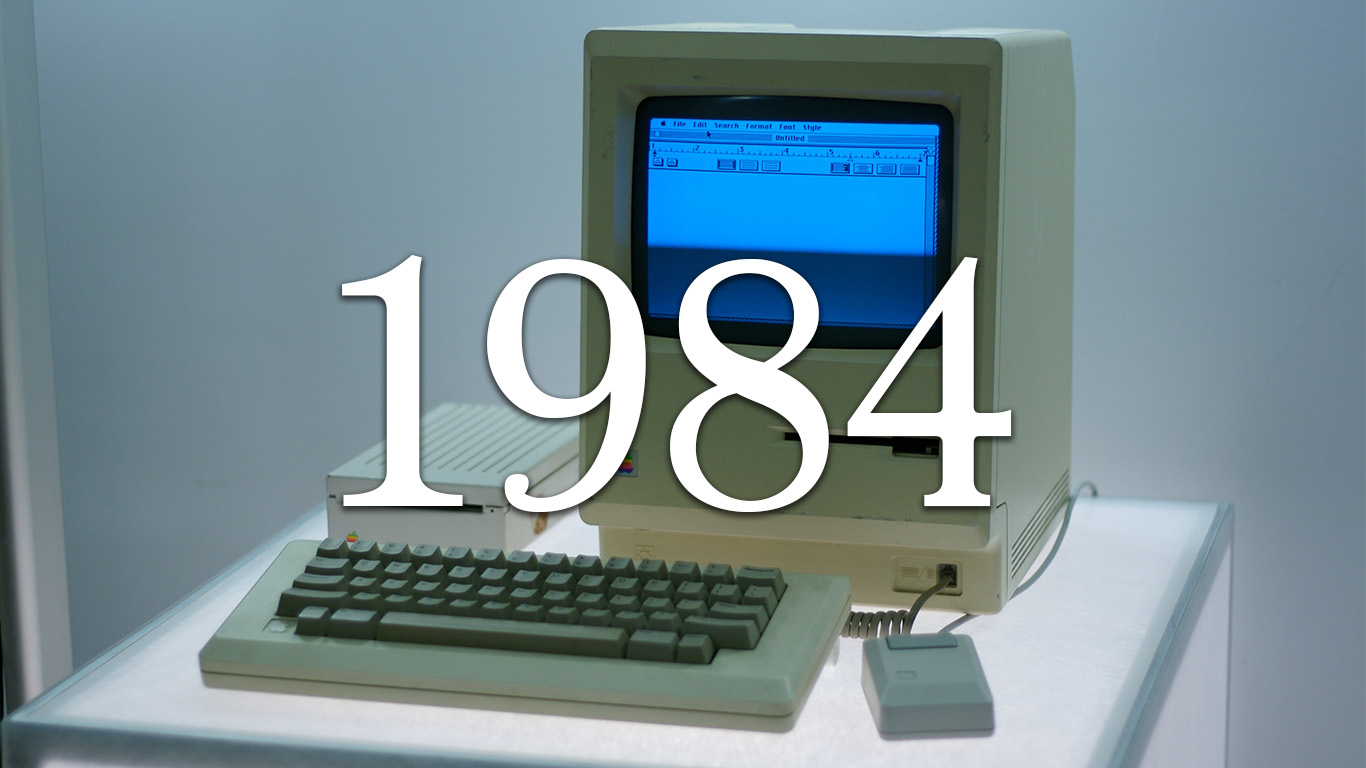
> 37-year-old pop., 2021:
> People born in 1984 still alive today: 94.2%
> Births in 1984: 3,669,141
> U.S. population, 1984: 235,824,902

> 36-year-old pop., 2021:
> People born in 1985 still alive today: 95.9%
> Births in 1985: 3,760,561
> U.S. population, 1985: 237,923,795

> 35-year-old pop., 2021:
> People born in 1986 still alive today: 96.2%
> Births in 1986: 3,756,547
> U.S. population, 1986: 240,132,887

> 34-year-old pop., 2021:
> People born in 1987 still alive today: 95.4%
> Births in 1987: 3,809,394
> U.S. population, 1987: 242,288,918
[in-text-ad]

> 33-year-old pop., 2021:
> People born in 1988 still alive today: 95.5%
> Births in 1988: 3,909,510
> U.S. population, 1988: 244,498,982
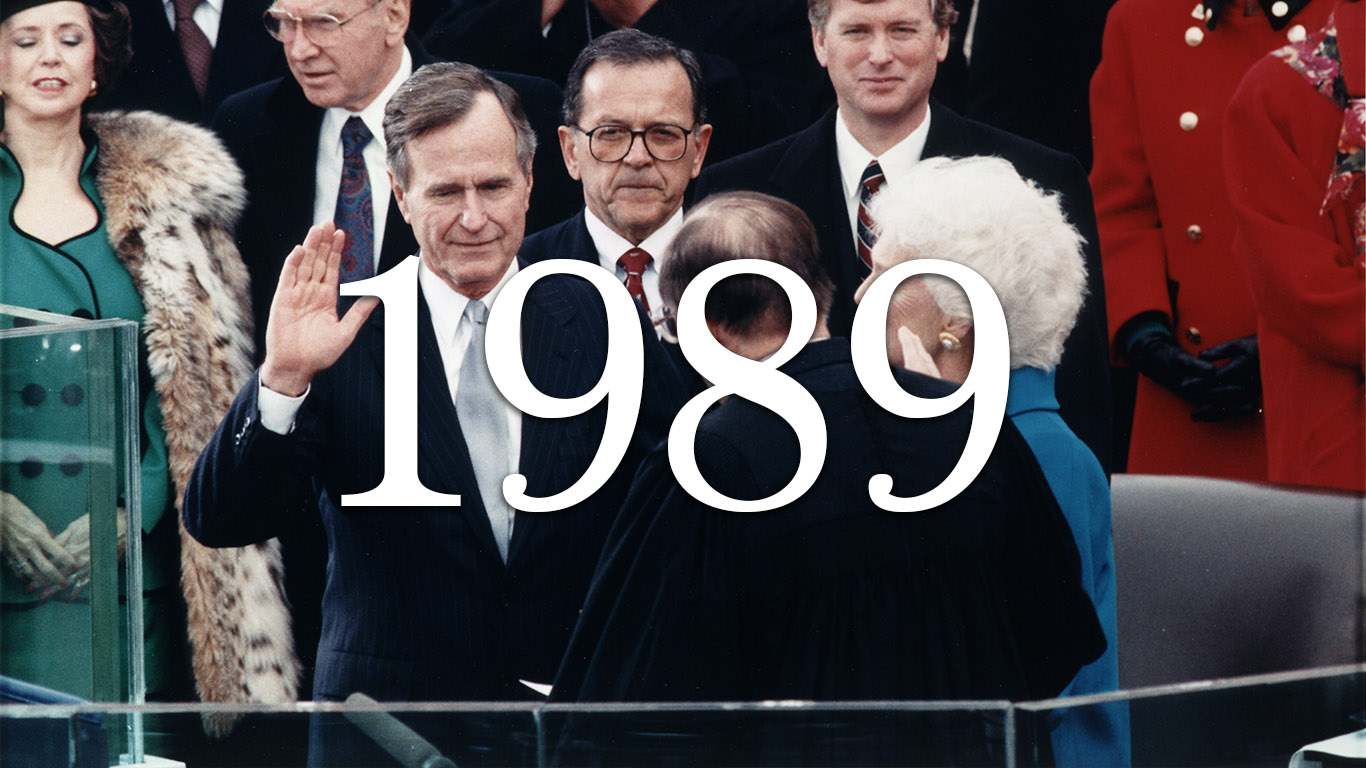
> 32-year-old pop., 2021:
> People born in 1989 still alive today: 95.5%
> Births in 1989: 4,040,958
> U.S. population, 1989: 246,819,230

> 31-year-old pop., 2021:
> People born in 1990 still alive today: 97.6%
> Births in 1990: 4,158,212
> U.S. population, 1990: 249,464,396

> 30-year-old pop., 2021:
> People born in 1991 still alive today: 99.9%
> Births in 1991: 4,110,907
> U.S. population, 1991: 252,153,092
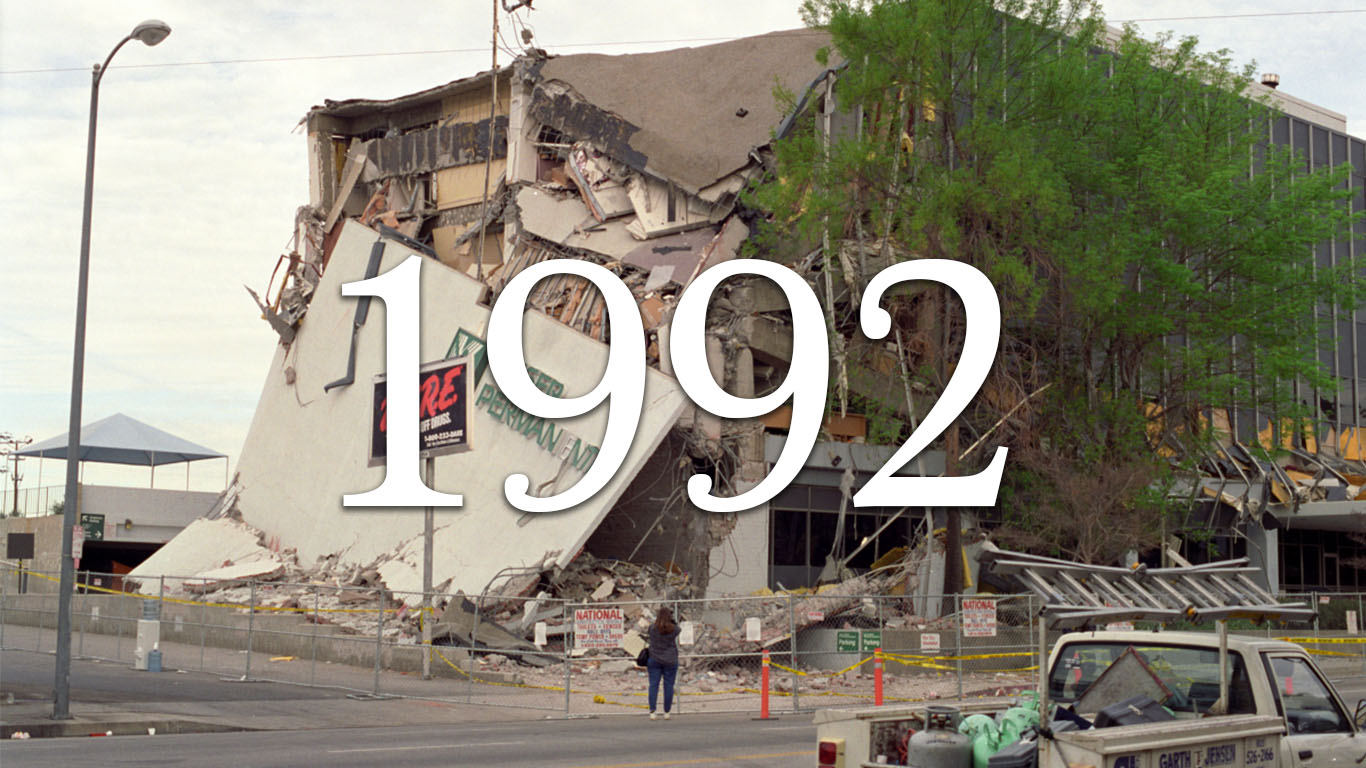
> 29-year-old pop., 2021:
> People born in 1992 still alive today: 99.9%
> Births in 1992: 4,065,014
> U.S. population, 1992: 255,029,699

> 28-year-old pop., 2021:
> People born in 1993 still alive today: 99.9%
> Births in 1993: 4,000,240
> U.S. population, 1993: 257,782,608
[in-text-ad-2]
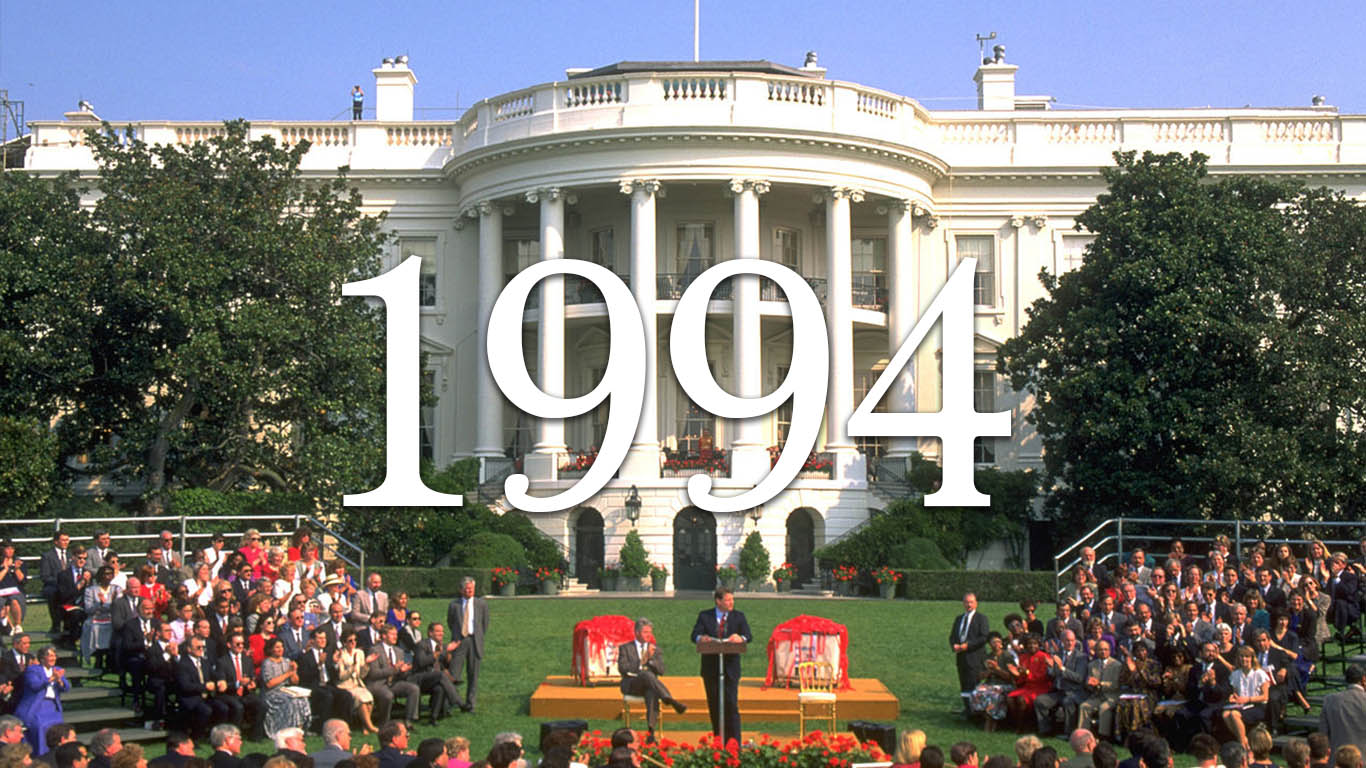
> 27-year-old pop., 2021:
> People born in 1994 still alive today: 99.9%
> Births in 1994: 3,952,767
> U.S. population, 1994: 260,327,021

> 26-year-old pop., 2021:
> People born in 1995 still alive today: 99.9%
> Births in 1995: 3,899,589
> U.S. population, 1995: 262,803,276
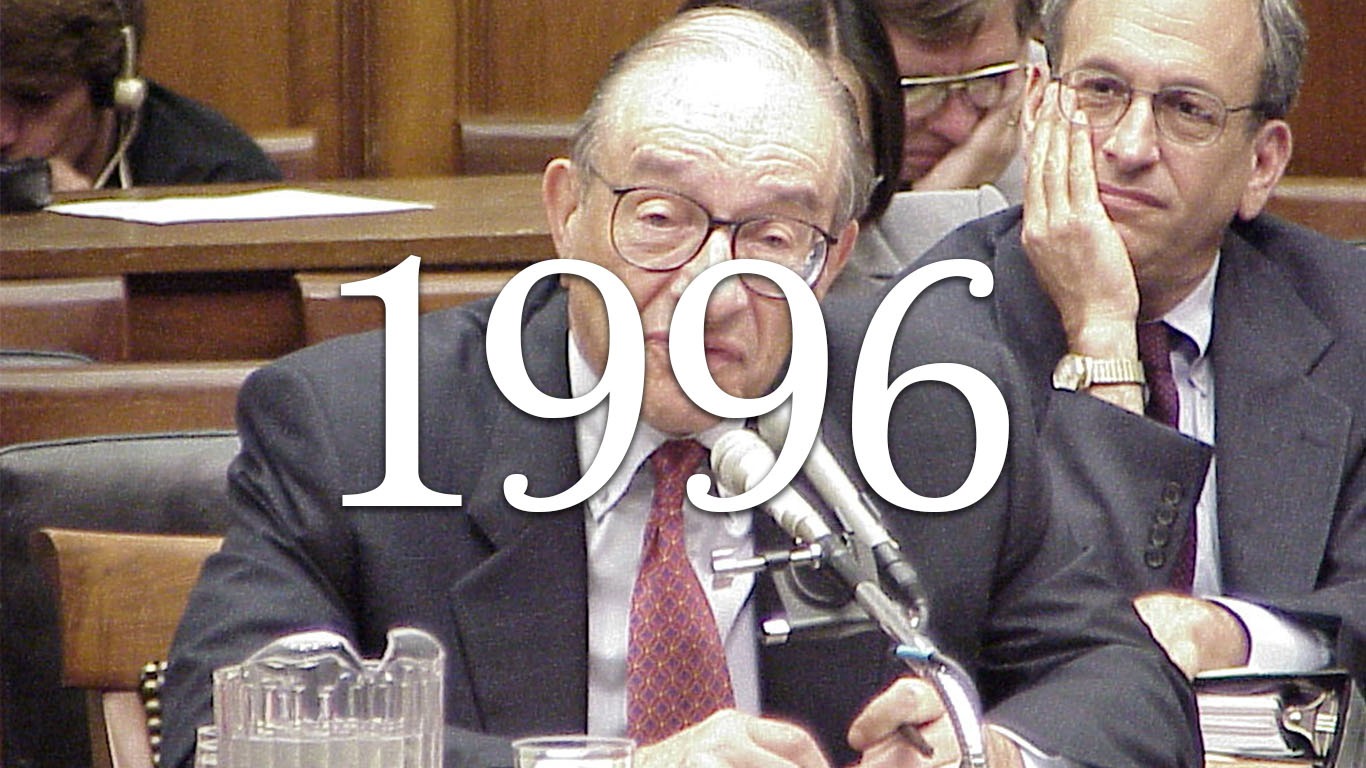
> 25-year-old pop., 2021:
> People born in 1996 still alive today: 99.2%
> Births in 1996: 3,891,494
> U.S. population, 1996: 265,228,572

> 24-year-old pop., 2021:
> People born in 1997 still alive today: 99.3%
> Births in 1997: 3,880,894
> U.S. population, 1997: 267,783,607
[in-text-ad]

> 23-year-old pop., 2021:
> People born in 1998 still alive today: 98.1%
> Births in 1998: 3,941,553
> U.S. population, 1998: 270,248,003

> 22-year-old pop., 2021:
> People born in 1999 still alive today: 98.1%
> Births in 1999: 3,959,417
> U.S. population, 1999: 272,690,813

> 21-year-old pop., 2021:
> People born in 2000 still alive today: 97.7%
> Births in 2000: 4,058,814
> U.S. population, 2000: 282,162,411

> 20-year-old pop., 2021:
> People born in 2001 still alive today: 97.5%
> Births in 2001: 4,025,933
> U.S. population, 2001: 284,968,955

> 19-year-old pop., 2021:
> People born in 2002 still alive today: 95.7%
> Births in 2002: 4,021,726
> U.S. population, 2002: 287,625,193

> 18-year-old pop., 2021:
> People born in 2003 still alive today: 95.0%
> Births in 2003: 4,089,950
> U.S. population, 2003: 290,107,933
[in-text-ad-2]

> 17-year-old pop., 2021:
> People born in 2004 still alive today: 95.6%
> Births in 2004: 4,112,052
> U.S. population, 2004: 292,805,298
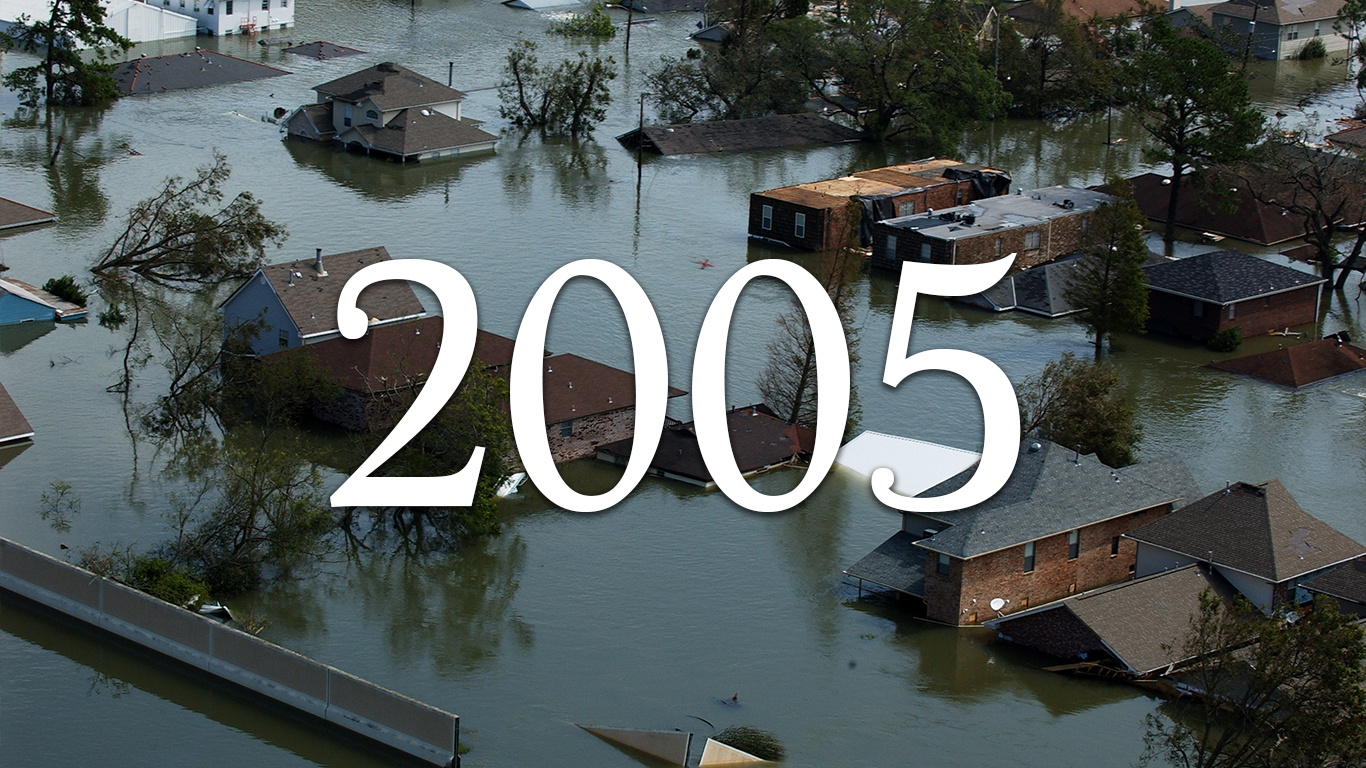
> 16-year-old pop., 2021:
> People born in 2005 still alive today: 95.3%
> Births in 2005: 4,138,349
> U.S. population, 2005: 295,516,599

> 15-year-old pop., 2021:
> People born in 2006 still alive today: 93.1%
> Births in 2006: 4,265,555
> U.S. population, 2006: 298,379,912

> 14-year-old pop., 2021:
> People born in 2007 still alive today: 93.2%
> Births in 2007: 4,316,233
> U.S. population, 2007: 301,231,207
[in-text-ad]
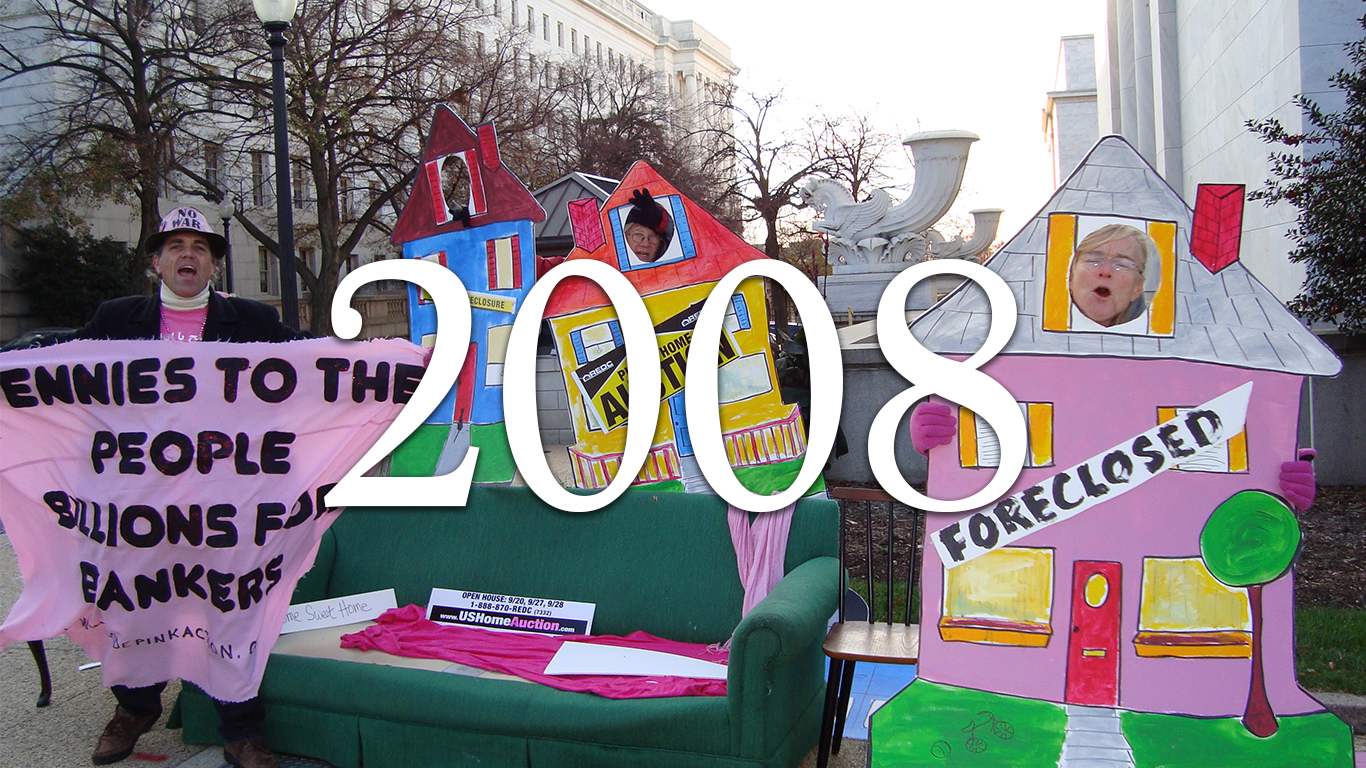
> 13-year-old pop., 2021:
> People born in 2008 still alive today: 94.6%
> Births in 2008: 4,247,694
> U.S. population, 2008: 304,093,966

> 12-year-old pop., 2021:
> People born in 2009 still alive today: 94.6%
> Births in 2009: 4,130,665
> U.S. population, 2009: 306,771,529

> 11-year-old pop., 2021:
> People born in 2010 still alive today: 98.0%
> Births in 2010: 3,999,386
> U.S. population, 2010: 309,346,863

> 10-year-old pop., 2021:
> People born in 2011 still alive today: 99.5%
> Births in 2011: 3,953,590
> U.S. population, 2011: 311,718,857
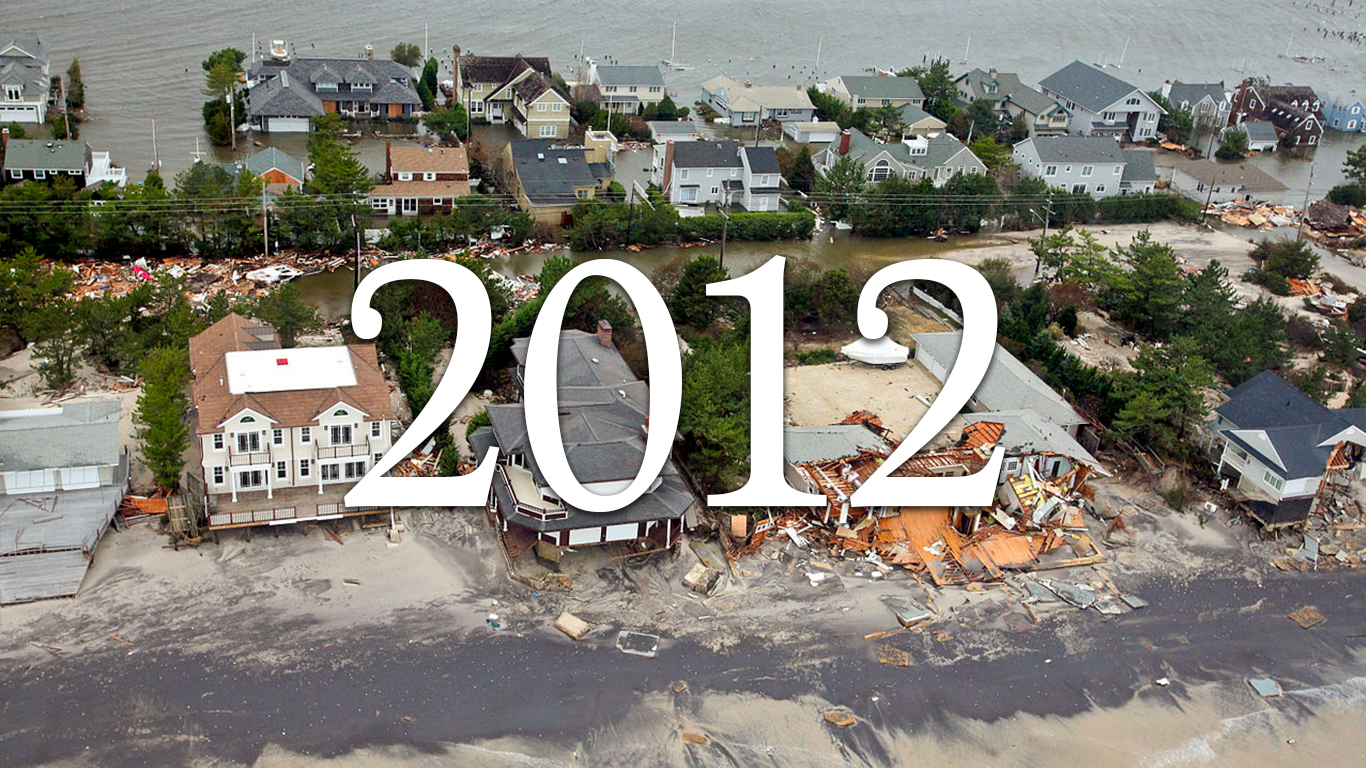
> 9-year-old pop., 2021:
> People born in 2012 still alive today: 98.7%
> Births in 2012: 3,952,841
> U.S. population, 2012: 314,102,623
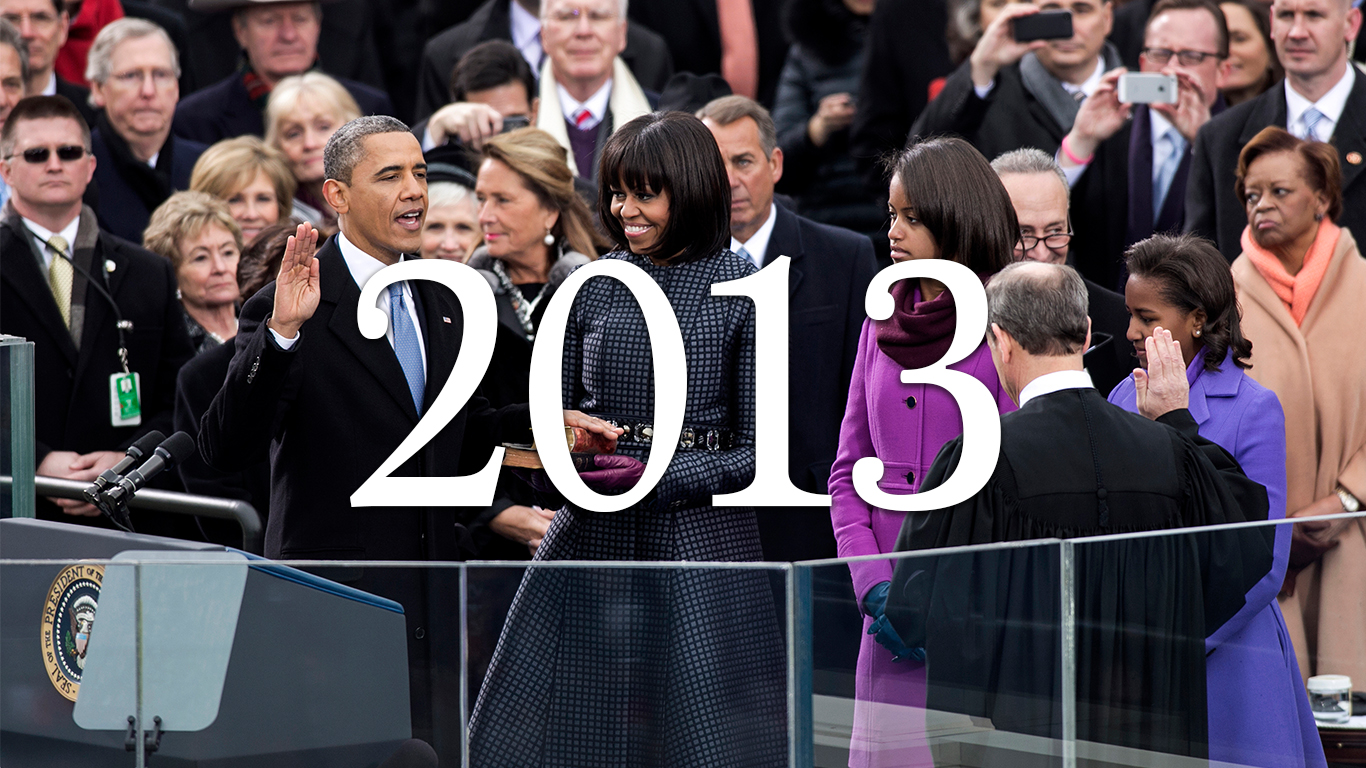
> 8-year-old pop., 2021:
> People born in 2013 still alive today: 99.2%
> Births in 2013: 3,932,181
> U.S. population, 2013: 316,427,395
[in-text-ad-2]

> 7-year-old pop., 2021:
> People born in 2014 still alive today: 98.3%
> Births in 2014: 3,988,076
> U.S. population, 2014: 318,907,401
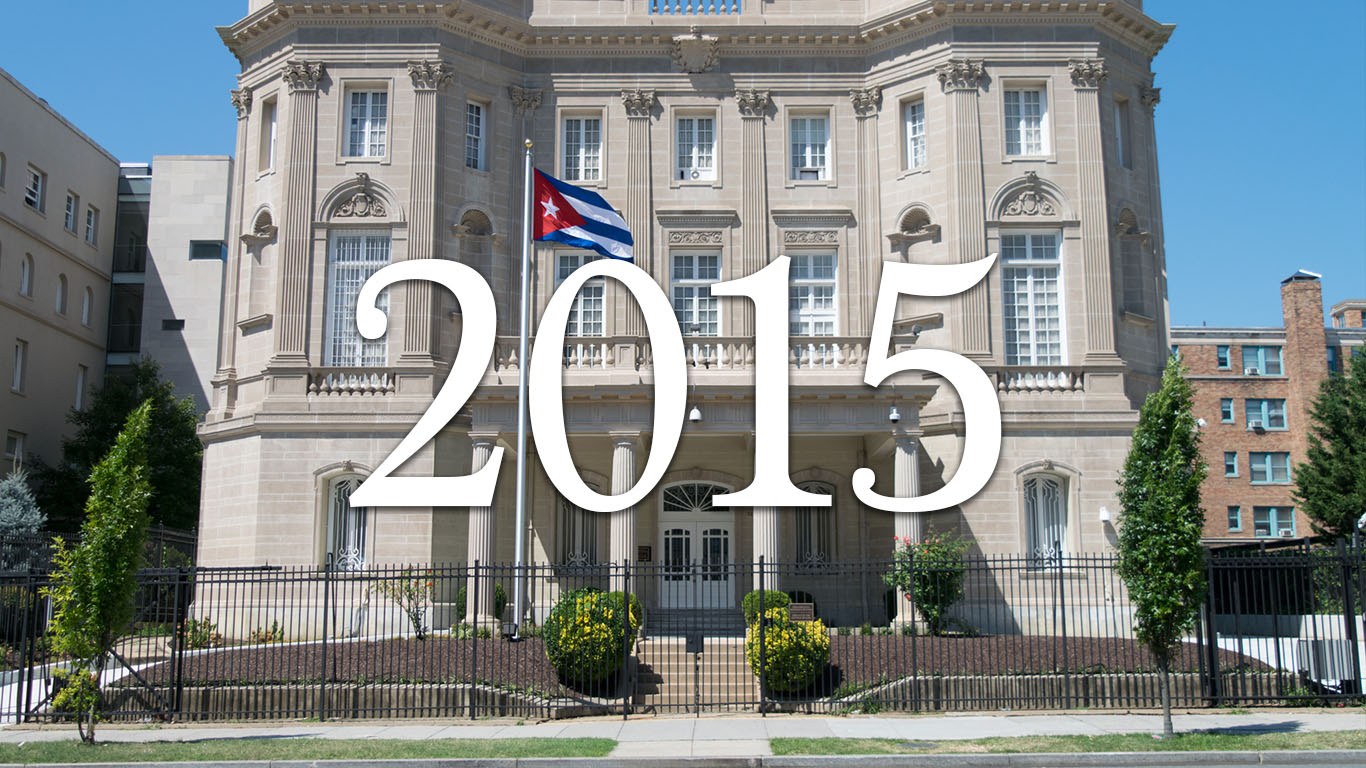
> 6-year-old pop., 2021:
> People born in 2015 still alive today: 98.8%
> Births in 2015: 3,978,497
> U.S. population, 2015: 321,418,820

> 5-year-old pop., 2021:
> People born in 2016 still alive today: 99.2%
> Births in 2016: 3,945,875
> U.S. population, 2016: 323,071,342

> 4-year-old pop., 2021:
> People born in 2017 still alive today: 99.9%
> Births in 2017: 3,855,500
> U.S. population, 2017: 325,147,121
[in-text-ad]

> 3-year-old pop., 2021:
> People born in 2018 still alive today: 99.9%
> Births in 2018: 3,791,712
> U.S. population, 2018: 327,167,439
Credit card companies are at war. The biggest issuers are handing out free rewards and benefits to win the best customers.
It’s possible to find cards paying unlimited 1.5%, 2%, and even more today. That’s free money for qualified borrowers, and the type of thing that would be crazy to pass up. Those rewards can add up to thousands of dollars every year in free money, and include other benefits as well.
We’ve assembled some of the best credit cards for users today. Don’t miss these offers because they won’t be this good forever.
Flywheel Publishing has partnered with CardRatings for our coverage of credit card products. Flywheel Publishing and CardRatings may receive a commission from card issuers.
Thank you for reading! Have some feedback for us?
Contact the 24/7 Wall St. editorial team.