Special Report
Before and After Pictures of the Worst Hurricanes in American History
Published:
Disasters caused by human error — oil spills, bridge collapses, forest fires ignited by a carelessly discarded cigarette — can be devastating, but natural disasters are often even worse. They make us feel helpless in the face of mother nature’s wrath.
Water, in the form of floods and tsunamis, can destroy both life and livelihood. Snow avalanches and mudslides can be an instrument of death and destruction. And earthquakes can wreck cities and their people.
Then there are hurricanes — unpredictable and capricious forces that can assault us in many ways at once, flattening our homes, drowning our crop fields, ripping trees from the ground, robbing us of electricity and drinking water.
A hurricane is a large, swirling tropical storm, with wind speeds than can exceed 150 miles an hour. Either from personal experience or from the visceral imagery provided by national news outlets, most Americans are familiar with the results of these savage tempests: boats overturned and smashed together, cars and trucks picked up and dropped upside down miles away, city streets filled with shattered glass or turned into torrential rivers, rural villages razed into piles of sticks, and so on.
Sometimes, the devastation is so vast that we nearly forget what the places looked like before they were struck by major hurricanes. That is why 24/7 Wall St. has collected before-and-after images depicting the horrific effects of some of the worst hurricanes to strike the United States in recent history. We reviewed information from the National Hurricane Center on 18 major hurricanes since 2000 that caused at least $3 billion in damages.
Regard the peaceful scenes of life in normal weather, then the aftermaths of these violent superstorms, and remember how punishing the natural world can be.
Click here for before and after pictures of the worst hurricanes in American history.
Before
After
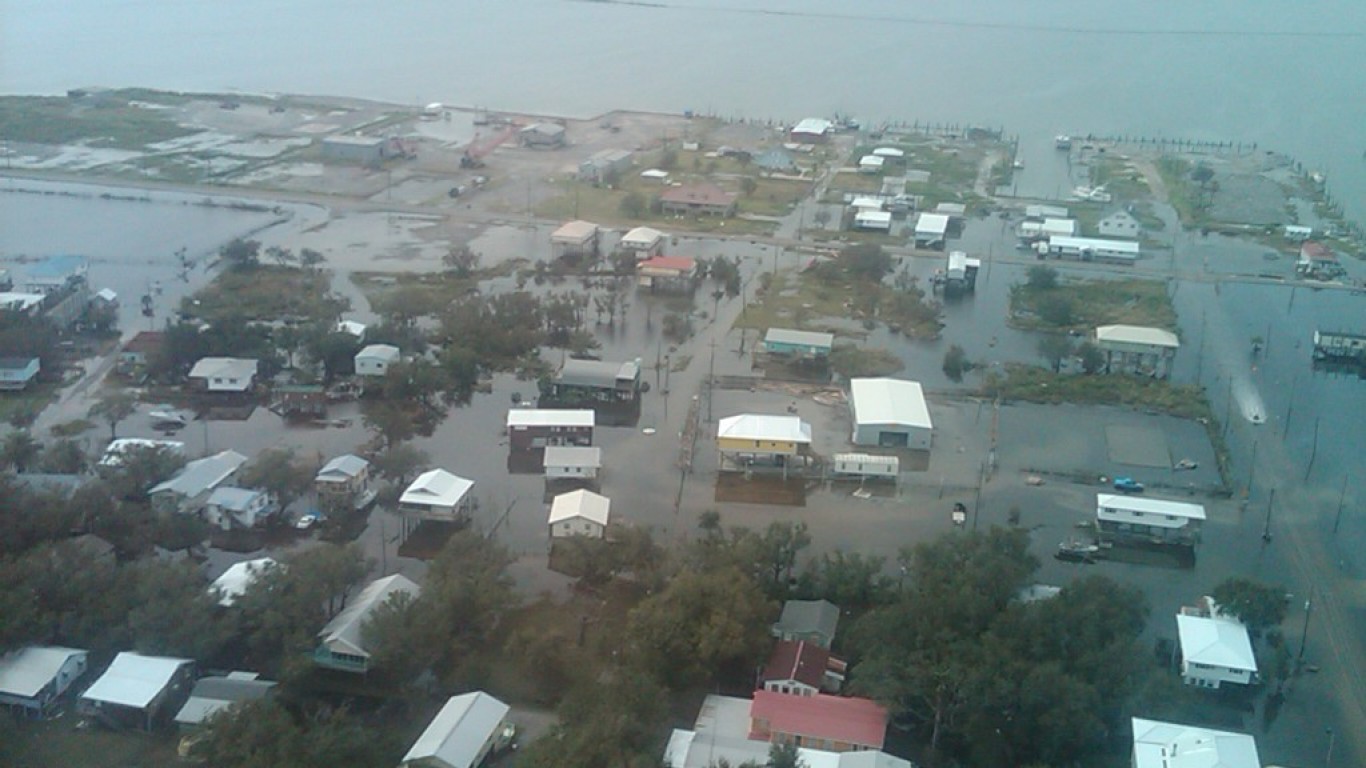
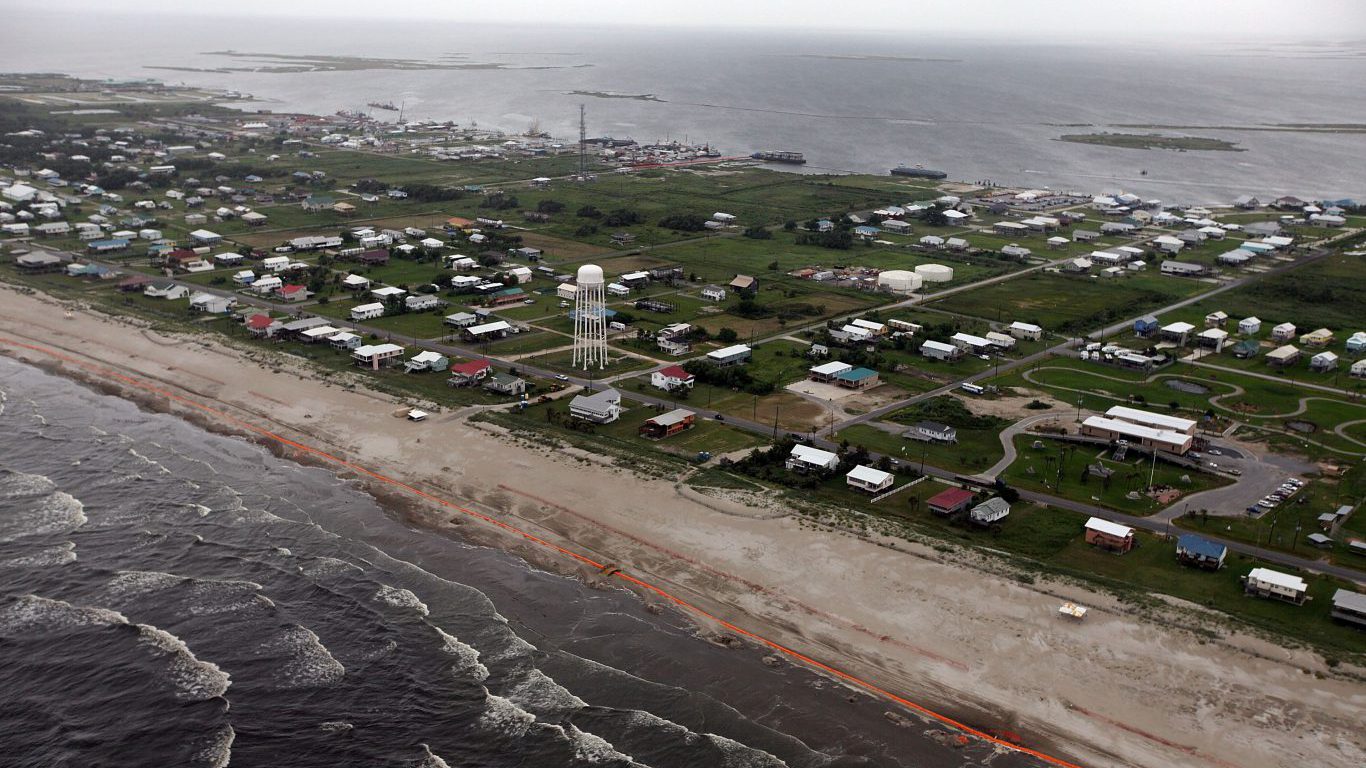
15. Isaac
> Damage: $3.02 billion
> Area pictured: Grand Isle, Louisiana
> Max wind speed at landfall: 70 mph
> Date of landfall: August 2012
[in-text-ad]
Before

After
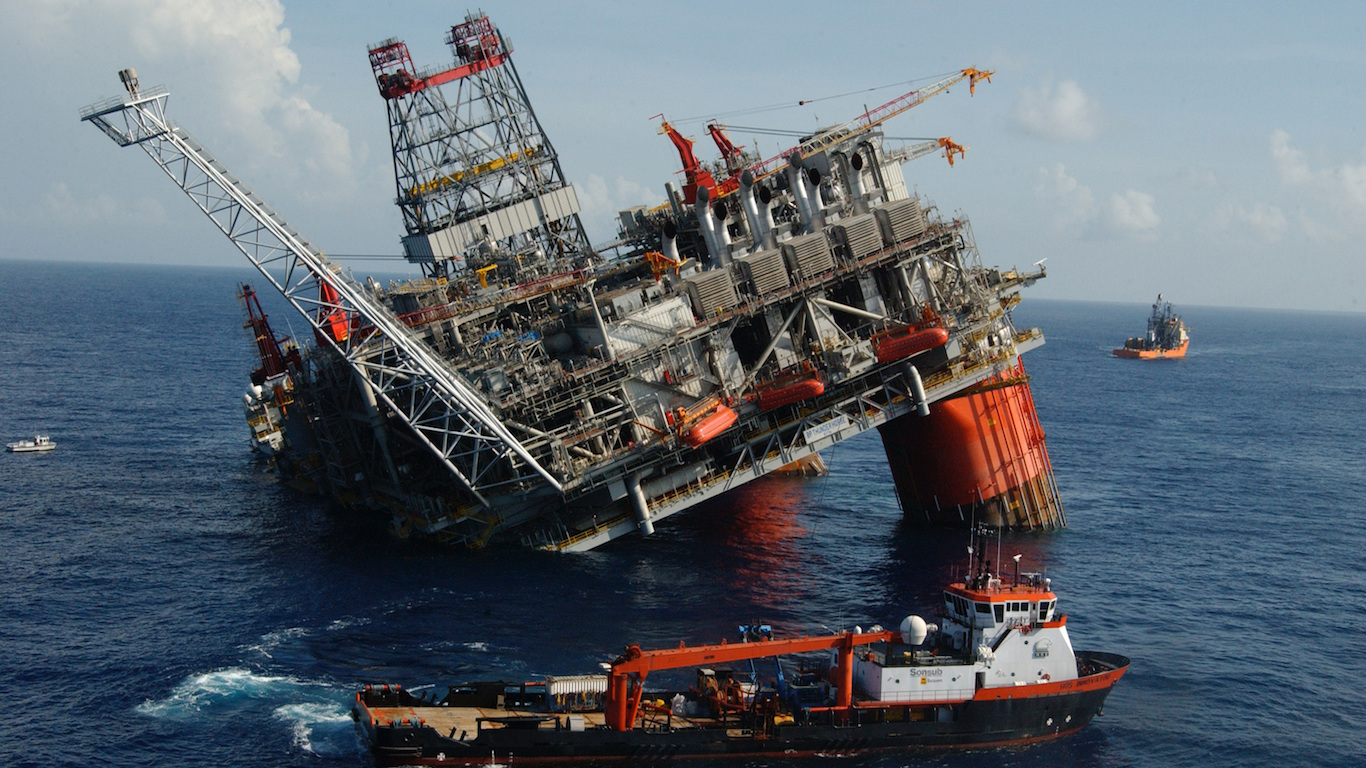
14. Dennis
> Damage: $3.20 billion
> Area pictured: Gulf of Mexico off the coast of Louisiana
> Max wind speed at landfall: 120 mph
> Date of landfall: July 2005
Before
After
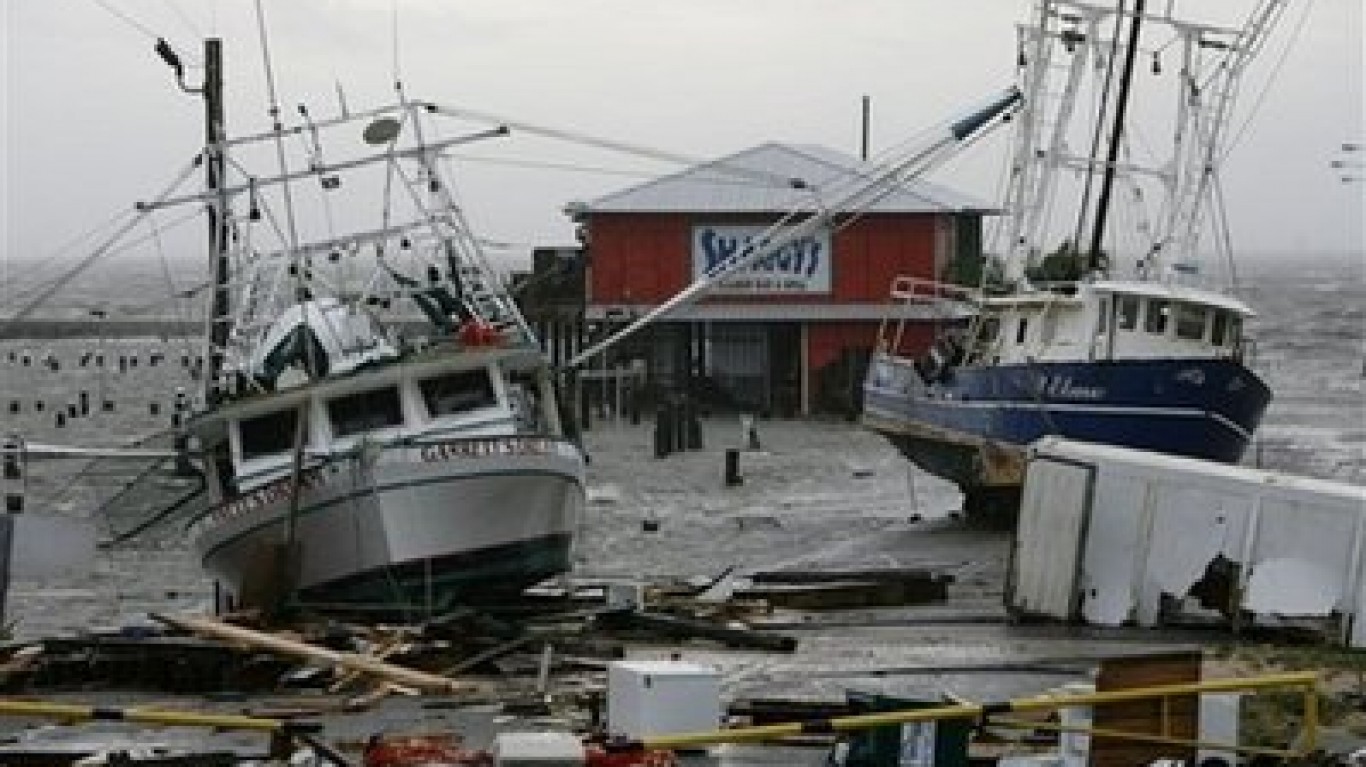
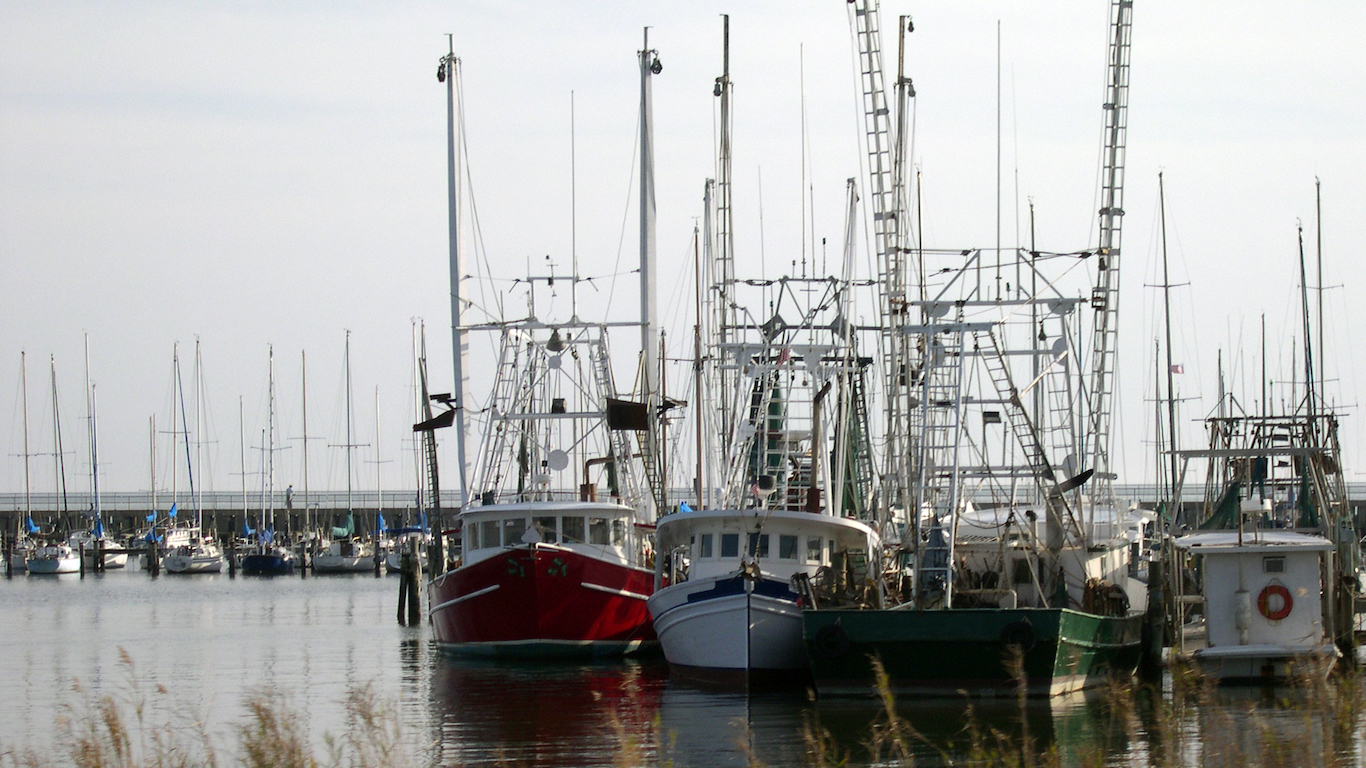
13. Gustav
> Damage: $6.96 billion
> Area pictured: Mississippi
> Max wind speed at landfall: 135 mph
> Date of landfall: August 2008
Before
After
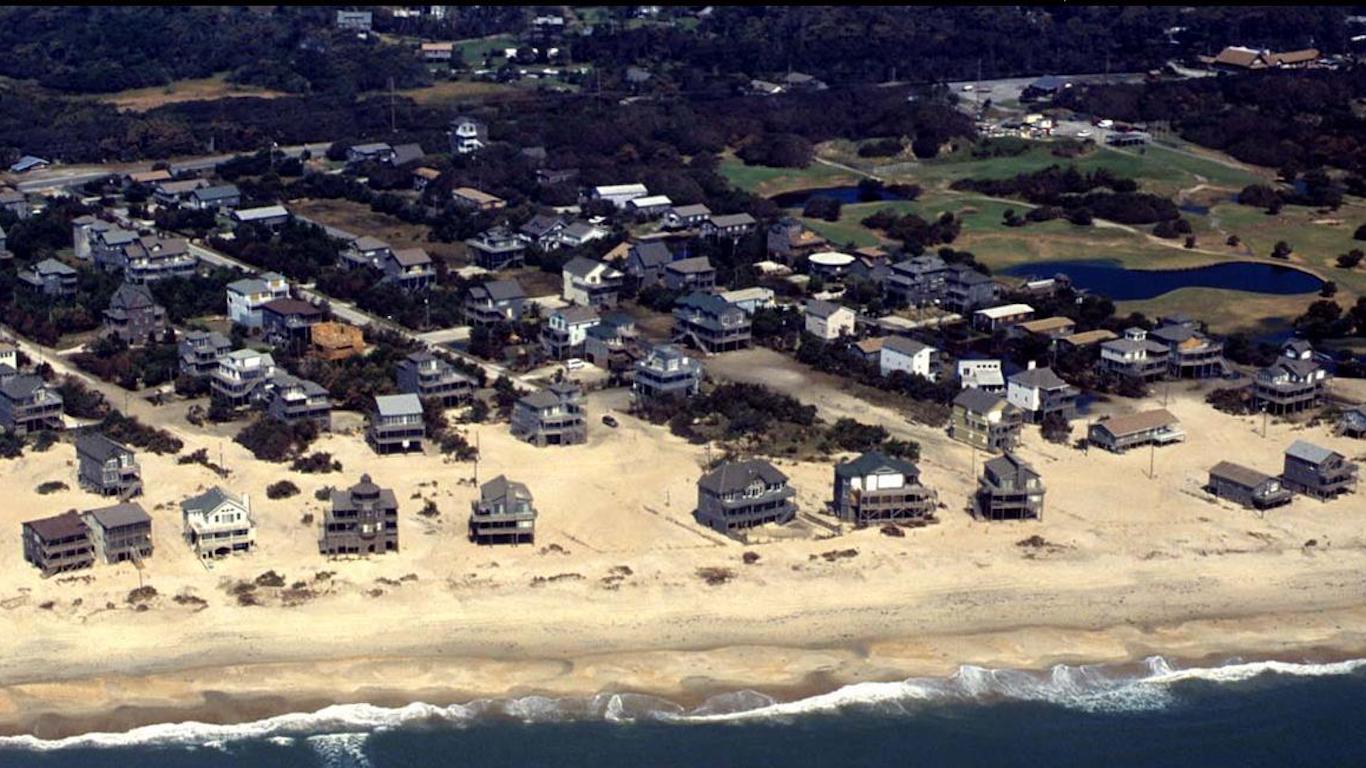
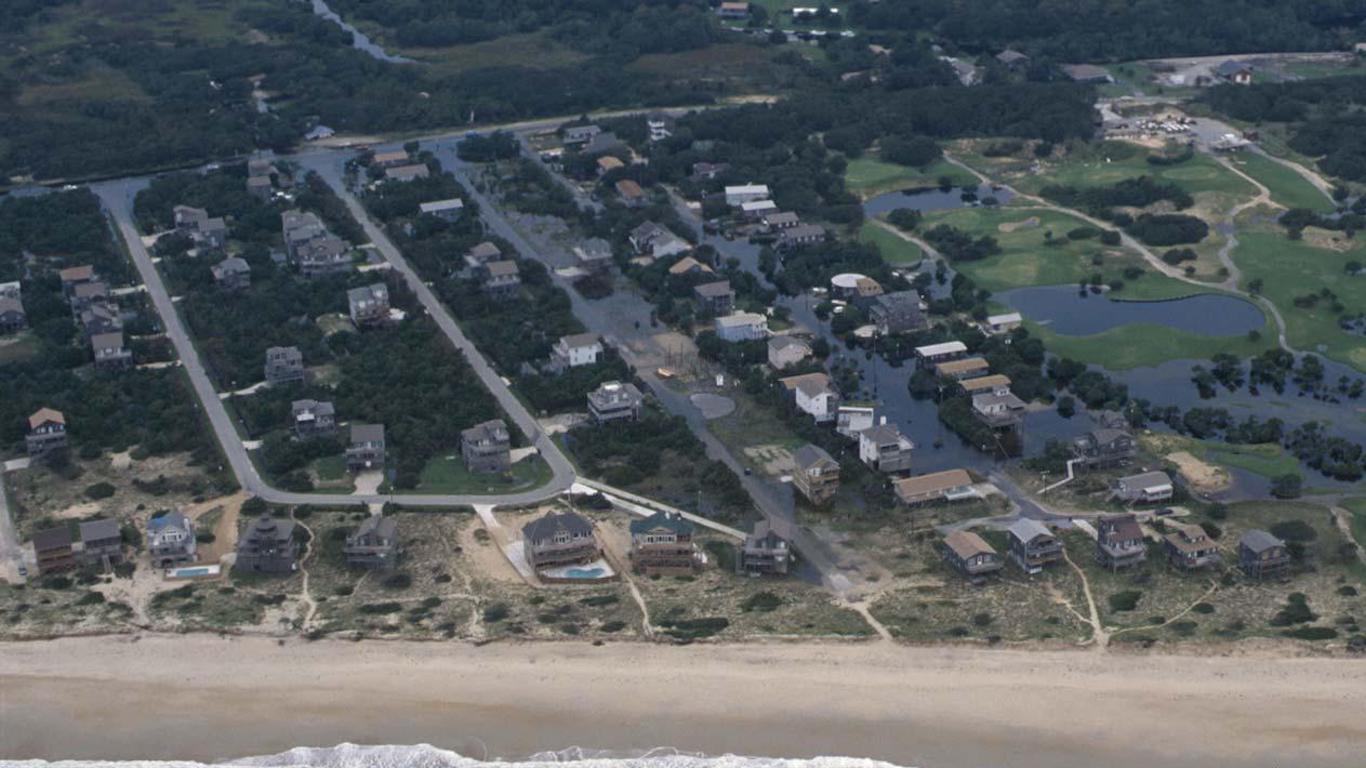
12. Isabel
> Damage: $7.37 billion
> Area pictured: Hatters Island, North Carolina
> Max wind speed at landfall: 90 mph
> Date of landfall: September 2003
[in-text-ad-2]
Before

After

11. Matthew
> Damage: $10.30 billion
> Area pictured: North Carolina
> Max wind speed at landfall: 130 mph
> Date of landfall: October 2016
Before
After

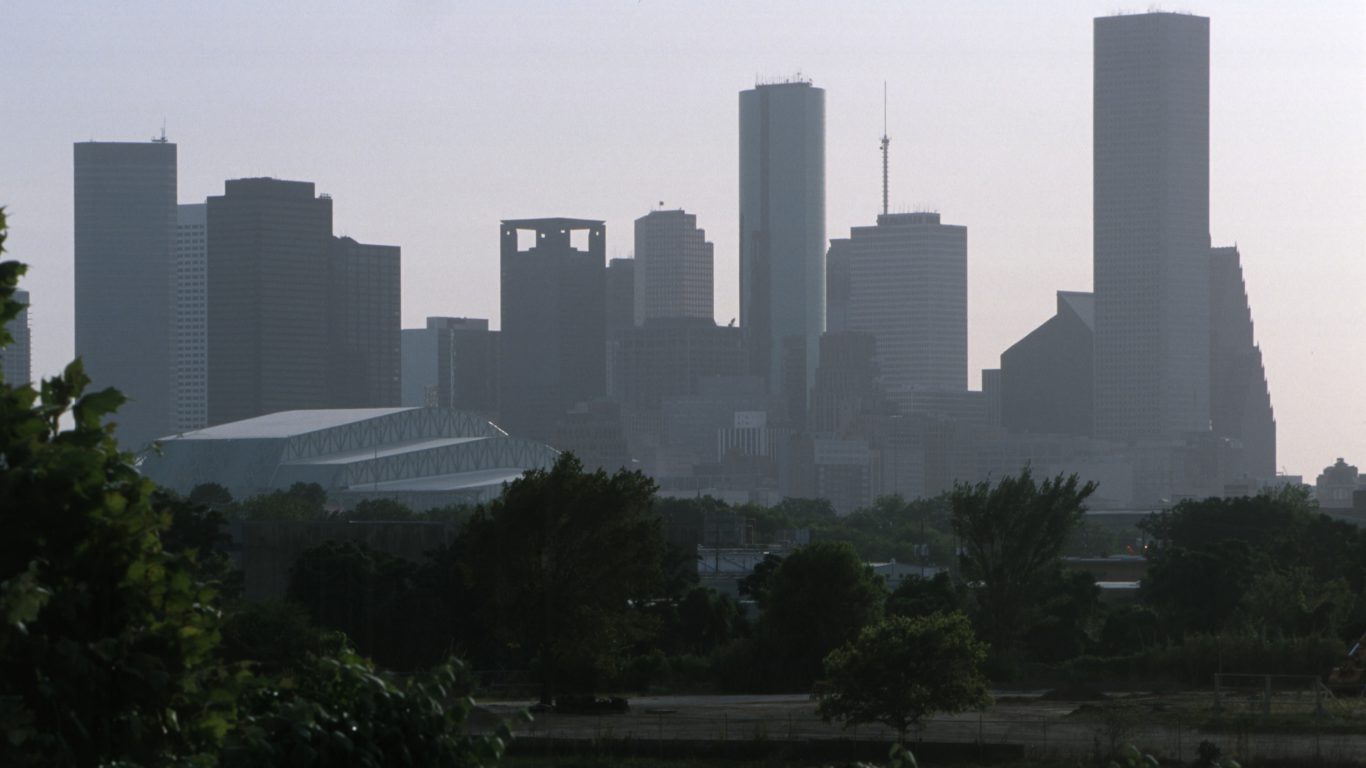
10. Allison
> Damage: $11.82 billion
> Area pictured: Houston, Texas
> Max wind speed at landfall: 45 mph
> Date of landfall: June 2001
Before
After

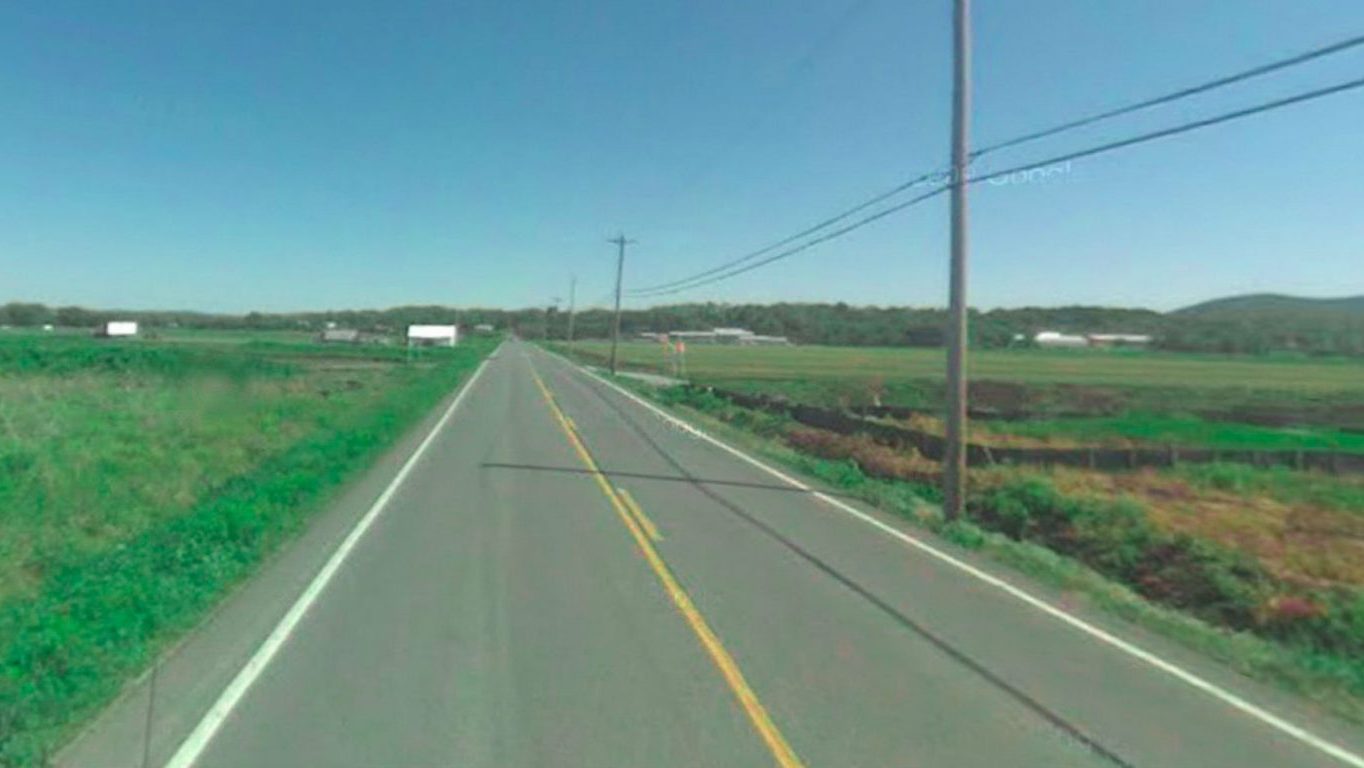
9. Irene
> Damage: $14.98 billion
> Area pictured: Pine Island, New York
> Max wind speed at landfall: 100 mph
> Date of landfall: August 2011
[in-text-ad-2]
Before
After
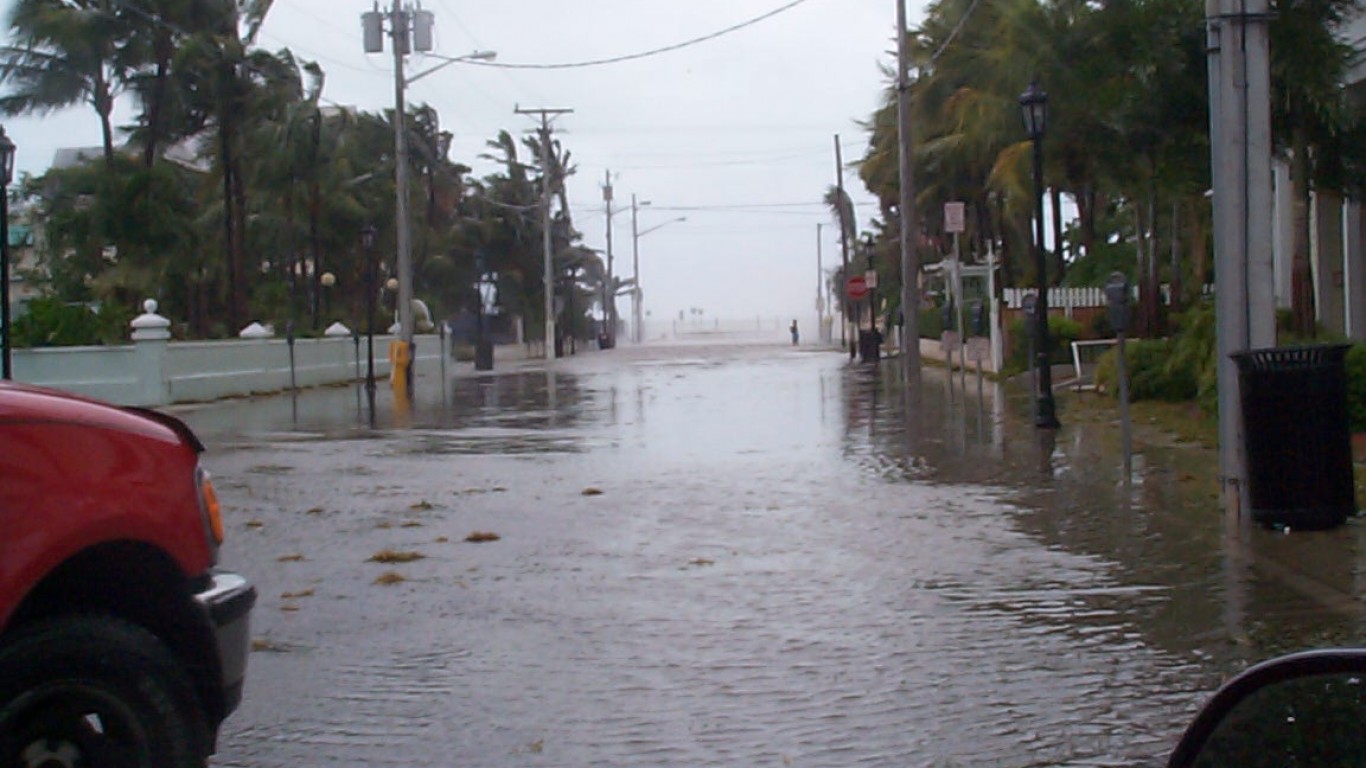
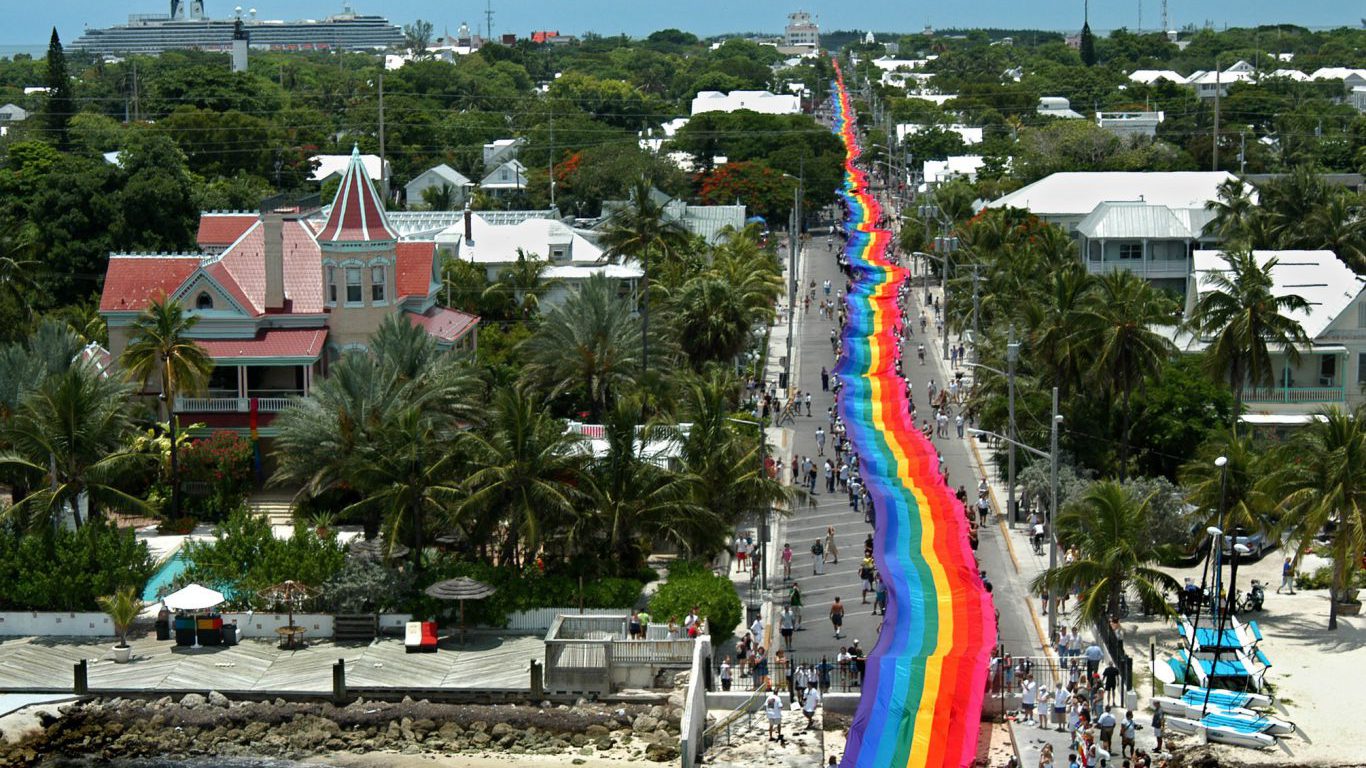
8. Charley
> Damage: $21.12 billion
> Area pictured: Key West, Florida
> Max wind speed at landfall: 130 mph
> Date of landfall: August 2004
Before

After
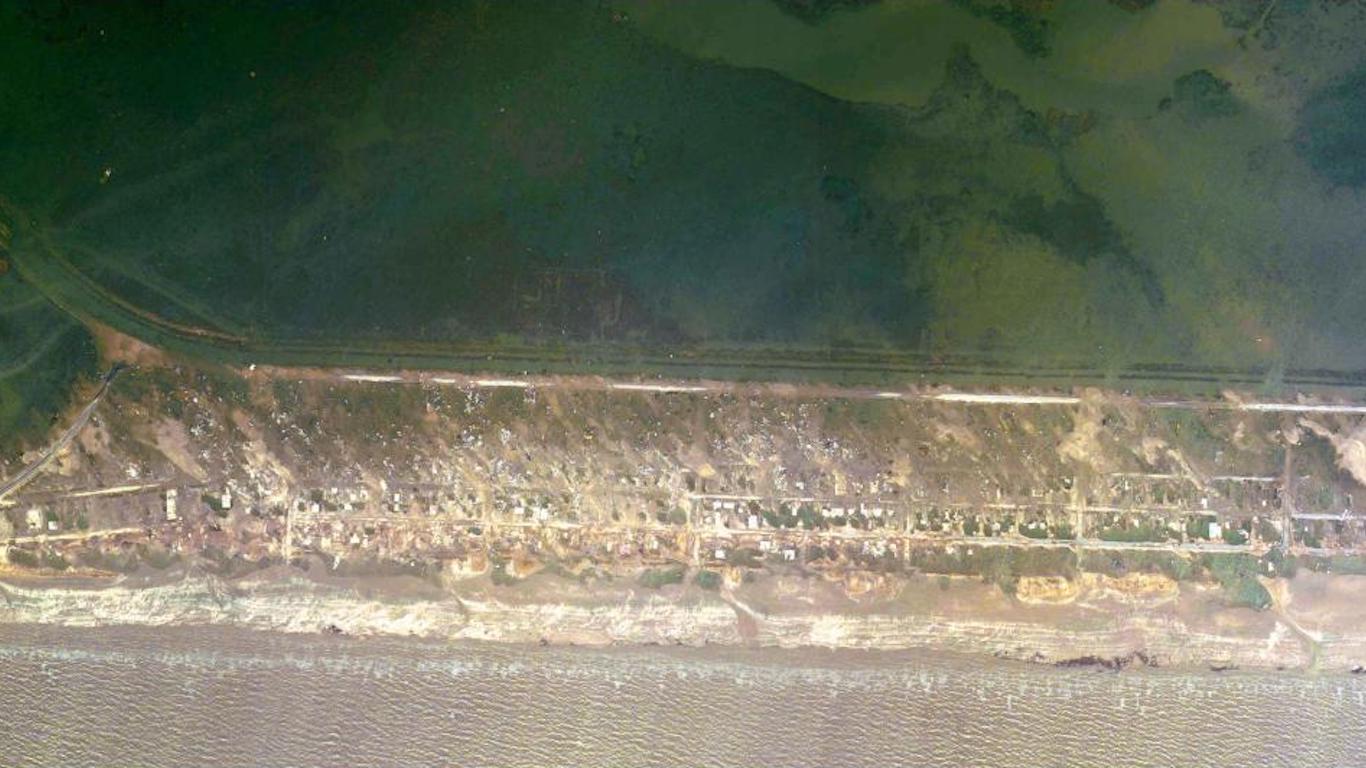
7. Rita
> Damage: $23.68 billion
> Area pictured: Holly Beach, Louisiana
> Max wind speed at landfall: 100 mph
> Date of landfall: September 2005
[in-text-ad]
Before
After
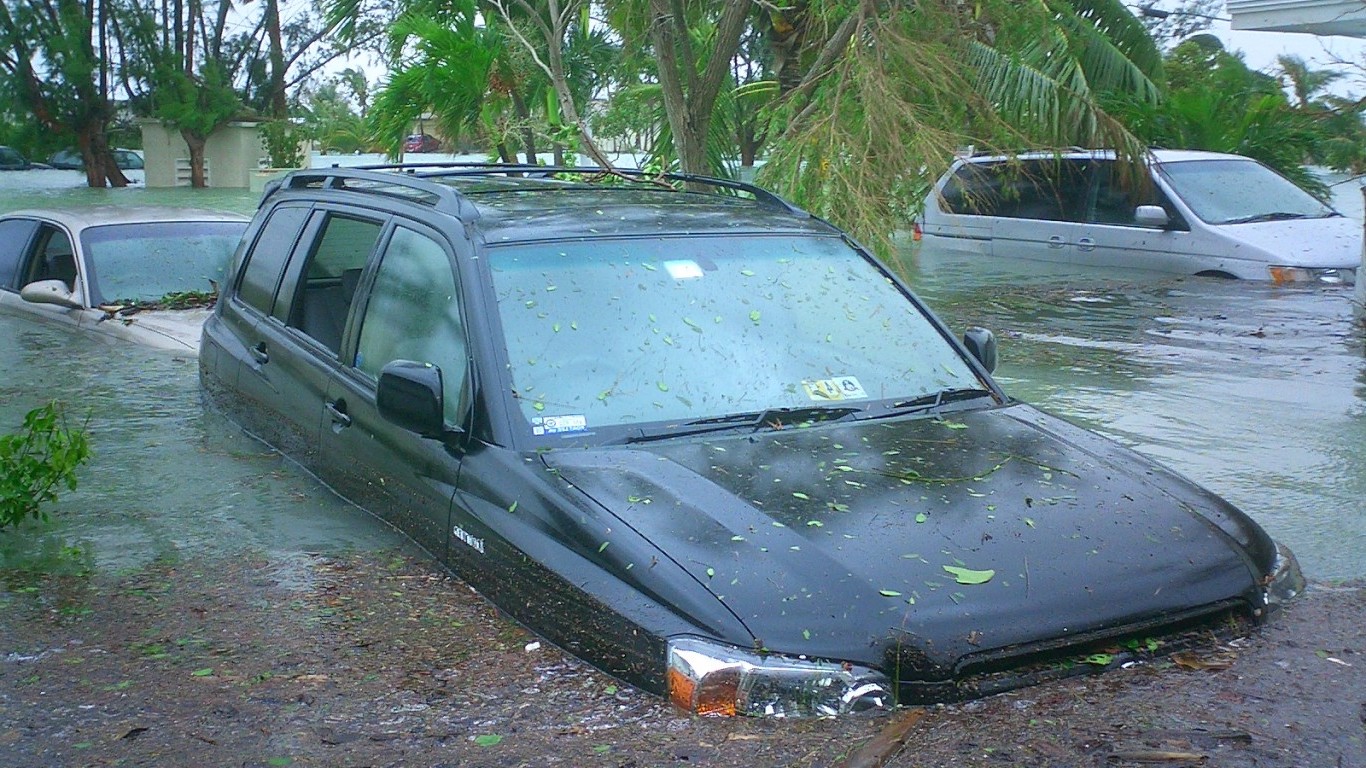
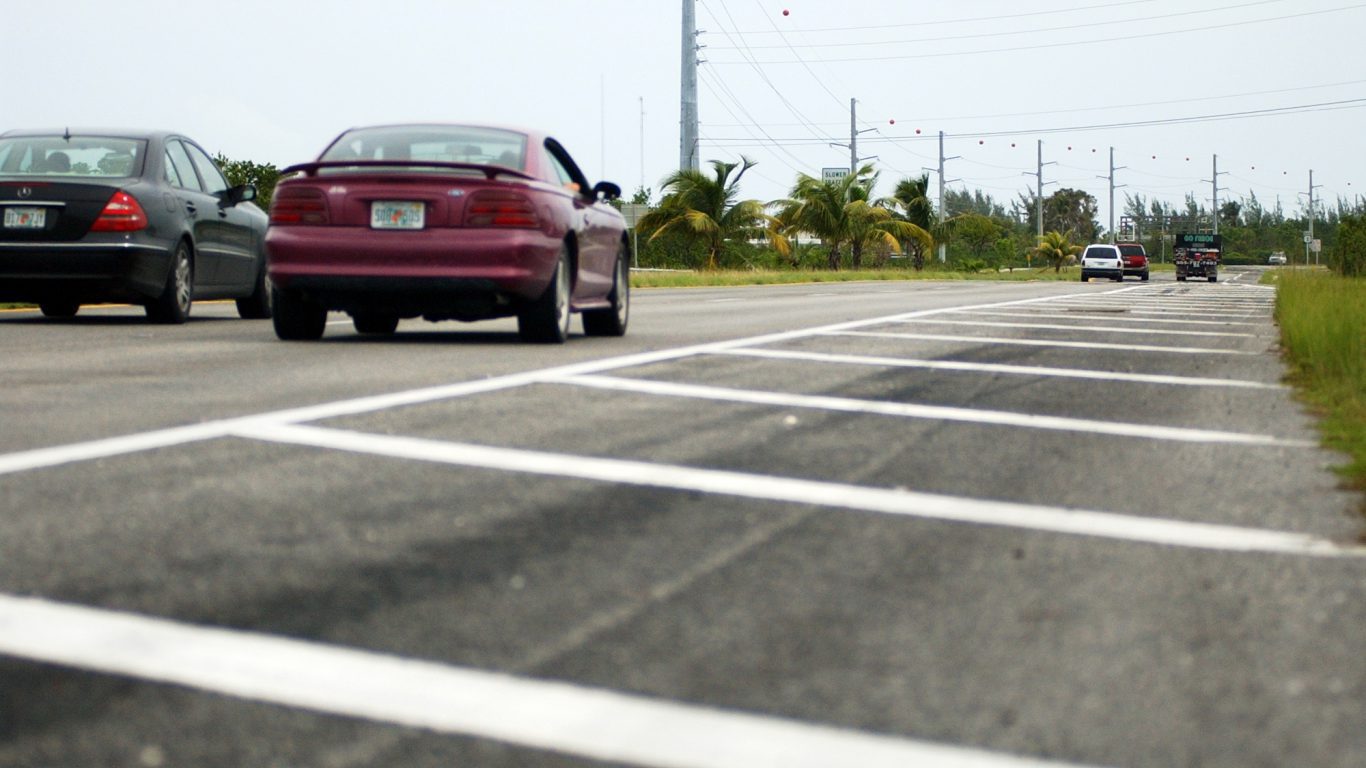
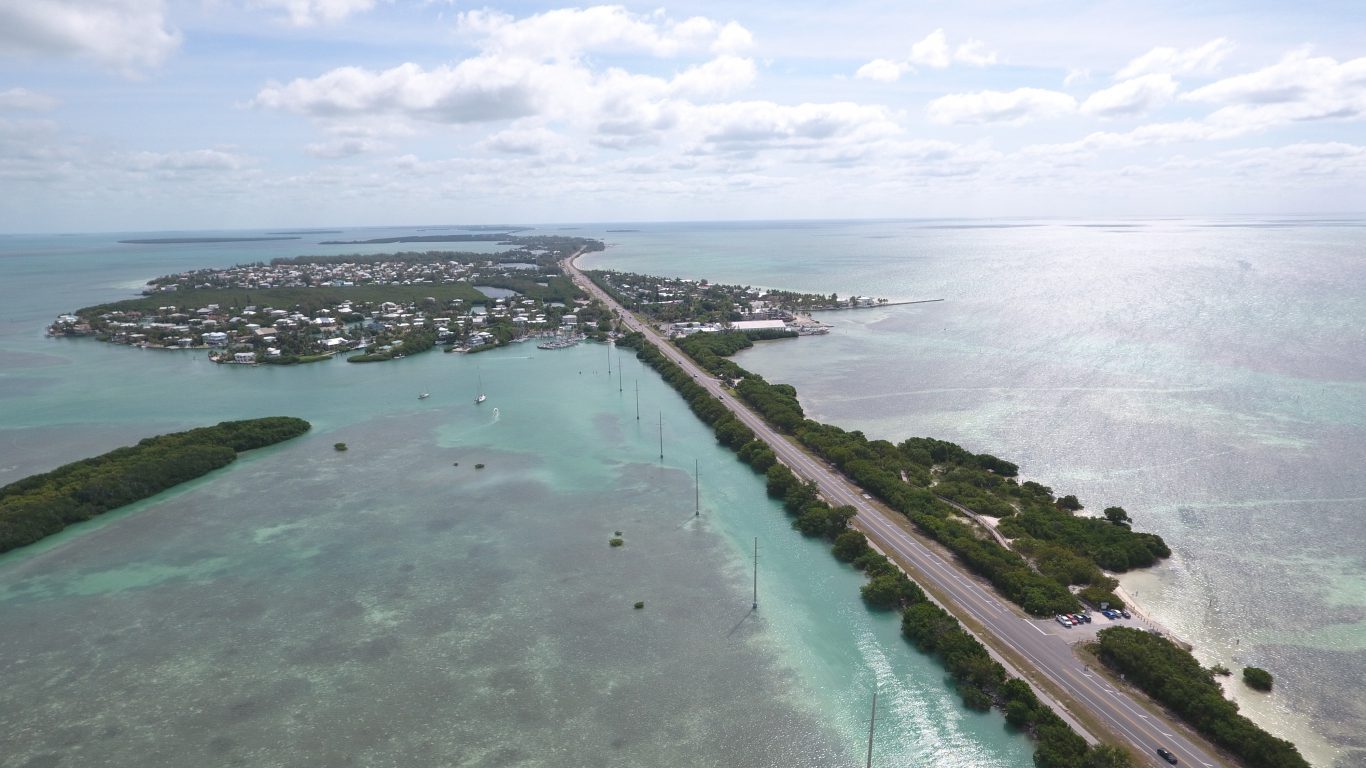
6. Wilma
> Damage: $24.32 billion
> Area pictured: Florida Keys
> Max wind speed at landfall: 130 mph
> Date of landfall: October 2005
Before
After
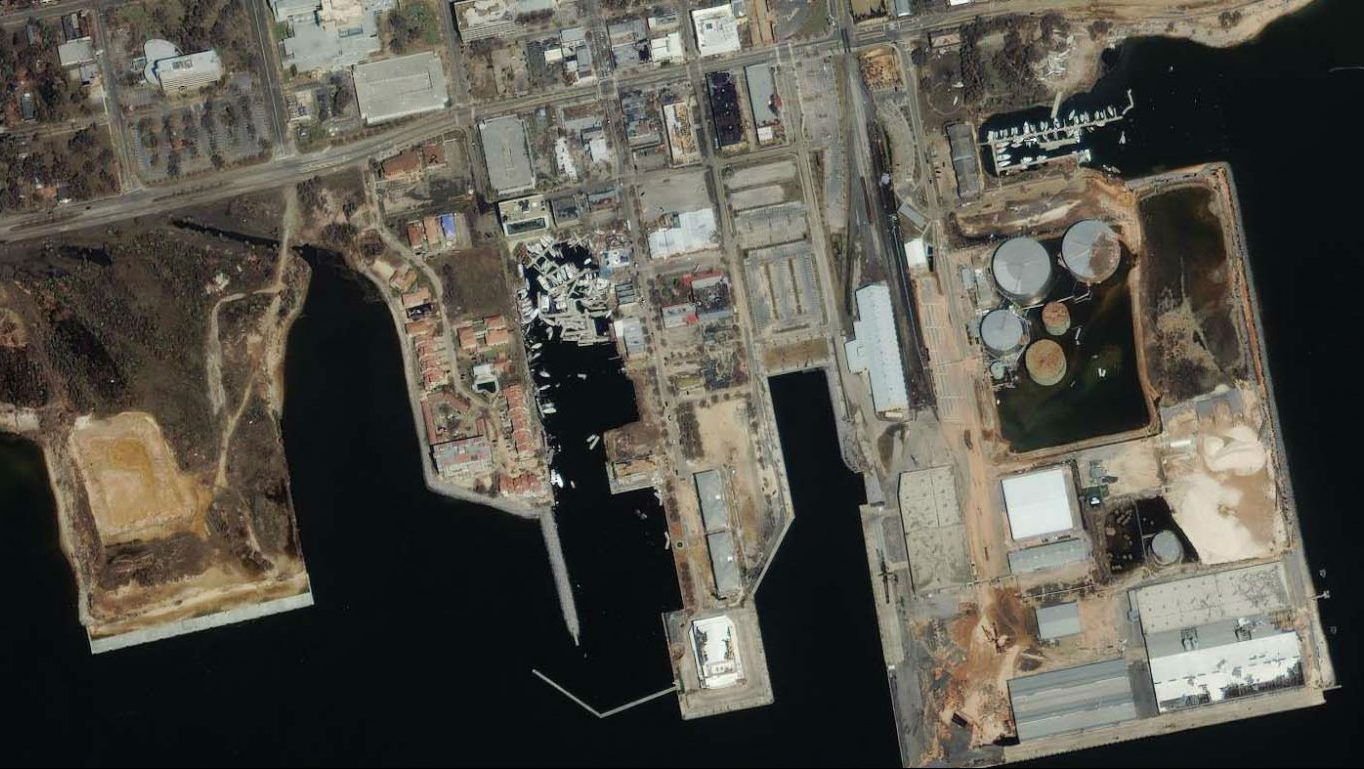
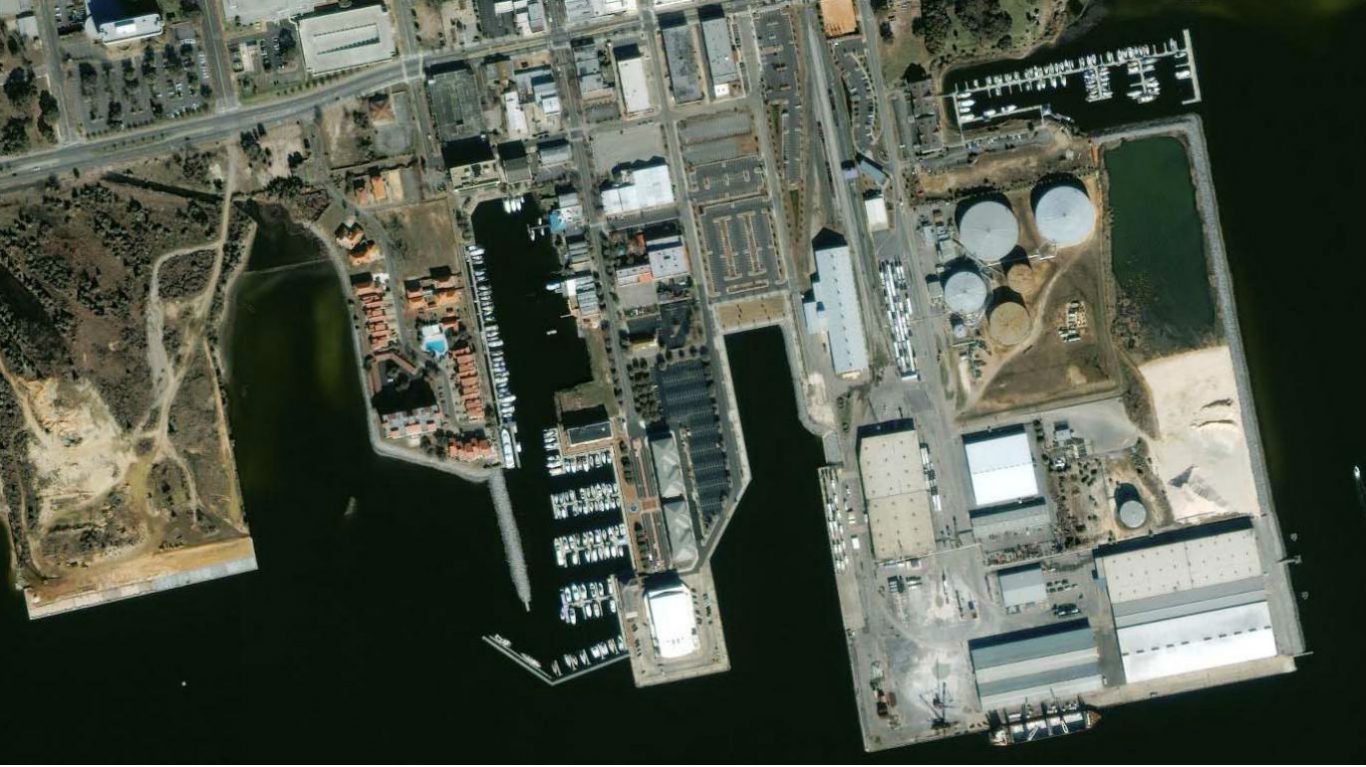
5. Ivan
> Damage: $27.06 billion
> Area pictured: Pensacola, Florida
> Max wind speed at landfall: 105 mph
> Date of landfall: September 2004
[in-text-ad-2]
Before
After

4. Irma
> Damage: $50.00 billion
> Area pictured: Florida Keys
> Max wind speed at landfall: 155 mph
> Date of landfall: September 2017
Before

After
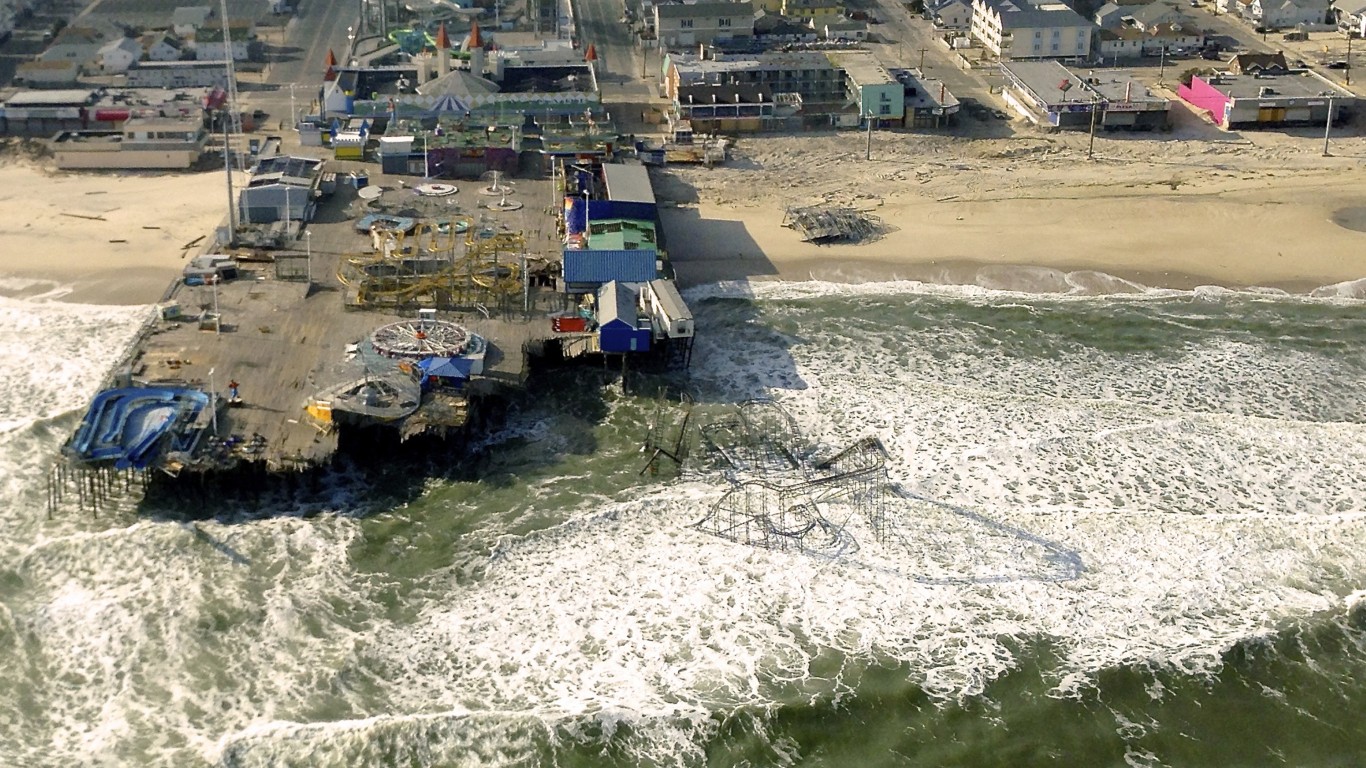
3. Sandy
> Damage: $70.20 billion
> Area pictured: Seaside Heights, New Jersey
> Max wind speed at landfall: 100 mph
> Date of landfall: October 2012
[in-text-ad]
Before
After
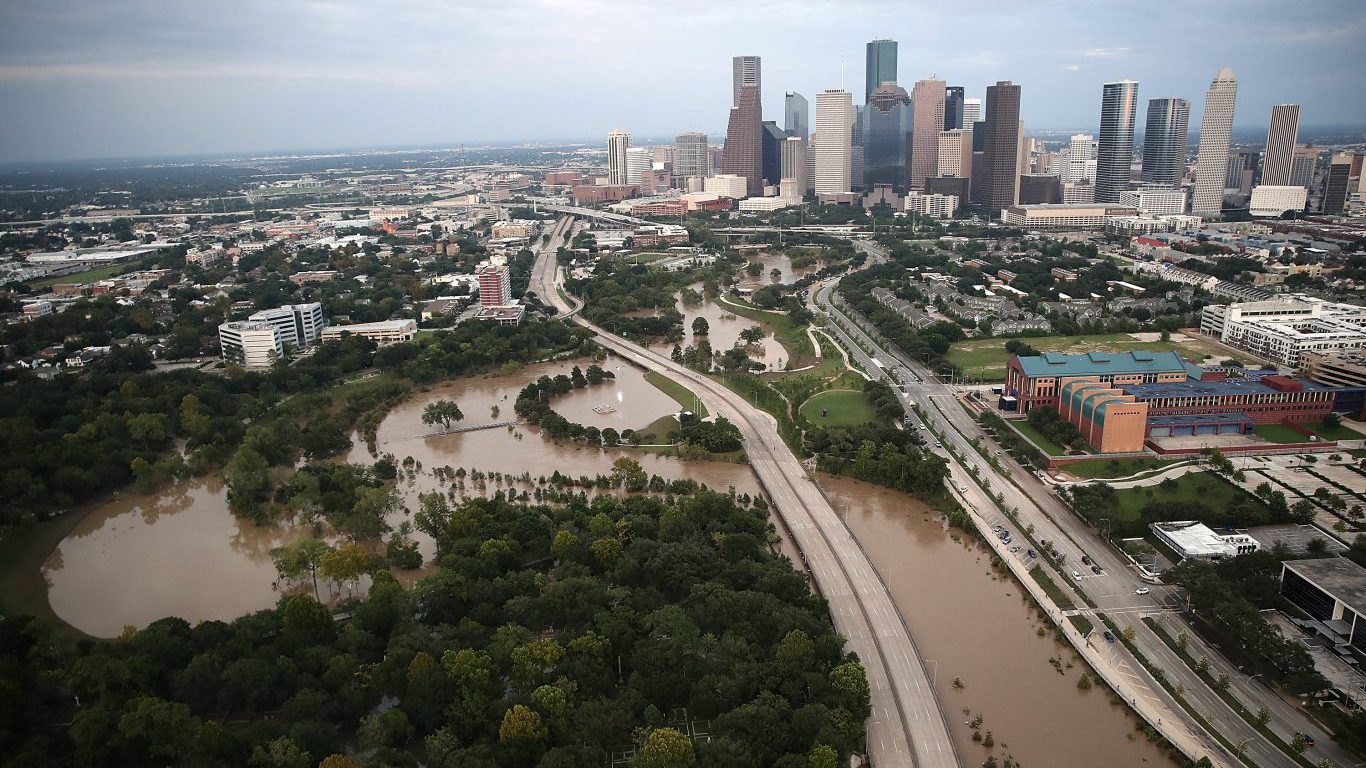
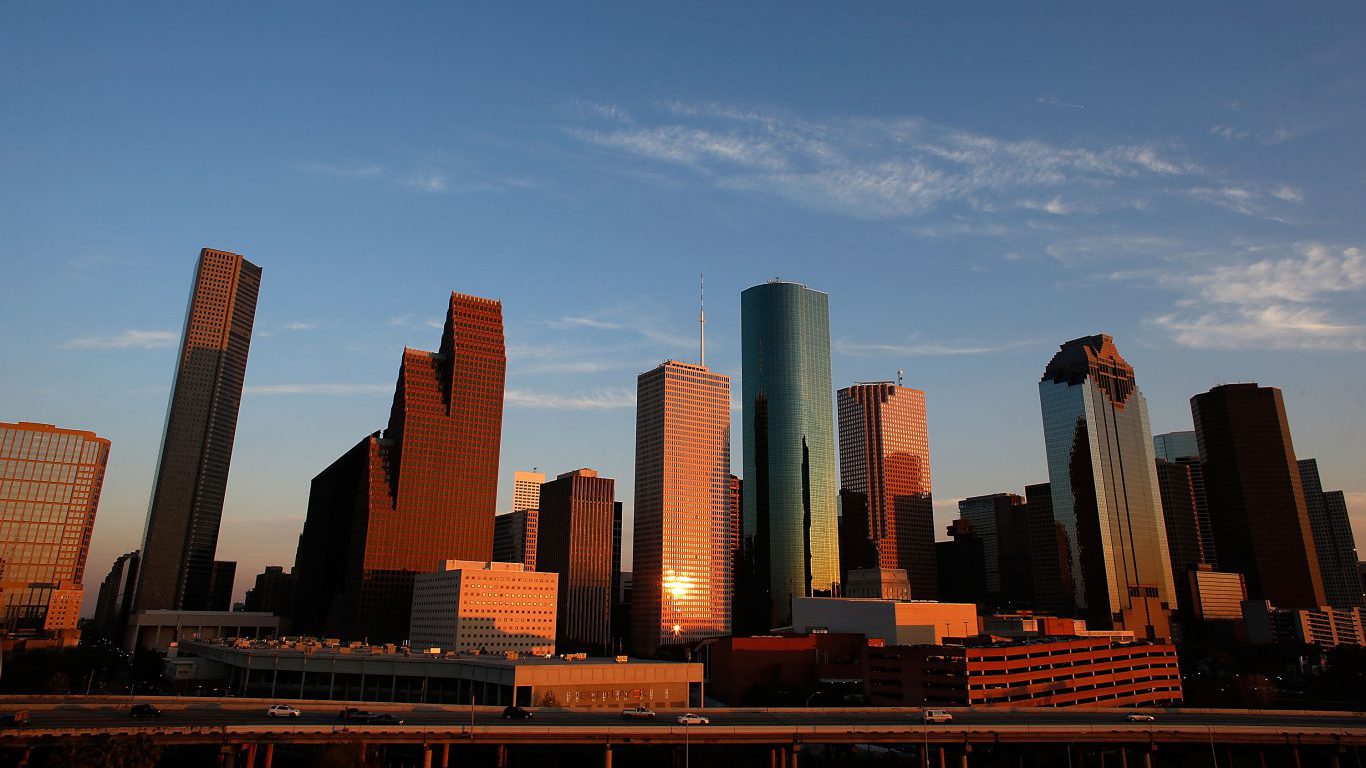
2. Harvey
> Damage: $125.00 billion
> Area pictured: Houston, Texas
> Max wind speed at landfall: 115 mph
> Date of landfall: August 2017
Before

After
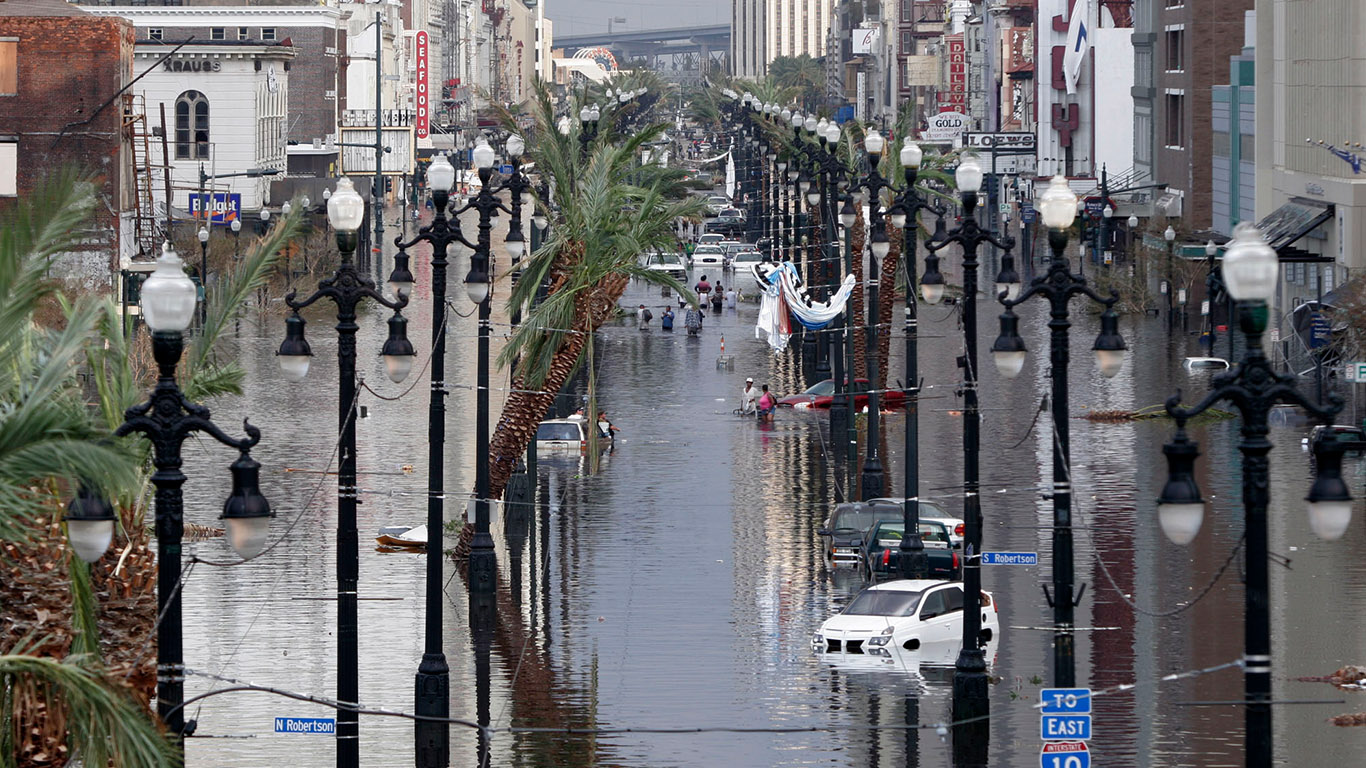
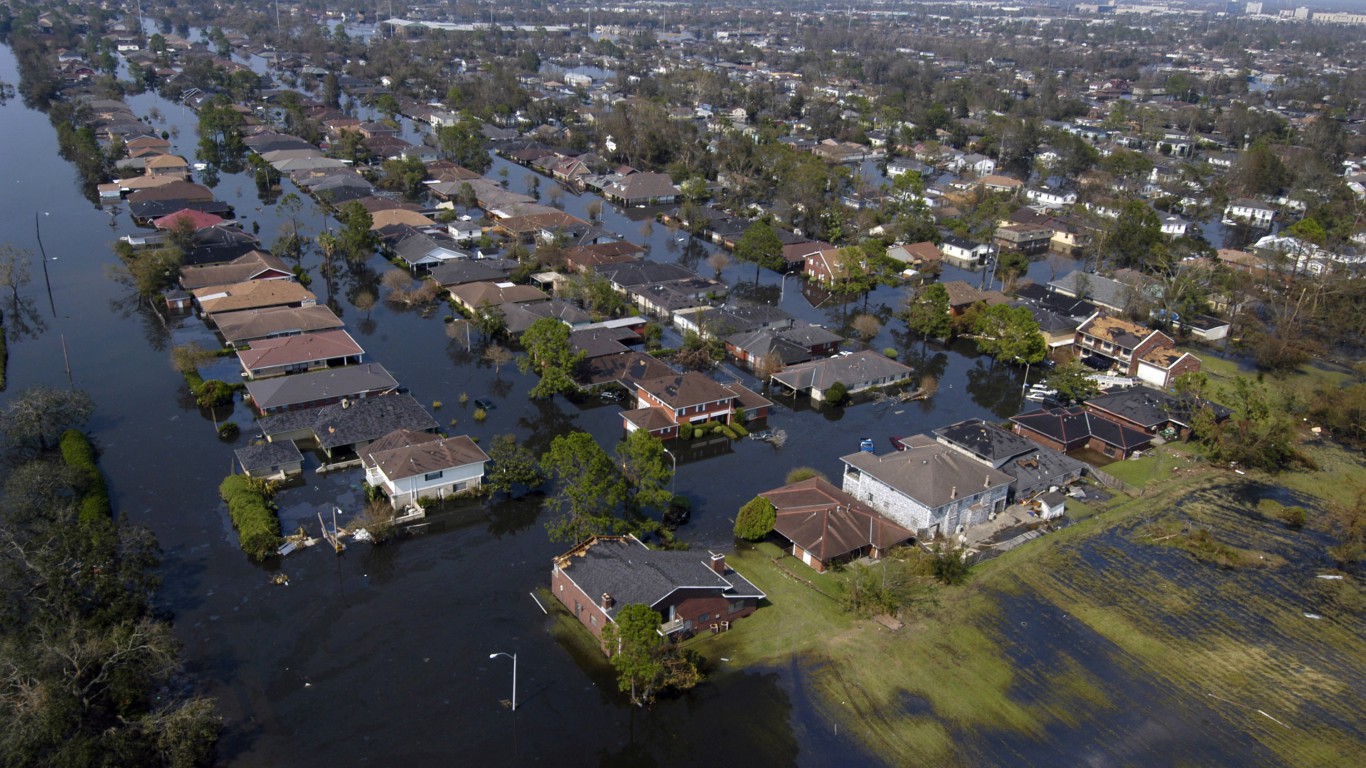
1. Katrina
> Damage: $160.00 billion
> Area pictured: New Orleans, Louisiana
> Max wind speed at landfall: 110 mph
> Date of landfall: August 2005
Credit card companies are pulling out all the stops, with the issuers are offering insane travel rewards and perks.
We’re talking huge sign-up bonuses, points on every purchase, and benefits like lounge access, travel credits, and free hotel nights. For travelers, these rewards can add up to thousands of dollars in flights, upgrades, and luxury experiences every year.
It’s like getting paid to travel — and it’s available to qualified borrowers who know where to look.
We’ve rounded up some of the best travel credit cards on the market. Click here to see the list. Don’t miss these offers — they won’t be this good forever.
Thank you for reading! Have some feedback for us?
Contact the 24/7 Wall St. editorial team.


Our expert who first called NVIDIA in 2009 is predicting 2025 will see a historic AI breakthrough.
You can follow him investing $500,000 of his own money on our top AI stocks for free.
 24/7 Wall St.
 24/7 Wall St.