A third of Americans are getting less sleep than is recommended. While insufficient sleep is often considered rather common, it can have significant and adverse effects on people’s health. After only one night with too little sleep, a person’s cognitive abilities can be dramatically diminished short term.
Sleeping habits vary considerably across the country. To determine the states where residents report getting the most and least sleep, 24/7 Tempo reviewed the share of adults in every state who report sleeping less than seven hours per night on a regular basis. These figures were obtained from the 2021 report by the County Health Rankings & Roadmaps, a Robert Wood Johnson Foundation and University of Wisconsin Population Health Institute joint program.
In addition to cognitive abilities, sleeping less than seven hours per night on a regular basis is associated with a range of adverse physical health effects, including increased risk of diabetes, high blood pressure, and coronary heart disease.
Among the 15 states where residents are most likely to get insufficient sleep at night, just four states report a smaller share of adults with hypertension than the U.S. as a whole, and just one state has a lower diabetes rate.
Poor or insufficient sleep can cause irritability and stress. Quality sleep prevents a chain reaction that starts with signals from the brain to release adrenaline and other hormones, chemicals that cause a person to feel under constant stress. In 13 of the 15 states where residents are most likely to get fewer than seven hours of sleep, people also report more days a month of experiencing mental health problems than the average American.
Lack of sleep has been shown to be a contributing factor to obesity. Sleep deprivation messes with the two hormones that control appetite — ghrelin, which signals hunger, and leptin, which signals being full. Lack of sleep leads to increased levels of ghrelin (increased appetite) and decreased levels of leptin (diminished feeling of fullness). Of the 15 states where residents are most likely to get insufficient sleep, only two have an obesity rate among residents 18 and over that is lower than the national rate of 29.7%.
Low income levels appear to increase the likelihood of a population not getting enough sleep. This is likely caused by residents working longer hours at lower-paying jobs and the higher level of stress from financial insecurity. Nationwide, 12.3% of residents live below the poverty line. The poverty rate is higher in all but four of the 15 states where residents are most likely to get insufficient sleep.
Generally, adults need about seven or more hours of sleep each night, but every one has his or her own optimal sleep time. The quantity, however, is not all that matters. Sleep quality matters, too. Here are 19 secrets to sleep better at night.
Click here to see states where people are getting the most sleep
Click here to see our detailed methodology

50. Minnesota
> Adults reporting insufficient sleep (<7 hours): 29.1%
> Avg. mentally unhealthy days: 3.5 a month (US avg: 4.1 days a month)
> Adults with high blood pressure: 26.6% — 3rd lowest
> Residents 18+ who are obese: 29.0% — 3rd lowest
> Adults 20+ with diabetes: 8.5% — 4th lowest
> Residents 18+ who report poor or fair health: 12.9% — 3rd lowest
> Poverty rate: 9.0% — 3rd lowest
[in-text-ad]

49. Colorado
> Adults reporting insufficient sleep (<7 hours): 30.0%
> Avg. mentally unhealthy days: 3.7 a month (US avg: 4.1 days a month)
> Adults with high blood pressure: 25.9% — 2nd lowest
> Residents 18+ who are obese: 22.4% — 2nd highest
> Adults 20+ with diabetes: 6.6% — the lowest
> Residents 18+ who report poor or fair health: 13.8% — 9th lowest
> Poverty rate: 9.3% — 7th lowest

48. South Dakota
> Adults reporting insufficient sleep (<7 hours): 30.1%
> Avg. mentally unhealthy days: 3.3 a month (US avg: 4.1 days a month)
> Adults with high blood pressure: 30.8% — 21st lowest
> Residents 18+ who are obese: 32.4% — 6th highest
> Adults 20+ with diabetes: 10.1% — 23rd lowest
> Residents 18+ who report poor or fair health: 13.4% — 5th lowest
> Poverty rate: 11.9% — 23rd highest

47. Vermont
> Adults reporting insufficient sleep (<7 hours): 30.1%
> Avg. mentally unhealthy days: 4.2 a month (US avg: 4.1 days a month)
> Adults with high blood pressure: 30.4% — 13th lowest
> Residents 18+ who are obese: 27.0% — 14th highest
> Adults 20+ with diabetes: 8.8% — 7th lowest
> Residents 18+ who report poor or fair health: 12.8% — the lowest
> Poverty rate: 10.2% — 15th lowest
[in-text-ad-2]

46. Montana
> Adults reporting insufficient sleep (<7 hours): 30.9%
> Avg. mentally unhealthy days: 3.9 a month (US avg: 4.1 days a month)
> Adults with high blood pressure: 29.0% — 6th lowest
> Residents 18+ who are obese: 27.1% — 12th highest
> Adults 20+ with diabetes: 8.9% — 8th lowest
> Residents 18+ who report poor or fair health: 14.1% — 11th lowest
> Poverty rate: 12.6% — 20th highest

45. Utah
> Adults reporting insufficient sleep (<7 hours): 31.2%
> Avg. mentally unhealthy days: 3.9 a month (US avg: 4.1 days a month)
> Adults with high blood pressure: 24.4% — the lowest
> Residents 18+ who are obese: 27.0% — 17th highest
> Adults 20+ with diabetes: 7.5% — 2nd lowest
> Residents 18+ who report poor or fair health: 14.8% — 13th lowest
> Poverty rate: 8.9% — 2nd lowest
[in-text-ad]

44. Washington
> Adults reporting insufficient sleep (<7 hours): 31.8%
> Avg. mentally unhealthy days: 4.0 a month (US avg: 4.1 days a month)
> Adults with high blood pressure: 29.5% — 9th lowest
> Residents 18+ who are obese: 28.6% — 4th highest
> Adults 20+ with diabetes: 9.3% — 11th lowest
> Residents 18+ who report poor or fair health: 15.0% — 14th lowest
> Poverty rate: 9.8% — 9th lowest

43. Nebraska
> Adults reporting insufficient sleep (<7 hours): 32.3%
> Avg. mentally unhealthy days: 3.6 a month (US avg: 4.1 days a month)
> Adults with high blood pressure: 30.6% — 17th lowest
> Residents 18+ who are obese: 33.4% — 6th lowest
> Adults 20+ with diabetes: 10.0% — 22nd lowest
> Residents 18+ who report poor or fair health: 13.8% — 10th lowest
> Poverty rate: 9.9% — 10th lowest

42. Wisconsin
> Adults reporting insufficient sleep (<7 hours): 32.7%
> Avg. mentally unhealthy days: 4.0 a month (US avg: 4.1 days a month)
> Adults with high blood pressure: 30.8% — 20th lowest
> Residents 18+ who are obese: 31.7% — 9th highest
> Adults 20+ with diabetes: 9.5% — 14th lowest
> Residents 18+ who report poor or fair health: 14.8% — 12th lowest
> Poverty rate: 10.4% — 16th lowest
[in-text-ad-2]

41. North Dakota
> Adults reporting insufficient sleep (<7 hours): 32.8%
> Avg. mentally unhealthy days: 3.8 a month (US avg: 4.1 days a month)
> Adults with high blood pressure: 29.5% — 9th lowest
> Residents 18+ who are obese: 33.9% — 25th lowest
> Adults 20+ with diabetes: 9.4% — 13th lowest
> Residents 18+ who report poor or fair health: 13.6% — 8th lowest
> Poverty rate: 10.6% — 17th lowest

40. Oregon
> Adults reporting insufficient sleep (<7 hours): 32.8%
> Avg. mentally unhealthy days: 4.8 a month (US avg: 4.1 days a month)
> Adults with high blood pressure: 30.1% — 12th lowest
> Residents 18+ who are obese: 29.3% — 24th lowest
> Adults 20+ with diabetes: 9.7% — 18th lowest
> Residents 18+ who report poor or fair health: 18.2% — 18th highest
> Poverty rate: 11.4% — 23rd lowest
[in-text-ad]

39. New Mexico
> Adults reporting insufficient sleep (<7 hours): 33.1%
> Avg. mentally unhealthy days: 4.5 a month (US avg: 4.1 days a month)
> Adults with high blood pressure: 30.5% — 14th lowest
> Residents 18+ who are obese: 27.3% — 21st highest
> Adults 20+ with diabetes: 9.5% — 15th lowest
> Residents 18+ who report poor or fair health: 20.3% — 9th highest
> Poverty rate: 18.2% — 3rd highest

38. Iowa
> Adults reporting insufficient sleep (<7 hours): 33.1%
> Avg. mentally unhealthy days: 3.5 a month (US avg: 4.1 days a month)
> Adults with high blood pressure: 31.5% — 22nd lowest
> Residents 18+ who are obese: 34.3% — 3rd highest
> Adults 20+ with diabetes: 9.9% — 21st lowest
> Residents 18+ who report poor or fair health: 13.5% — 6th lowest
> Poverty rate: 11.2% — 20th lowest

37. Alaska
> Adults reporting insufficient sleep (<7 hours): 33.3%
> Avg. mentally unhealthy days: 3.7 a month (US avg: 4.1 days a month)
> Adults with high blood pressure: 31.8% — 23rd lowest
> Residents 18+ who are obese: 31.9% — 10th highest
> Adults 20+ with diabetes: 8.3% — 3rd lowest
> Residents 18+ who report poor or fair health: 15.6% — 20th lowest
> Poverty rate: 10.1% — 13th lowest
[in-text-ad-2]

36. Idaho
> Adults reporting insufficient sleep (<7 hours): 33.4%
> Avg. mentally unhealthy days: 4.0 a month (US avg: 4.1 days a month)
> Adults with high blood pressure: 29.8% — 10th lowest
> Residents 18+ who are obese: 29.0% — the highest
> Adults 20+ with diabetes: 9.3% — 12th lowest
> Residents 18+ who report poor or fair health: 15.1% — 15th lowest
> Poverty rate: 11.2% — 21st lowest
35. Illinois
> Adults reporting insufficient sleep (<7 hours): 33.5%
> Avg. mentally unhealthy days: 3.8 a month (US avg: 4.1 days a month)
> Adults with high blood pressure: 32.3% — 25th lowest
> Residents 18+ who are obese: 29.7% — 24th highest
> Adults 20+ with diabetes: 9.9% — 19th lowest
> Residents 18+ who report poor or fair health: 15.9% — 21st lowest
> Poverty rate: 11.5% — 25th lowest
[in-text-ad]

34. Wyoming
> Adults reporting insufficient sleep (<7 hours): 33.8%
> Avg. mentally unhealthy days: 4.0 a month (US avg: 4.1 days a month)
> Adults with high blood pressure: 30.8% — 20th lowest
> Residents 18+ who are obese: 29.2% — 7th lowest
> Adults 20+ with diabetes: 9.0% — 9th lowest
> Residents 18+ who report poor or fair health: 15.3% — 17th lowest
> Poverty rate: 10.1% — 14th lowest

33. Connecticut
> Adults reporting insufficient sleep (<7 hours): 33.8%
> Avg. mentally unhealthy days: 3.8 a month (US avg: 4.1 days a month)
> Adults with high blood pressure: 30.5% — 15th lowest
> Residents 18+ who are obese: 26.3% — 7th highest
> Adults 20+ with diabetes: 9.2% — 10th lowest
> Residents 18+ who report poor or fair health: 13.0% — 4th lowest
> Poverty rate: 10.0% — 12th lowest

32. Kansas
> Adults reporting insufficient sleep (<7 hours): 34.0%
> Avg. mentally unhealthy days: 4.1 a month (US avg: 4.1 days a month)
> Adults with high blood pressure: 32.8% — 20th highest
> Residents 18+ who are obese: 33.0% — 12th lowest
> Adults 20+ with diabetes: 10.5% — 23rd highest
> Residents 18+ who report poor or fair health: 16.3% — 24th lowest
> Poverty rate: 11.4% — 24th lowest
[in-text-ad-2]
31. Massachusetts
> Adults reporting insufficient sleep (<7 hours): 34.3%
> Avg. mentally unhealthy days: 4.3 a month (US avg: 4.1 days a month)
> Adults with high blood pressure: 28.6% — 5th lowest
> Residents 18+ who are obese: 25.0% — 10th lowest
> Adults 20+ with diabetes: 8.7% — 5th lowest
> Residents 18+ who report poor or fair health: 13.5% — 7th lowest
> Poverty rate: 9.4% — 8th lowest

30. Texas
> Adults reporting insufficient sleep (<7 hours): 34.4%
> Avg. mentally unhealthy days: 3.8 a month (US avg: 4.1 days a month)
> Adults with high blood pressure: 32.5% — 23rd highest
> Residents 18+ who are obese: 31.4% — 5th highest
> Adults 20+ with diabetes: 10.2% — 25th highest
> Residents 18+ who report poor or fair health: 18.7% — 13th highest
> Poverty rate: 13.6% — 11th highest
[in-text-ad]

29. California
> Adults reporting insufficient sleep (<7 hours): 34.5%
> Avg. mentally unhealthy days: 3.7 a month (US avg: 4.1 days a month)
> Adults with high blood pressure: 28.4% — 4th lowest
> Residents 18+ who are obese: 24.3% — 15th lowest
> Adults 20+ with diabetes: 8.8% — 6th lowest
> Residents 18+ who report poor or fair health: 17.6% — 22nd highest
> Poverty rate: 11.8% — 25th highest

28. Maine
> Adults reporting insufficient sleep (<7 hours): 34.5%
> Avg. mentally unhealthy days: 5.0 a month (US avg: 4.1 days a month)
> Adults with high blood pressure: 34.8% — 12th highest
> Residents 18+ who are obese: 29.8% — 18th highest
> Adults 20+ with diabetes: 10.4% — 24th highest
> Residents 18+ who report poor or fair health: 17.1% — 24th highest
> Poverty rate: 10.9% — 19th lowest

27. Arizona
> Adults reporting insufficient sleep (<7 hours): 34.9%
> Avg. mentally unhealthy days: 4.0 a month (US avg: 4.1 days a month)
> Adults with high blood pressure: 30.6% — 18th lowest
> Residents 18+ who are obese: 27.9% — 20th highest
> Adults 20+ with diabetes: 9.6% — 16th lowest
> Residents 18+ who report poor or fair health: 18.6% — 14th highest
> Poverty rate: 13.5% — 13th highest
[in-text-ad-2]

26. Missouri
> Adults reporting insufficient sleep (<7 hours): 35.2%
> Avg. mentally unhealthy days: 4.5 a month (US avg: 4.1 days a month)
> Adults with high blood pressure: 32.0% — 24th lowest
> Residents 18+ who are obese: 32.5% — 16th lowest
> Adults 20+ with diabetes: 11.4% — 15th highest
> Residents 18+ who report poor or fair health: 19.5% — 11th highest
> Poverty rate: 12.9% — 18th highest

25. New Hampshire
> Adults reporting insufficient sleep (<7 hours): 35.3%
> Avg. mentally unhealthy days: 4.6 a month (US avg: 4.1 days a month)
> Adults with high blood pressure: 30.0% — 11th lowest
> Residents 18+ who are obese: 28.6% — 16th highest
> Adults 20+ with diabetes: 9.6% — 17th lowest
> Residents 18+ who report poor or fair health: 12.8% — 2nd lowest
> Poverty rate: 7.3% — the lowest
[in-text-ad]

24. North Carolina
> Adults reporting insufficient sleep (<7 hours): 36.1%
> Avg. mentally unhealthy days: 4.1 a month (US avg: 4.1 days a month)
> Adults with high blood pressure: 34.8% — 13th highest
> Residents 18+ who are obese: 32.3% — 14th lowest
> Adults 20+ with diabetes: 11.5% — 14th highest
> Residents 18+ who report poor or fair health: 18.0% — 19th highest
> Poverty rate: 13.6% — 12th highest

23. Delaware
> Adults reporting insufficient sleep (<7 hours): 36.5%
> Avg. mentally unhealthy days: 4.2 a month (US avg: 4.1 days a month)
> Adults with high blood pressure: 34.9% — 11th highest
> Residents 18+ who are obese: 32.4% — 23rd lowest
> Adults 20+ with diabetes: 11.8% — 13th highest
> Residents 18+ who report poor or fair health: 16.3% — 23rd lowest
> Poverty rate: 11.3% — 22nd lowest

22. Rhode Island
> Adults reporting insufficient sleep (<7 hours): 36.7%
> Avg. mentally unhealthy days: 4.2 a month (US avg: 4.1 days a month)
> Adults with high blood pressure: 33.1% — 17th highest
> Residents 18+ who are obese: 28.5% — 2nd lowest
> Adults 20+ with diabetes: 10.1% — 24th lowest
> Residents 18+ who report poor or fair health: 16.5% — 25th lowest
> Poverty rate: 10.8% — 18th lowest
[in-text-ad-2]

21. Arkansas
> Adults reporting insufficient sleep (<7 hours): 37.2%
> Avg. mentally unhealthy days: 5.3 a month (US avg: 4.1 days a month)
> Adults with high blood pressure: 41.4% — 3rd highest
> Residents 18+ who are obese: 35.0% — 25th highest
> Adults 20+ with diabetes: 13.5% — 4th highest
> Residents 18+ who report poor or fair health: 23.3% — 2nd highest
> Poverty rate: 16.2% — 5th highest

20. Nevada
> Adults reporting insufficient sleep (<7 hours): 37.3%
> Avg. mentally unhealthy days: 4.0 a month (US avg: 4.1 days a month)
> Adults with high blood pressure: 32.6% — 21st highest
> Residents 18+ who are obese: 27.1% — 4th lowest
> Adults 20+ with diabetes: 10.5% — 22nd highest
> Residents 18+ who report poor or fair health: 19.1% — 12th highest
> Poverty rate: 12.5% — 21st highest
[in-text-ad]

19. Florida
> Adults reporting insufficient sleep (<7 hours): 37.3%
> Avg. mentally unhealthy days: 4.2 a month (US avg: 4.1 days a month)
> Adults with high blood pressure: 34.6% — 16th highest
> Residents 18+ who are obese: 27.2% — 15th highest
> Adults 20+ with diabetes: 10.8% — 20th highest
> Residents 18+ who report poor or fair health: 19.5% — 10th highest
> Poverty rate: 12.7% — 19th highest

18. Oklahoma
> Adults reporting insufficient sleep (<7 hours): 37.5%
> Avg. mentally unhealthy days: 4.8 a month (US avg: 4.1 days a month)
> Adults with high blood pressure: 37.7% — 9th highest
> Residents 18+ who are obese: 34.5% — 5th lowest
> Adults 20+ with diabetes: 12.3% — 9th highest
> Residents 18+ who report poor or fair health: 20.9% — 8th highest
> Poverty rate: 15.2% — 8th highest
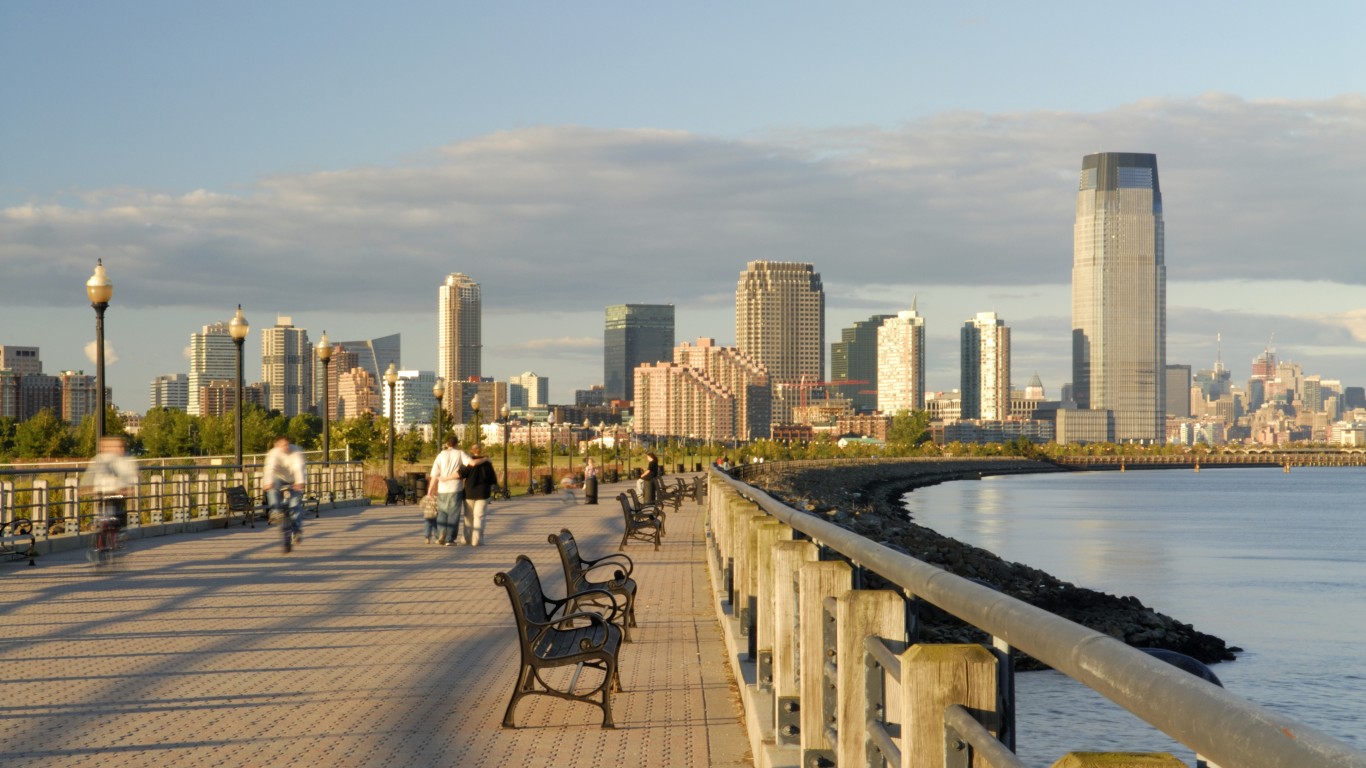
17. New Jersey
> Adults reporting insufficient sleep (<7 hours): 37.5%
> Avg. mentally unhealthy days: 3.8 a month (US avg: 4.1 days a month)
> Adults with high blood pressure: 33.0% — 19th highest
> Residents 18+ who are obese: 27.0% — 20th lowest
> Adults 20+ with diabetes: 9.9% — 20th lowest
> Residents 18+ who report poor or fair health: 15.5% — 19th lowest
> Poverty rate: 9.2% — 5th lowest
[in-text-ad-2]

16. Maryland
> Adults reporting insufficient sleep (<7 hours): 37.7%
> Avg. mentally unhealthy days: 3.7 a month (US avg: 4.1 days a month)
> Adults with high blood pressure: 32.4% — 24th highest
> Residents 18+ who are obese: 31.6% — 22nd lowest
> Adults 20+ with diabetes: 11.1% — 16th highest
> Residents 18+ who report poor or fair health: 15.2% — 16th lowest
> Poverty rate: 9.0% — 4th lowest

15. Mississippi
> Adults reporting insufficient sleep (<7 hours): 37.8%
> Avg. mentally unhealthy days: 4.8 a month (US avg: 4.1 days a month)
> Adults with high blood pressure: 40.8% — 4th highest
> Residents 18+ who are obese: 39.1% — 19th lowest
> Adults 20+ with diabetes: 14.6% — 2nd highest
> Residents 18+ who report poor or fair health: 22.1% — 3rd highest
> Poverty rate: 19.6% — the highest
[in-text-ad]

14. Indiana
> Adults reporting insufficient sleep (<7 hours): 38.0%
> Avg. mentally unhealthy days: 4.7 a month (US avg: 4.1 days a month)
> Adults with high blood pressure: 35.2% — 10th highest
> Residents 18+ who are obese: 33.9% — 22nd highest
> Adults 20+ with diabetes: 12.1% — 11th highest
> Residents 18+ who report poor or fair health: 18.2% — 17th highest
> Poverty rate: 11.9% — 24th highest

13. Louisiana
> Adults reporting insufficient sleep (<7 hours): 38.0%
> Avg. mentally unhealthy days: 5.0 a month (US avg: 4.1 days a month)
> Adults with high blood pressure: 39.0% — 6th highest
> Residents 18+ who are obese: 36.3% — 8th highest
> Adults 20+ with diabetes: 13.0% — 6th highest
> Residents 18+ who report poor or fair health: 21.4% — 5th highest
> Poverty rate: 19.0% — 2nd highest

12. Georgia
> Adults reporting insufficient sleep (<7 hours): 38.3%
> Avg. mentally unhealthy days: 4.2 a month (US avg: 4.1 days a month)
> Adults with high blood pressure: 33.1% — 18th highest
> Residents 18+ who are obese: 32.3% — 13th lowest
> Adults 20+ with diabetes: 12.0% — 12th highest
> Residents 18+ who report poor or fair health: 18.4% — 15th highest
> Poverty rate: 13.3% — 14th highest
[in-text-ad-2]

11. Virginia
> Adults reporting insufficient sleep (<7 hours): 38.6%
> Avg. mentally unhealthy days: 4.0 a month (US avg: 4.1 days a month)
> Adults with high blood pressure: 32.4% — 25th highest
> Residents 18+ who are obese: 30.5% — 21st lowest
> Adults 20+ with diabetes: 10.7% — 21st highest
> Residents 18+ who report poor or fair health: 16.6% — 25th highest
> Poverty rate: 9.9% — 11th lowest

10. Pennsylvania
> Adults reporting insufficient sleep (<7 hours): 38.6%
> Avg. mentally unhealthy days: 4.7 a month (US avg: 4.1 days a month)
> Adults with high blood pressure: 32.6% — 22nd highest
> Residents 18+ who are obese: 30.8% — 11th highest
> Adults 20+ with diabetes: 11.0% — 19th highest
> Residents 18+ who report poor or fair health: 17.6% — 23rd highest
> Poverty rate: 12.0% — 22nd highest
[in-text-ad]
9. South Carolina
> Adults reporting insufficient sleep (<7 hours): 38.8%
> Avg. mentally unhealthy days: 4.7 a month (US avg: 4.1 days a month)
> Adults with high blood pressure: 38.1% — 8th highest
> Residents 18+ who are obese: 34.0% — 23rd highest
> Adults 20+ with diabetes: 13.3% — 5th highest
> Residents 18+ who report poor or fair health: 17.8% — 20th highest
> Poverty rate: 13.8% — 10th highest

8. New York
> Adults reporting insufficient sleep (<7 hours): 38.9%
> Avg. mentally unhealthy days: 3.6 a month (US avg: 4.1 days a month)
> Adults with high blood pressure: 29.4% — 7th lowest
> Residents 18+ who are obese: 26.4% — 13th highest
> Adults 20+ with diabetes: 10.1% — 25th lowest
> Residents 18+ who report poor or fair health: 16.3% — 22nd lowest
> Poverty rate: 13.0% — 16th highest

7. Alabama
> Adults reporting insufficient sleep (<7 hours): 39.6%
> Avg. mentally unhealthy days: 4.9 a month (US avg: 4.1 days a month)
> Adults with high blood pressure: 41.9% — 2nd highest
> Residents 18+ who are obese: 36.1% — 17th lowest
> Adults 20+ with diabetes: 14.5% — 3rd highest
> Residents 18+ who report poor or fair health: 21.4% — 6th highest
> Poverty rate: 15.5% — 7th highest
[in-text-ad-2]

6. Michigan
> Adults reporting insufficient sleep (<7 hours): 40.4%
> Avg. mentally unhealthy days: 4.7 a month (US avg: 4.1 days a month)
> Adults with high blood pressure: 34.7% — 14th highest
> Residents 18+ who are obese: 32.4% — 8th lowest
> Adults 20+ with diabetes: 11.0% — 18th highest
> Residents 18+ who report poor or fair health: 18.3% — 16th highest
> Poverty rate: 13.0% — 17th highest

5. Ohio
> Adults reporting insufficient sleep (<7 hours): 40.6%
> Avg. mentally unhealthy days: 4.8 a month (US avg: 4.1 days a month)
> Adults with high blood pressure: 34.7% — 15th highest
> Residents 18+ who are obese: 33.5% — 11th lowest
> Adults 20+ with diabetes: 12.2% — 10th highest
> Residents 18+ who report poor or fair health: 17.8% — 21st highest
> Poverty rate: 13.1% — 15th highest
[in-text-ad]

4. Tennessee
> Adults reporting insufficient sleep (<7 hours): 40.8%
> Avg. mentally unhealthy days: 5.2 a month (US avg: 4.1 days a month)
> Adults with high blood pressure: 38.7% — 7th highest
> Residents 18+ who are obese: 33.3% — 9th lowest
> Adults 20+ with diabetes: 12.5% — 8th highest
> Residents 18+ who report poor or fair health: 21.2% — 7th highest
> Poverty rate: 13.9% — 9th highest

3. Kentucky
> Adults reporting insufficient sleep (<7 hours): 42.1%
> Avg. mentally unhealthy days: 5.0 a month (US avg: 4.1 days a month)
> Adults with high blood pressure: 39.4% — 5th highest
> Residents 18+ who are obese: 34.6% — 19th highest
> Adults 20+ with diabetes: 12.7% — 7th highest
> Residents 18+ who report poor or fair health: 21.8% — 4th highest
> Poverty rate: 16.3% — 4th highest

2. West Virginia
> Adults reporting insufficient sleep (<7 hours): 42.5%
> Avg. mentally unhealthy days: 5.8 a month (US avg: 4.1 days a month)
> Adults with high blood pressure: 43.5% — the highest
> Residents 18+ who are obese: 37.8% — the lowest
> Adults 20+ with diabetes: 15.1% — the highest
> Residents 18+ who report poor or fair health: 23.6% — the highest
> Poverty rate: 16.0% — 6th highest
[in-text-ad-2]

1. Hawaii
> Adults reporting insufficient sleep (<7 hours): 43.2%
> Avg. mentally unhealthy days: 3.4 a month (US avg: 4.1 days a month)
> Adults with high blood pressure: 30.6% — 16th lowest
> Residents 18+ who are obese: 24.6% — 18th lowest
> Adults 20+ with diabetes: 11.1% — 17th highest
> Residents 18+ who report poor or fair health: 15.4% — 18th lowest
> Poverty rate: 9.3% — 6th lowest
Methodology
To determine the states where residents report getting the most and least sleep, 24/7 Tempo reviewed the share of adults in every state who report getting less than seven hours of sleep. These figures were obtained from the 2021 report by the County Health Rankings & Roadmaps, a Robert Wood Johnson Foundation and University of Wisconsin Population Health Institute joint program.
The share of adults in each state reporting frequent mental distress and the share of adults who report fair or poor health also came from the 2021 CHR report.
The obesity rates — the share of residents 18 and over who report a body mass index of 30 or greater — came from the 2021 CHR report.
The share of adults with high blood pressure was compiled by the United Health Foundation using 2017 Centers for Disease Control and Prevention data, the latest year for which data is available, from the Behavioral Risk Factor Surveillance System.
The poverty rate and median household income listed came from the U.S. Census Bureau’s 2019 American Community Survey and are 1-year estimates.
Travel Cards Are Getting Too Good To Ignore
Credit card companies are pulling out all the stops, with the issuers are offering insane travel rewards and perks.
We’re talking huge sign-up bonuses, points on every purchase, and benefits like lounge access, travel credits, and free hotel nights. For travelers, these rewards can add up to thousands of dollars in flights, upgrades, and luxury experiences every year.
It’s like getting paid to travel — and it’s available to qualified borrowers who know where to look.
We’ve rounded up some of the best travel credit cards on the market. Click here to see the list. Don’t miss these offers — they won’t be this good forever.
Thank you for reading! Have some feedback for us?
Contact the 24/7 Wall St. editorial team.
 24/7 Wall St.
 24/7 Wall St.
 24/7 Wall St.