
Pick any two cities or towns in the United States, and each will be home to people who work in very similar fields. Certain occupations in fields like education, sanitation, law enforcement, health care, and retail are common across the country as they are practical necessities.
Still, the occupational makeup of different parts of the country varies in other important ways that are influenced by the areas’ history, geography, natural resources, local laws, and demographics. These factors can have considerable economic implications and lay the foundation of a given area’s industry composition.
Using data from the Bureau of Economic Analysis, 24/7 Wall St. identified the largest industry in each state by contribution to overall GDP. Because real estate accounts for the largest share of GDP in most states, and to better highlight regional differences, the real estate industry was excluded from our analysis.
The strength of a given state’s overall economy often depends on the performance of its largest industry. For example, oil and gas extraction accounts for nearly one-quarter of Texas’ economic output, and as oil prices cratered in 2014 and continued to fall through 2016, Texas’ GDP remained effectively flat over those years even as the U.S. as a whole recorded growth. Here is a look at the state economies hit hardest by the COVID-19 recession.
It is important to note that the largest industry in each state can vary considerably by economic output, depending on the size of the state. For example, in New York, monetary authorities generated $174.1 billion in 2019, while in neighboring Vermont, the largest industry, ambulatory health care services, generated just $1.6 billion. Here is a look at the states with the best and worst economies.
Click here to see each state’s largest industry.
Click here to see our detailed methodology.

Alabama: Ambulatory health care services
> Industry GDP contribution: $10.4 billion (4.5% of total)
> Industry workforce: 100,031 (4.9% of total employment)
> 5-yr. industry GDP change: +17.6%
> Avg. industry salary: $64,553 (32.2% higher than avg. among all industries)
[in-text-ad]
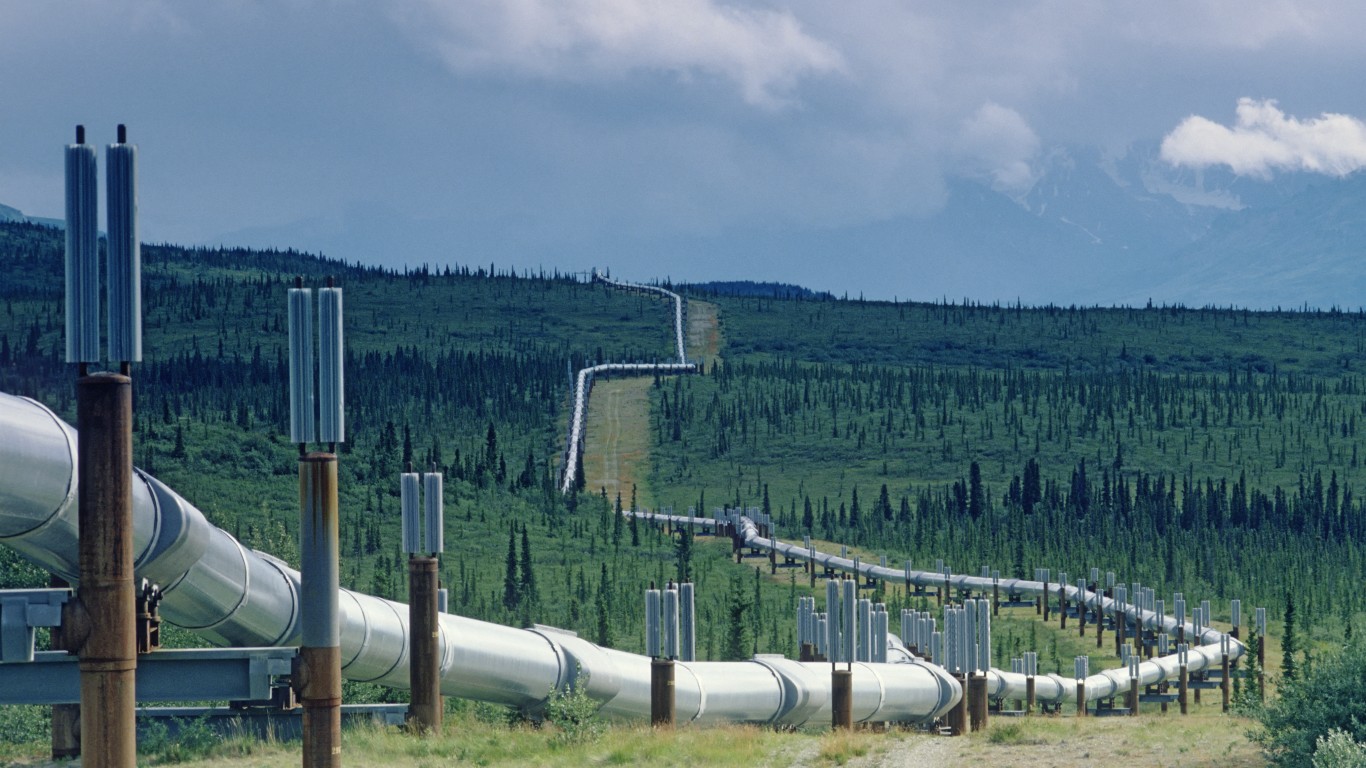
Alaska: Pipeline transportation
> Industry GDP contribution: $4.8 billion (8.9% of total)
> Industry workforce: N/A
> 5-yr. industry GDP change: +32.3%
> Avg. industry salary: N/A

Arizona: Ambulatory health care services
> Industry GDP contribution:> 5-yr. industry GDP change:</strong $17.0 billion (4.6% of total)
> Industry workforce: 172,433 (6.3% of total employment)
> 5-yr. industry GDP change: +25.5%
> Avg. industry salary: $63,809 (18.6% higher than avg. among all industries)

Arkansas: Ambulatory health care services
> Industry GDP contribution: $5.8 billion (4.4% of total)
> Industry workforce: 59,796 (4.7% of total employment)
> 5-yr. industry GDP change: +24.0%
> Avg. industry salary: $64,186 (41.2% higher than avg. among all industries)
[in-text-ad-2]

California: Computer and electronic product manufacturing
> Industry GDP contribution: $110.3 billion (3.5% of total)
> Industry workforce: 281,023 (1.6% of total employment)
> 5-yr. industry GDP change: +20.6%
> Avg. industry salary: $185,714 (160.3% higher than avg. among all industries)

Colorado: Ambulatory health care services
> Industry GDP contribution: $14.0 billion (3.6% of total)
> Industry workforce: 139,996 (5.2% of total employment)
> 5-yr. industry GDP change: +25.0%
> Avg. industry salary: $63,608 (2.9% higher than avg. among all industries)
[in-text-ad]

Connecticut: Insurance carriers and related activities
> Industry GDP contribution: $23.0 billion (8.0% of total)
> Industry workforce: 61,923 (3.6% of total employment)
> 5-yr. industry GDP change: +1.8%
> Avg. industry salary: $138,398 (98.4% higher than avg. among all industries)

Delaware: Monetary authorities- central bank, credit intermediation, and related services
> Industry GDP contribution: $13.6 billion (17.6% of total)
> Industry workforce: 7,291 (1.6% of total employment)
> 5-yr. industry GDP change: +27.5%
> Avg. industry salary: $98,802 (69.0% higher than avg. among all industries)

Florida: Ambulatory health care services
> Industry GDP contribution: $51.4 billion (4.6% of total)
> Industry workforce: 521,568 (6.2% of total employment)
> 5-yr. industry GDP change: +22.3%
> Avg. industry salary: $64,552 (24.8% higher than avg. among all industries)
[in-text-ad-2]

Georgia: Monetary authorities- central bank, credit intermediation, and related services
> Industry GDP contribution: $32.3 billion (5.2% of total)
> Industry workforce: 7,564 (0.2% of total employment)
> 5-yr. industry GDP change: +28.6%
> Avg. industry salary: $90,592 (63.9% higher than avg. among all industries)

Hawaii: Accommodation
> Industry GDP contribution: $6.2 billion (6.5% of total)
> Industry workforce: 42,793 (6.0% of total employment)
> 5-yr. industry GDP change: +38.0%
> Avg. industry salary: $52,973 (0.5% higher than avg. among all industries)
[in-text-ad]

Idaho: Farms
> Industry GDP contribution: $3.6 billion (4.3% of total)
> Industry workforce: 19,608 (2.8% of total employment)
> 5-yr. industry GDP change: +16.0%
> Avg. industry salary: $37,642 (15.0% lower than avg. among all industries)

Illinois: Insurance carriers and related activities
> Industry GDP contribution: $45.7 billion (5.2% of total)
> Industry workforce: 139,611 (2.3% of total employment)
> 5-yr. industry GDP change: +17.3%
> Avg. industry salary: $99,628 (61.8% higher than avg. among all industries)

Indiana: Chemical manufacturing
> Industry GDP contribution: $23.3 billion (6.1% of total)
> Industry workforce: 31,565 (1.0% of total employment)
> 5-yr. industry GDP change: +15.6%
> Avg. industry salary: $120,876 (147.7% higher than avg. among all industries)
[in-text-ad-2]

Iowa: Insurance carriers and related activities
> Industry GDP contribution: $18.5 billion (9.5% of total)
> Industry workforce: 52,046 (3.2% of total employment)
> 5-yr. industry GDP change: +5.0%
> Avg. industry salary: $84,186 (73.0% higher than avg. among all industries)

Kansas: Rental and leasing services and lessors of nonfinancial intangible assets
> Industry GDP contribution: $6.7 billion (3.8% of total)
> Industry workforce: 3,835 (0.3% of total employment)
> 5-yr. industry GDP change: +41.6%
> Avg. industry salary: $54,411 (13.2% higher than avg. among all industries)
[in-text-ad]

Kentucky: Motor vehicles, bodies and trailers, and parts manufacturing
> Industry GDP contribution: $9.3 billion (4.3% of total)
> Industry workforce: 61,431 (3.1% of total employment)
> 5-yr. industry GDP change: +14.6%
> Avg. industry salary: $66,973 (40.3% higher than avg. among all industries)
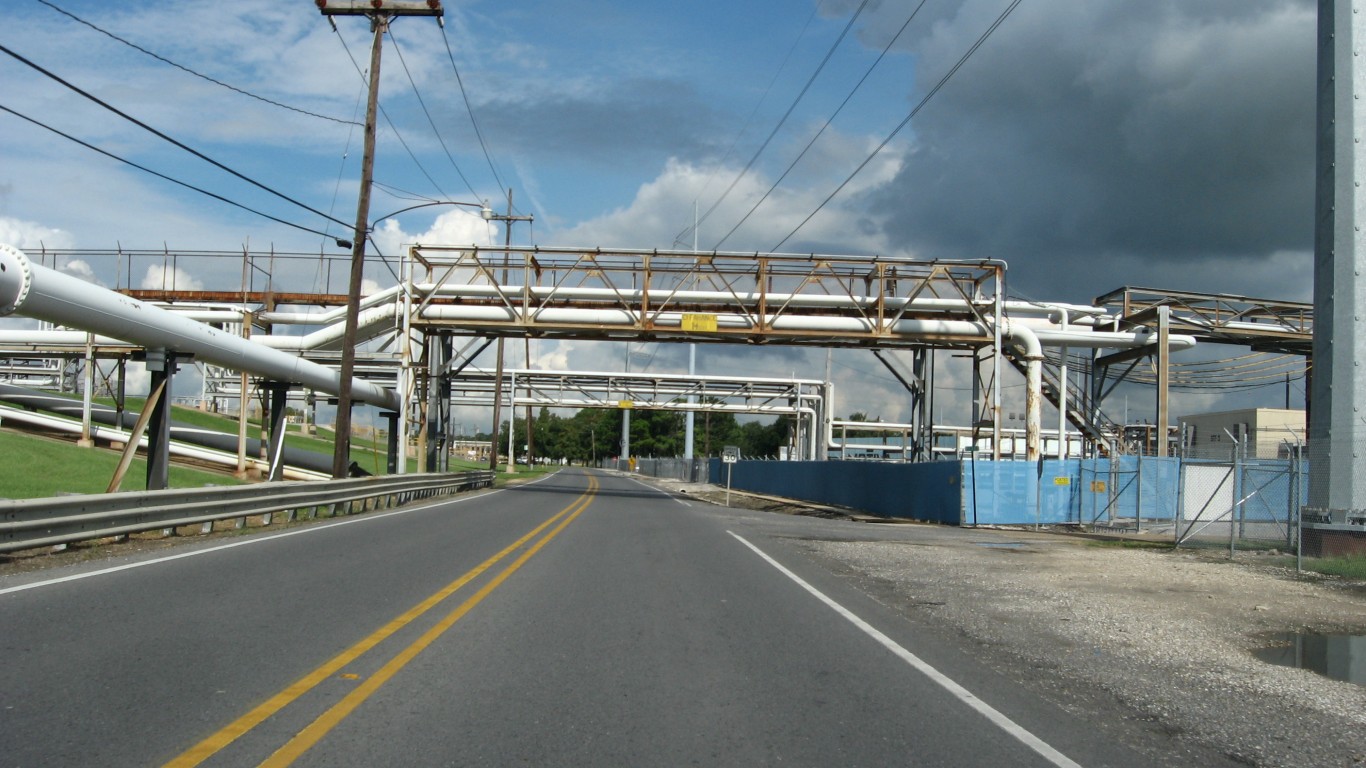
Louisiana: Petroleum and coal products manufacturing
> Industry GDP contribution: $20.8 billion (8.1% of total)
> Industry workforce: 11,379 (0.5% of total employment)
> 5-yr. industry GDP change: +5.0%
> Avg. industry salary: $136,816 (177.6% higher than avg. among all industries)

Maine: Hospitals
> Industry GDP contribution: $3.3 billion (4.8% of total)
> Industry workforce: 33,559 (5.4% of total employment)
> 5-yr. industry GDP change: +7.3%
> Avg. industry salary: $64,486 (36.7% higher than avg. among all industries)
[in-text-ad-2]
Maryland: Ambulatory health care services
> Industry GDP contribution: $15.8 billion (3.7% of total)
> Industry workforce: 150,609 (5.4% of total employment)
> 5-yr. industry GDP change: +17.8%
> Avg. industry salary: $66,638 (5.8% higher than avg. among all industries)

Massachusetts: Hospitals
> Industry GDP contribution: $22.1 billion (3.7% of total)
> Industry workforce: 198,546 (5.5% of total employment)
> 5-yr. industry GDP change: +13.0%
> Avg. industry salary: $76,723 (1.7% higher than avg. among all industries)
[in-text-ad]

Michigan: Motor vehicles, bodies and trailers, and parts manufacturing
> Industry GDP contribution: $40.9 billion (7.6% of total)
> Industry workforce: 181,247 (4.2% of total employment)
> 5-yr. industry GDP change: +8.8%
> Avg. industry salary: $82,813 (50.6% higher than avg. among all industries)

Minnesota: Ambulatory health care services
> Industry GDP contribution: $17.0 billion (4.4% of total)
> Industry workforce: 156,050 (5.3% of total employment)
> 5-yr. industry GDP change: +22.6%
> Avg. industry salary: $76,583 (28.4% higher than avg. among all industries)

Mississippi: Ambulatory health care services
> Industry GDP contribution: $5.1 billion (4.4% of total)
> Industry workforce: 51,535 (4.3% of total employment)
> 5-yr. industry GDP change: +16.0%
> Avg. industry salary: $59,647 (46.6% higher than avg. among all industries)
[in-text-ad-2]
Missouri: Ambulatory health care services
> Industry GDP contribution: $12.3 billion (3.7% of total)
> Industry workforce: 120,333 (4.2% of total employment)
> 5-yr. industry GDP change: +17.0%
> Avg. industry salary: N/A

Montana: Hospitals
> Industry GDP contribution: $2.5 billion (4.7% of total)
> Industry workforce: 25,583 (5.3% of total employment)
> 5-yr. industry GDP change: +23.8%
> Avg. industry salary: $65,511 (46.0% higher than avg. among all industries)
[in-text-ad]

Nebraska: Insurance carriers and related activities
> Industry GDP contribution: $11.1 billion (8.6% of total)
> Industry workforce: 30,137 (2.9% of total employment)
> 5-yr. industry GDP change: +32.9%
> Avg. industry salary: $72,765 (52.1% higher than avg. among all industries)

Nevada: Accommodation
> Industry GDP contribution: $17.1 billion (9.6% of total)
> Industry workforce: 189,499 (14.7% of total employment)
> 5-yr. industry GDP change: +2.3%
> Avg. industry salary: $41,794 (18.7% lower than avg. among all industries)

New Hampshire: Insurance carriers and related activities
> Industry GDP contribution: $4.3 billion (4.9% of total)
> Industry workforce: 13,599 (2.0% of total employment)
> 5-yr. industry GDP change: +-1.8%
> Avg. industry salary: $92,107 (57.0% higher than avg. among all industries)
[in-text-ad-2]

New Jersey: Ambulatory health care services
> Industry GDP contribution: $27.2 billion (4.3% of total)
> Industry workforce: 244,625 (6.0% of total employment)
> 5-yr. industry GDP change: +18.3%
> Avg. industry salary: $64,942 (3.6% lower than avg. among all industries)
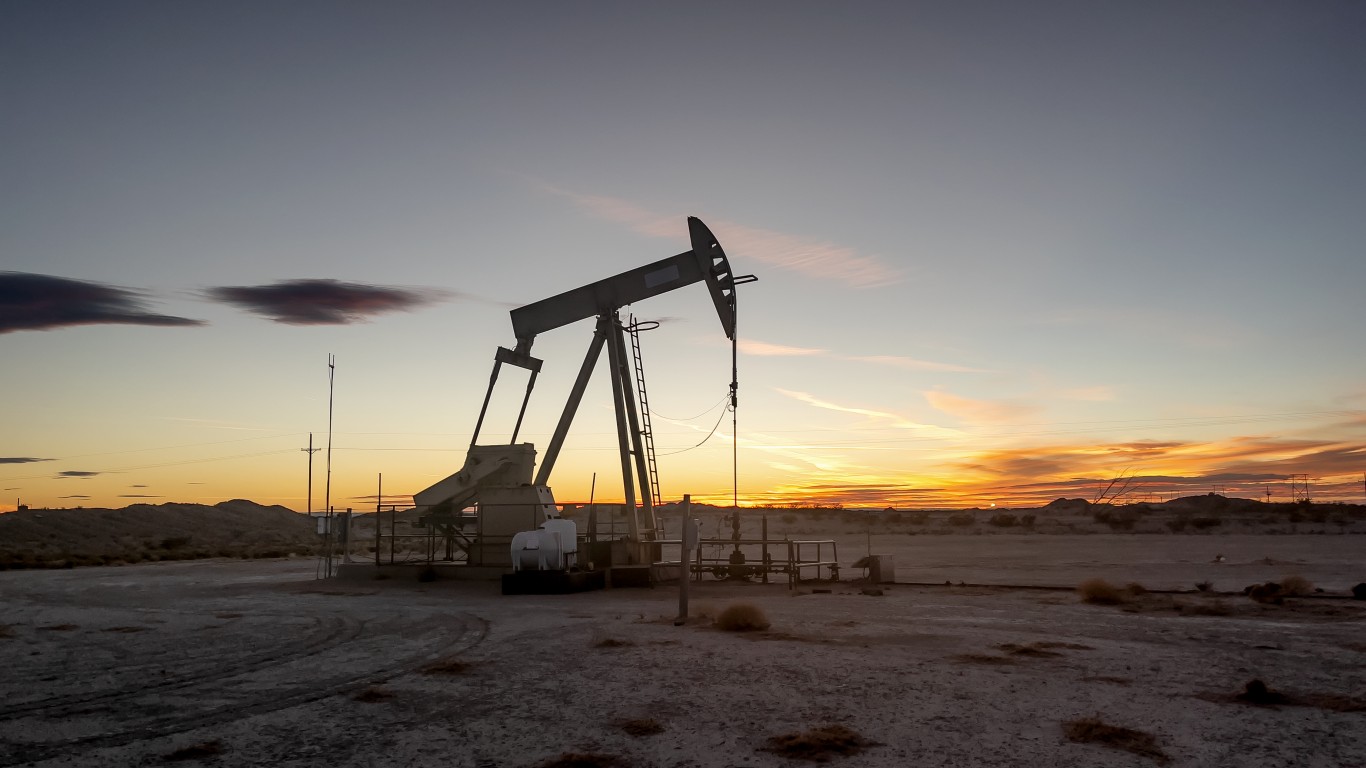
New Mexico: Oil and gas extraction
> Industry GDP contribution: $7.5 billion (7.2% of total)
> Industry workforce: 4,372 (0.5% of total employment)
> 5-yr. industry GDP change: +75.7%
> Avg. industry salary: $117,205 (149.1% higher than avg. among all industries)
[in-text-ad]

New York: Monetary authorities- central bank, credit intermediation, and related services
> Industry GDP contribution: $174.1 billion (9.8% of total)
> Industry workforce: 97,155 (1.0% of total employment)
> 5-yr. industry GDP change: +28.5%
> Avg. industry salary: $160,912 (113.5% higher than avg. among all industries)

North Carolina: Monetary authorities- central bank, credit intermediation, and related services
> Industry GDP contribution: $34.9 billion (5.9% of total)
> Industry workforce: 9,664 (0.2% of total employment)
> 5-yr. industry GDP change: +27.8%
> Avg. industry salary: $108,240 (106.6% higher than avg. among all industries)
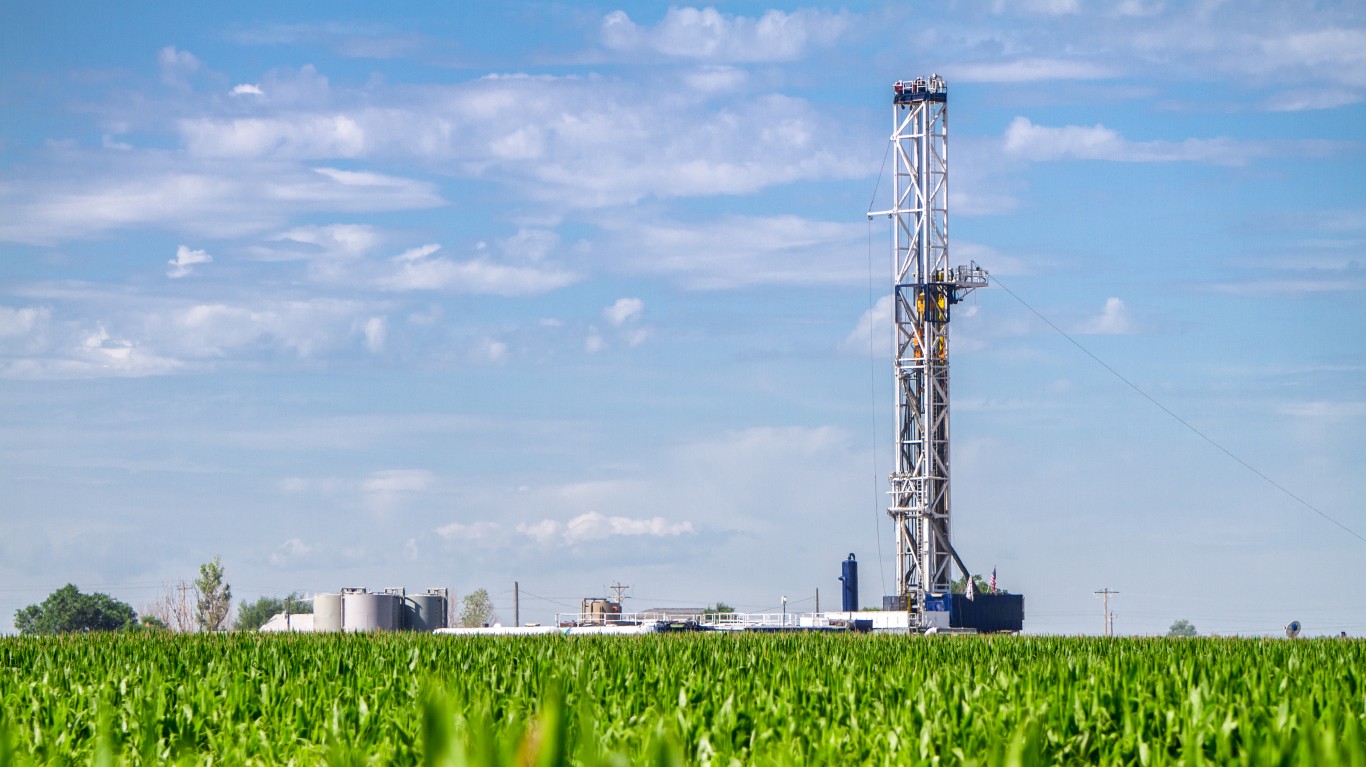
North Dakota: Support activities for mining
> Industry GDP contribution: $3.4 billion (5.9% of total)
> Industry workforce: 16,486 (3.5% of total employment)
> 5-yr. industry GDP change: +-3.7%
> Avg. industry salary: $104,549 (93.2% higher than avg. among all industries)
[in-text-ad-2]

Ohio: Monetary authorities- central bank, credit intermediation, and related services
> Industry GDP contribution: $32.1 billion (4.6% of total)
> Industry workforce: 32,140 (0.6% of total employment)
> 5-yr. industry GDP change: +32.4%
> Avg. industry salary: $72,365 (38.8% higher than avg. among all industries)

Oklahoma: Oil and gas extraction
> Industry GDP contribution: $17.7 billion (8.7% of total)
> Industry workforce: 16,279 (1.0% of total employment)
> 5-yr. industry GDP change: +9.1%
> Avg. industry salary: $145,703 (203.4% higher than avg. among all industries)
[in-text-ad]

Oregon: Computer and electronic product manufacturing
> Industry GDP contribution: $16.1 billion (6.3% of total)
> Industry workforce: 38,576 (2.1% of total employment)
> 5-yr. industry GDP change: +15.5%
> Avg. industry salary: $136,636 (148.3% higher than avg. among all industries)

Pennsylvania: Broadcasting (except Internet) and telecommunications
> Industry GDP contribution: $37.2 billion (4.6% of total)
> Industry workforce: 35,033 (0.6% of total employment)
> 5-yr. industry GDP change: +9.7%
> Avg. industry salary: $96,788 (68.3% higher than avg. among all industries)

Rhode Island: Insurance carriers and related activities
> Industry GDP contribution: $3.2 billion (5.2% of total)
> Industry workforce: 10,612 (2.1% of total employment)
> 5-yr. industry GDP change: +11.7%
> Avg. industry salary: $86,263 (57.1% higher than avg. among all industries)
[in-text-ad-2]

South Carolina: Administrative and support and waste management and remediation services
> Industry GDP contribution: $9.9 billion (4.0% of total)
> Industry workforce: 171,193 (8.2% of total employment)
> 5-yr. industry GDP change: +16.7%
> Avg. industry salary: $35,086 (24.4% lower than avg. among all industries)

South Dakota: Monetary authorities- central bank, credit intermediation, and related services
> Industry GDP contribution: $8.2 billion (15.0% of total)
> Industry workforce: 53,791 (12.0% of total employment)
> 5-yr. industry GDP change: +29.8%
> Avg. industry salary: $65,539 (45.2% higher than avg. among all industries)
[in-text-ad]

Tennessee: Ambulatory health care services
> Industry GDP contribution: $18.2 billion (4.8% of total)
> Industry workforce: 155,995 (5.2% of total employment)
> 5-yr. industry GDP change: +17.1%
> Avg. industry salary: $66,230 (28.1% higher than avg. among all industries)
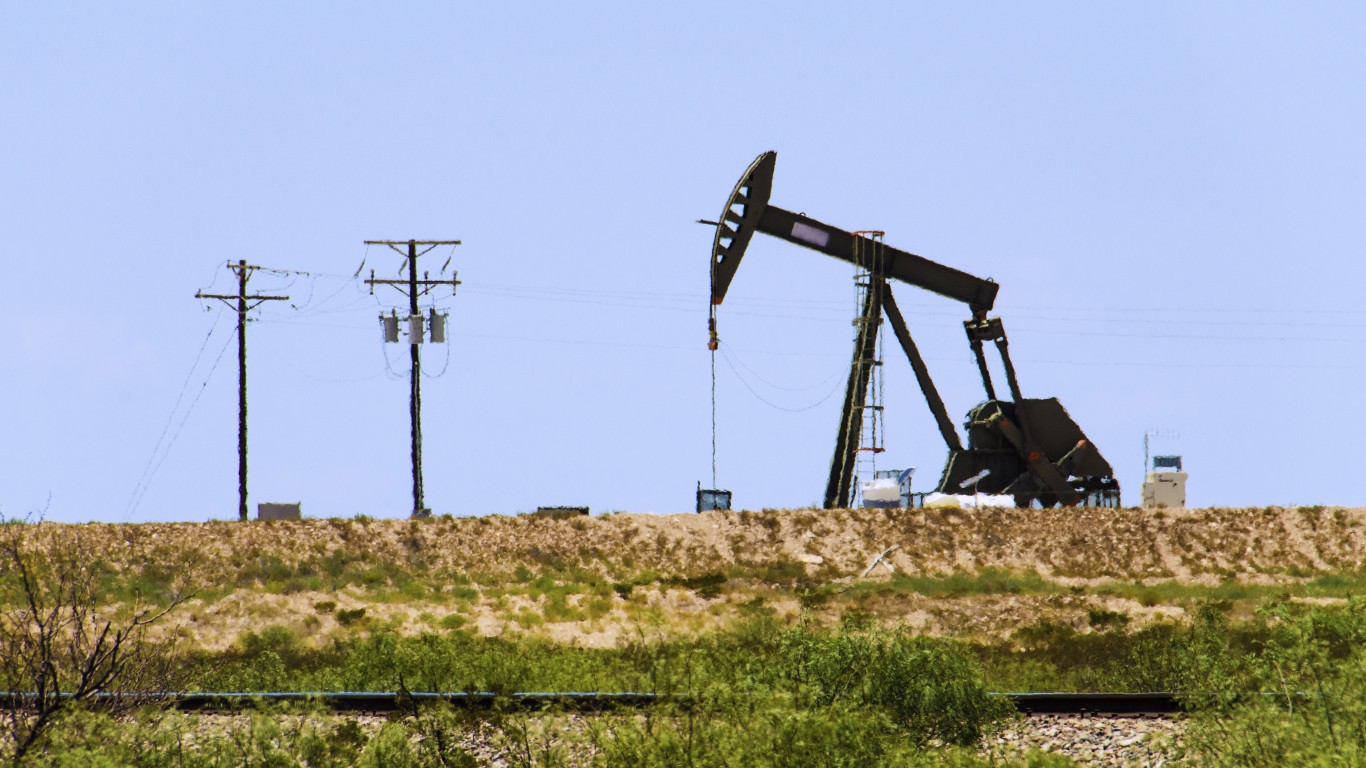
Texas: Oil and gas extraction
> Industry GDP contribution: $111.6 billion (6.1% of total)
> Industry workforce: 76,049 (0.6% of total employment)
> 5-yr. industry GDP change: +24.1%
> Avg. industry salary: $207,903 (247.7% higher than avg. among all industries)

Utah: Monetary authorities- central bank, credit intermediation, and related services
> Industry GDP contribution: $11.1 billion (5.8% of total)
> Industry workforce: 4,171 (0.3% of total employment)
> 5-yr. industry GDP change: +32.1%
> Avg. industry salary: $71,347 (40.5% higher than avg. among all industries)
[in-text-ad-2]

Vermont: Ambulatory health care services
> Industry GDP contribution: $1.6 billion (4.8% of total)
> Industry workforce: 17,271 (5.3% of total employment)
> 5-yr. industry GDP change: +15.5%
> Avg. industry salary: $60,521 (22.7% higher than avg. among all industries)

Virginia: Computer systems design and related services
> Industry GDP contribution: $28.6 billion (5.1% of total)
> Industry workforce: N/A
> 5-yr. industry GDP change: +23.2%
> Avg. industry salary: $125,773 (108.9% higher than avg. among all industries)
[in-text-ad]

Washington: Publishing industries (except Internet)
> Industry GDP contribution: $54.0 billion (8.8% of total)
> Industry workforce: 74,919 (2.2% of total employment)
> 5-yr. industry GDP change: +58.9%
> Avg. industry salary: $246,039 (253.5% higher than avg. among all industries)

West Virginia: Mining (except oil and gas)
> Industry GDP contribution: $4.3 billion (5.4% of total)
> Industry workforce: 14,258 (1.9% of total employment)
> 5-yr. industry GDP change: +6.2%
> Avg. industry salary: $87,510 (87.7% higher than avg. among all industries)

Wisconsin: Insurance carriers and related activities
> Industry GDP contribution: $18.9 billion (5.4% of total)
> Industry workforce: 71,709 (2.4% of total employment)
> 5-yr. industry GDP change: +7.8%
> Avg. industry salary: $78,377 (55.5% higher than avg. among all industries)
[in-text-ad-2]

Wyoming: Mining (except oil and gas)
> Industry GDP contribution: $3.7 billion (9.2% of total)
> Industry workforce: 7,835 (2.6% of total employment)
> 5-yr. industry GDP change: +19.0%
> Avg. industry salary: $95,068 (90.6% higher than avg. among all industries)
Methodology
To identify the largest industry in each state, 24/7 Wall St. reviewed each state’s industries and their respective GDP contributions from the Bureau of Economic Analysis. All BEA data is as of 2019, the most recent period for which detailed data is available. With only a few exceptions, the largest industry in each state is real estate. In order to identify regional industrial differences, we excluded the real estate sector in our examination. All government sectors were also excluded. Only industries on the same subsector level were included, and as a result, broader categories such as manufacturing, construction and retail were not considered. Employment and wage figures for private employees in each industry came from the Quarterly Census of Employment and Wages. The QCEW and BEA industry data were aligned according to their North American Industry Classification System codes.
Are You Still Paying With a Debit Card?
The average American spends $17,274 on debit cards a year, and it’s a HUGE mistake. First, debit cards don’t have the same fraud protections as credit cards. Once your money is gone, it’s gone. But more importantly you can actually get something back from this spending every time you swipe.
Issuers are handing out wild bonuses right now. With some you can earn up to 5% back on every purchase. That’s like getting a 5% discount on everything you buy!
Our top pick is kind of hard to imagine. Not only does it pay up to 5% back, it also includes a $200 cash back reward in the first six months, a 0% intro APR, and…. $0 annual fee. It’s quite literally free money for any one that uses a card regularly. Click here to learn more!
Flywheel Publishing has partnered with CardRatings to provide coverage of credit card products. Flywheel Publishing and CardRatings may receive a commission from card issuers.
Thank you for reading! Have some feedback for us?
Contact the 24/7 Wall St. editorial team.
 24/7 Wall St.
 24/7 Wall St.
 24/7 Wall St.

 24/7 Wall St.
 24/7 Wall St.
 24/7 Wall St.
 24/7 Wall St.
 24/7 Wall St.


