The U.S. Census Bureau recognizes 384 metropolitan areas, based on its population cutoff. Among the reasons the data on metropolitan areas is useful is that 86% of the American population live in these cities. In aggregate, the population of U.S. metro areas grew by 9% between 2010 and 2020.
Not all cities are growing, however. To identify the fastest shrinking cities in America, 24/7 Wall St. reviewed the change in resident population in all 384 metropolitan statistical areas from 2010 to 2020. The fastest shrinking city was far from the average growth for all metros. The population of Pine Bluff, Arkansas, dropped from 100,258 in 2010 to 86,278 in 2020 — a 14% decline.
In some of the recently released results from the 2020 census, one section was titled, “Around Four-Fifths of All U.S. Metro Areas Grew Between 2010 and 2020.” This means that about 75 metros shrank in population. The data also showed that the entire U.S. population grew at the slowest rate since the 1930s and that there is a wide contrast between the population growth rates among metropolitan areas, with some cities reporting negative growth.
Many other cities on the list are old industrial metros where economic conditions have been challenging for decades. This included Elmira, New York, where the population dropped 7% to 82,622, and Youngstown, Ohio, where the population dropped 6% to 531,420. See if they are among the metro with the highest poverty rate in every state.
Many of the fastest shrinking cities are in West Virginia, including four of the top 10. The population of Charlestown, the third-fastest shrinking city, dropped 9% to 254,145 between 2010 and 2020. The fifth-fastest shrinking city was Beckley, where the population declined 8% to 114,982. In the sixth fastest shrinking city, Weirton, the population shrank 7% to 115,184. And in the seventh-fastest shrinking city, Wheeling, the population also dropped 7% to 137,217. Some of these are among the cities with the most people on food stamps.
Other data used such as population figures, educational attainment rates, median household income, and the population with health insurance also come from the Census Bureau’s American Community Survey one-year estimates.
Click here to see the fastest shrinking city in America.
50. Niles, MI
> 2010-2020 population change: -2.4%
> 2010 population: 156,813
> 2020 population: 153,025
[in-text-ad]

49. Syracuse, NY
> 2010-2020 population change: -2.5%
> 2010 population: 662,577
> 2020 population: 646,038

48. Williamsport, PA
> 2010-2020 population change: -2.5%
> 2010 population: 116,111
> 2020 population: 113,209

47. Kingston, NY
> 2010-2020 population change: -2.6%
> 2010 population: 182,493
> 2020 population: 177,716
[in-text-ad-2]
46. Carbondale-Marion, IL
> 2010-2020 population change: -2.7%
> 2010 population: 139,157
> 2020 population: 135,448

45. Lawton, OK
> 2010-2020 population change: -2.7%
> 2010 population: 130,291
> 2020 population: 126,775
[in-text-ad]

44. Monroe, LA
> 2010-2020 population change: -2.7%
> 2010 population: 204,420
> 2020 population: 198,836

43. New Bern, NC
> 2010-2020 population change: -2.8%
> 2010 population: 126,802
> 2020 population: 123,198

42. Mansfield, OH
> 2010-2020 population change: -2.9%
> 2010 population: 124,475
> 2020 population: 120,891
[in-text-ad-2]

41. Sierra Vista-Douglas, AZ
> 2010-2020 population change: -3.0%
> 2010 population: 131,346
> 2020 population: 127,450
40. Bloomsburg-Berwick, PA
> 2010-2020 population change: -3.1%
> 2010 population: 85,562
> 2020 population: 82,884
[in-text-ad]

39. Chico, CA
> 2010-2020 population change: -3.3%
> 2010 population: 220,000
> 2020 population: 212,744
 24/7 Wall St.
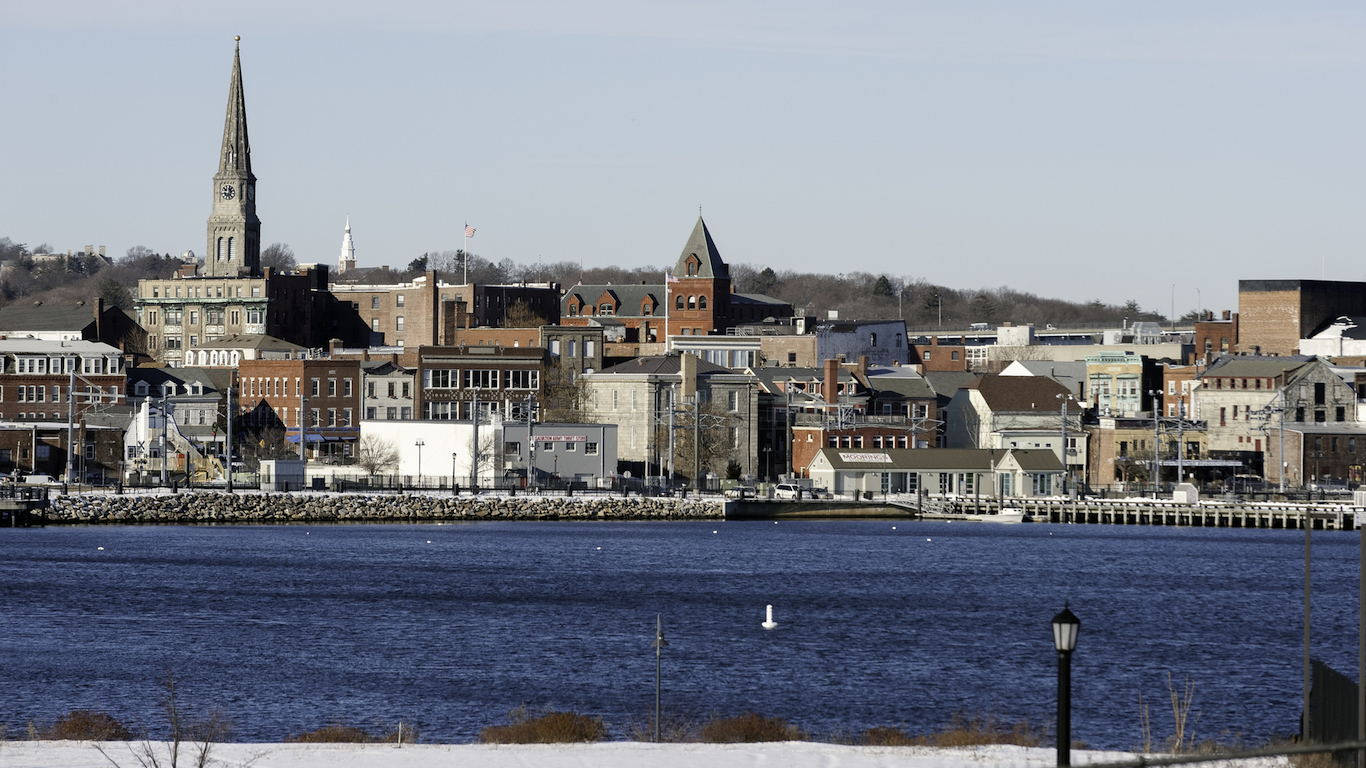
38. Norwich-New London, CT
> 2010-2020 population change: -3.3%
> 2010 population: 274,055
> 2020 population: 264,999

37. Springfield, OH
> 2010-2020 population change: -3.4%
> 2010 population: 138,333
> 2020 population: 133,593
[in-text-ad-2]

36. Glens Falls, NY
> 2010-2020 population change: -3.5%
> 2010 population: 128,923
> 2020 population: 124,362

35. Muncie, IN
> 2010-2020 population change: -3.6%
> 2010 population: 117,671
> 2020 population: 113,454
[in-text-ad]

34. Utica-Rome, NY
> 2010-2020 population change: -3.7%
> 2010 population: 299,397
> 2020 population: 288,291

33. St. Joseph, MO-KS
> 2010-2020 population change: -3.7%
> 2010 population: 127,329
> 2020 population: 122,556

32. Lima, OH
> 2010-2020 population change: -4.1%
> 2010 population: 106,331
> 2020 population: 101,980
[in-text-ad-2]

31. Atlantic City-Hammonton, NJ
> 2010-2020 population change: -4.2%
> 2010 population: 274,549
> 2020 population: 262,945

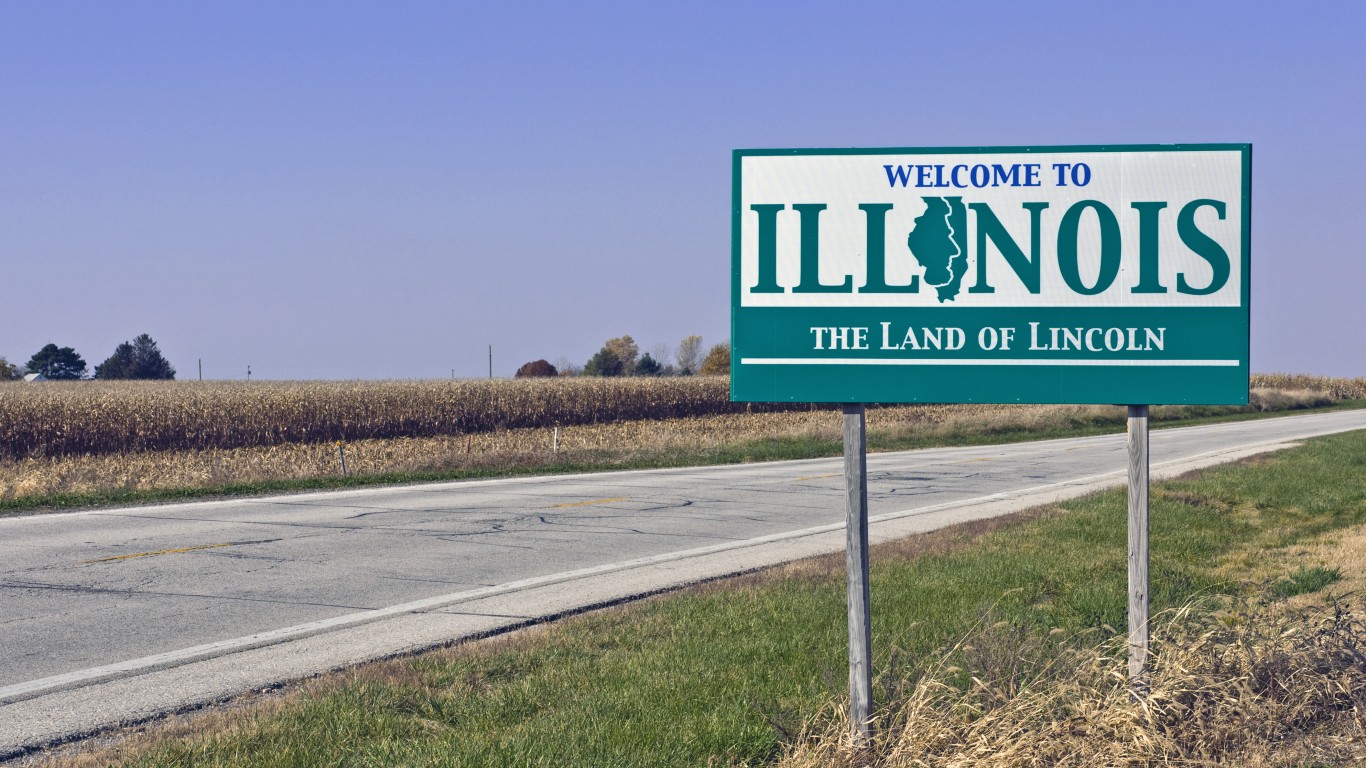
30. Kankakee, IL
> 2010-2020 population change: -4.3%
> 2010 population: 113,449
> 2020 population: 108,594
[in-text-ad]
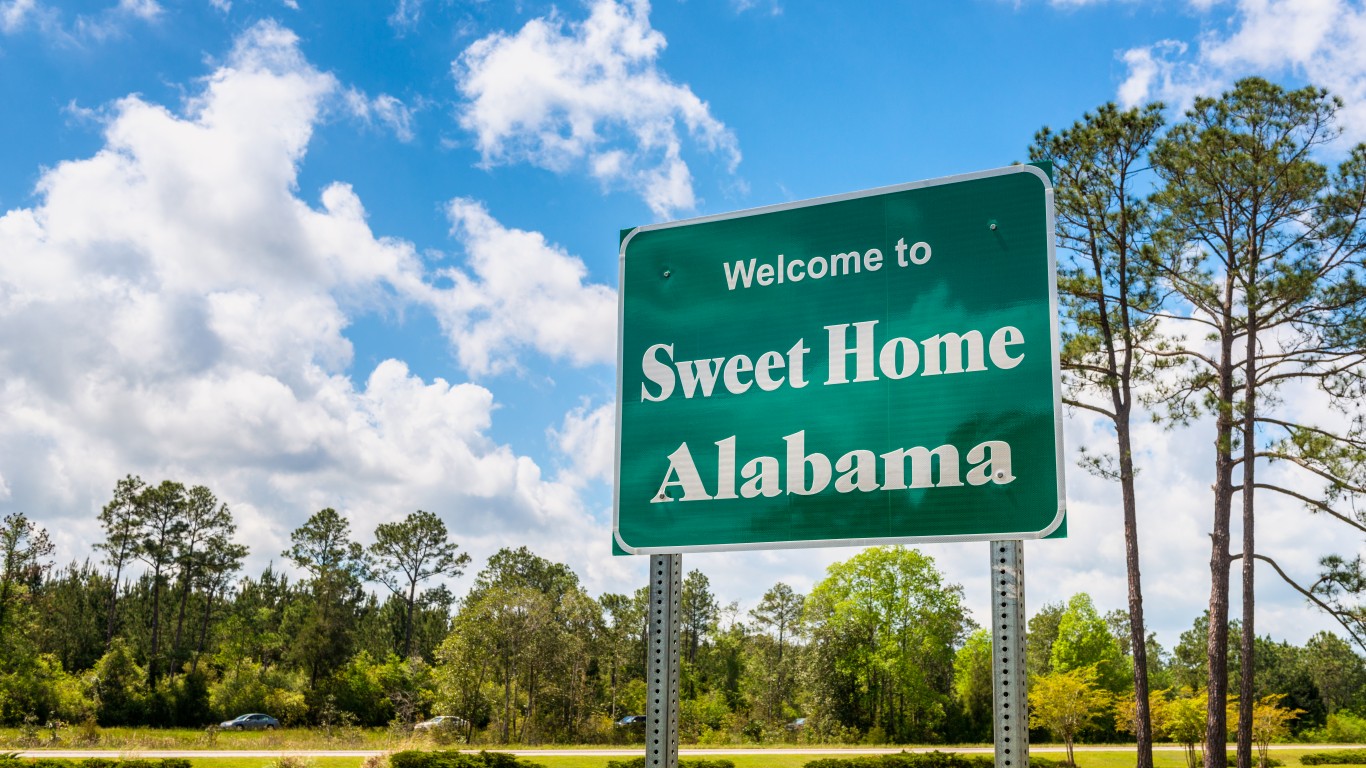
29. Anniston-Oxford, AL
> 2010-2020 population change: -4.3%
> 2010 population: 118,572
> 2020 population: 113,469
 24/7 Wall St.
28. Erie, PA
> 2010-2020 population change: -4.3%
> 2010 population: 280,566
> 2020 population: 268,426
27. Parkersburg-Vienna, WV
> 2010-2020 population change: -4.3%
> 2010 population: 92,673
> 2020 population: 88,643
[in-text-ad-2]

26. Rockford, IL
> 2010-2020 population change: -4.4%
> 2010 population: 349,431
> 2020 population: 334,072

25. Rocky Mount, NC
> 2010-2020 population change: -4.4%
> 2010 population: 152,392
> 2020 population: 145,688
[in-text-ad]

24. Huntington-Ashland, WV-KY-OH
> 2010-2020 population change: -4.5%
> 2010 population: 370,908
> 2020 population: 354,085
 24/7 Wall St.
23. Peoria, IL
> 2010-2020 population change: -4.7%
> 2010 population: 416,255
> 2020 population: 396,781

22. Altoona, PA
> 2010-2020 population change: -4.8%
> 2010 population: 127,089
> 2020 population: 121,007
[in-text-ad-2]

21. Flint, MI
> 2010-2020 population change: -4.9%
> 2010 population: 425,790
> 2020 population: 404,794
20. Bay City, MI
> 2010-2020 population change: -5.0%
> 2010 population: 107,771
> 2020 population: 102,387
[in-text-ad]

19. Pittsfield, MA
> 2010-2020 population change: -5.1%
> 2010 population: 131,219
> 2020 population: 124,571

18. Saginaw, MI
> 2010-2020 population change: -5.1%
> 2010 population: 200,169
> 2020 population: 189,868

17. Farmington, NM
> 2010-2020 population change: -5.2%
> 2010 population: 130,044
> 2020 population: 123,312
[in-text-ad-2]

16. Albany, GA
> 2010-2020 population change: -5.6%
> 2010 population: 153,857
> 2020 population: 145,206

15. Binghamton, NY
> 2010-2020 population change: -5.7%
> 2010 population: 251,725
> 2020 population: 237,324
[in-text-ad]
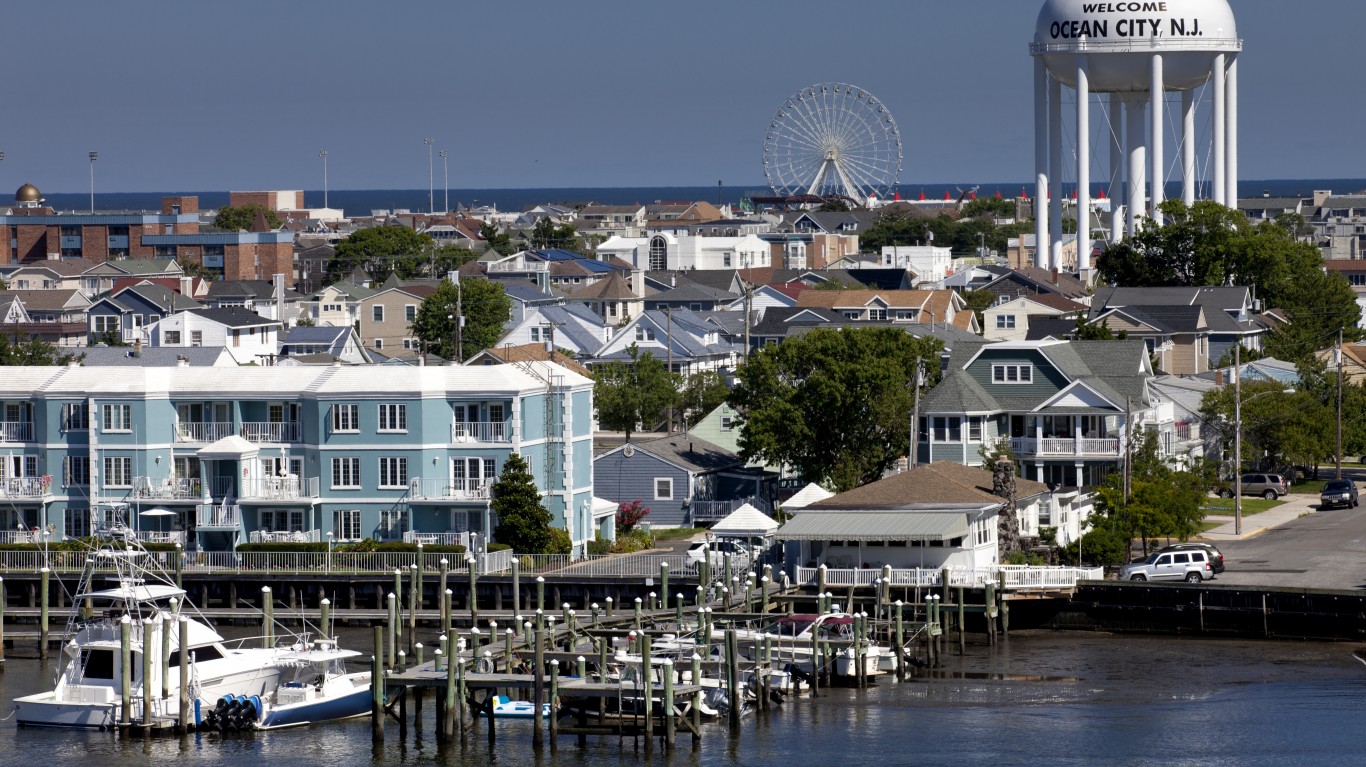
14. Ocean City, NJ
> 2010-2020 population change: -5.9%
> 2010 population: 97,265
> 2020 population: 91,546
 24/7 Wall St.
13. Youngstown-Warren-Boardman, OH-PA
> 2010-2020 population change: -6.1%
> 2010 population: 565,773
> 2020 population: 531,420
12. Vineland-Bridgeton, NJ
> 2010-2020 population change: -6.3%
> 2010 population: 156,898
> 2020 population: 147,008
[in-text-ad-2]
11. Cumberland, MD-WV
> 2010-2020 population change: -6.3%
> 2010 population: 103,299
> 2020 population: 96,779
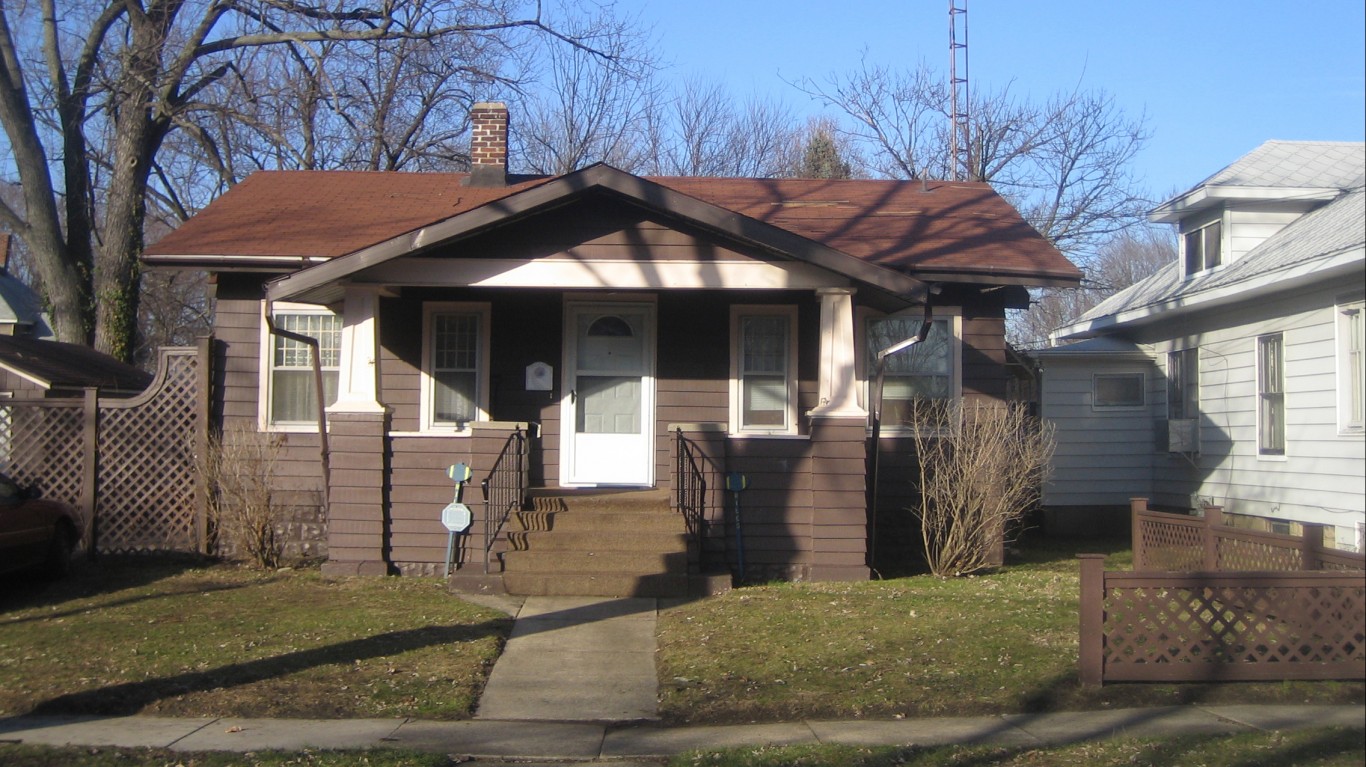
10. Elmira, NY
> 2010-2020 population change: -7.0%
> 2010 population: 88,830
> 2020 population: 82,622
[in-text-ad]

9. Watertown-Fort Drum, NY
> 2010-2020 population change: -7.0%
> 2010 population: 116,229
> 2020 population: 108,095
8. Decatur, IL
> 2010-2020 population change: -7.0%
> 2010 population: 110,768
> 2020 population: 103,015

7. Wheeling, WV-OH
> 2010-2020 population change: -7.3%
> 2010 population: 147,950
> 2020 population: 137,217
[in-text-ad-2]

6. Weirton-Steubenville, WV-OH
> 2010-2020 population change: -7.4%
> 2010 population: 124,454
> 2020 population: 115,184

5. Beckley, WV
> 2010-2020 population change: -7.9%
> 2010 population: 124,898
> 2020 population: 114,982
[in-text-ad]
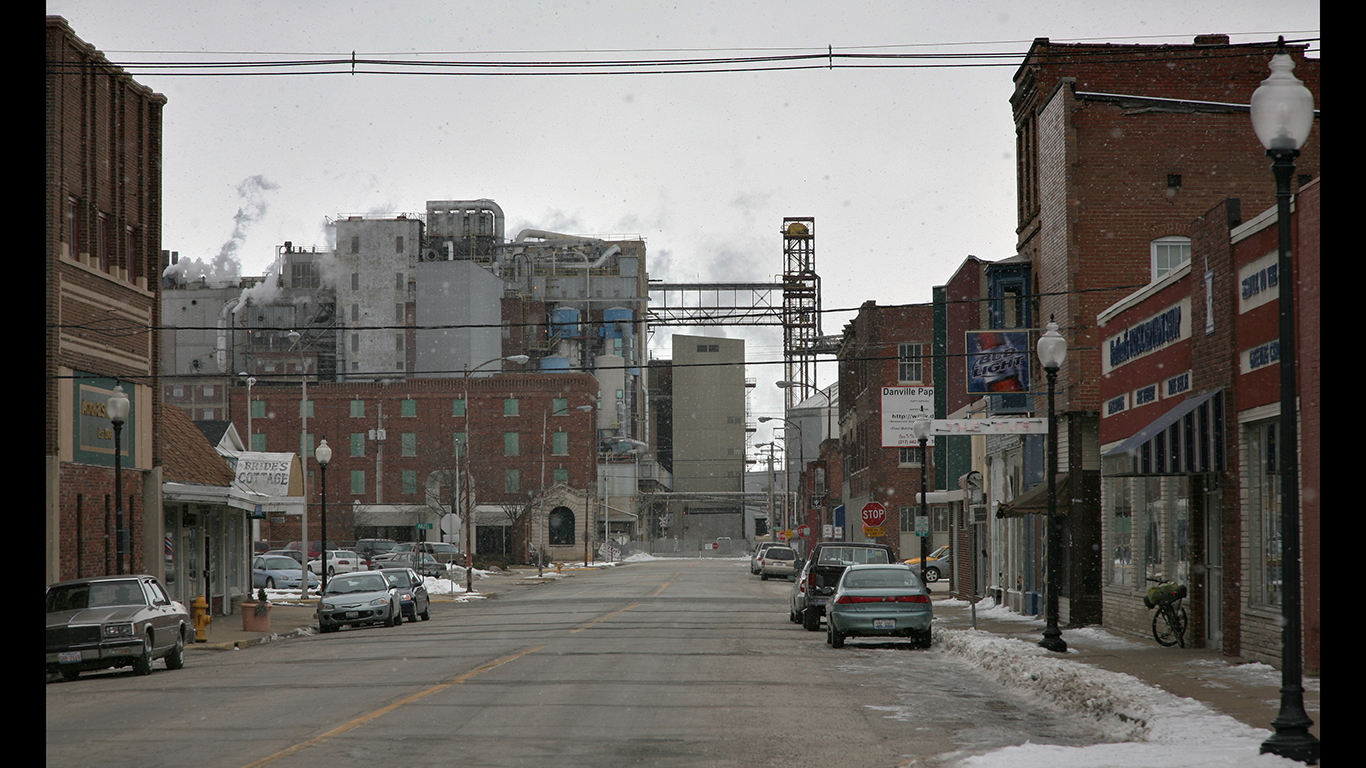
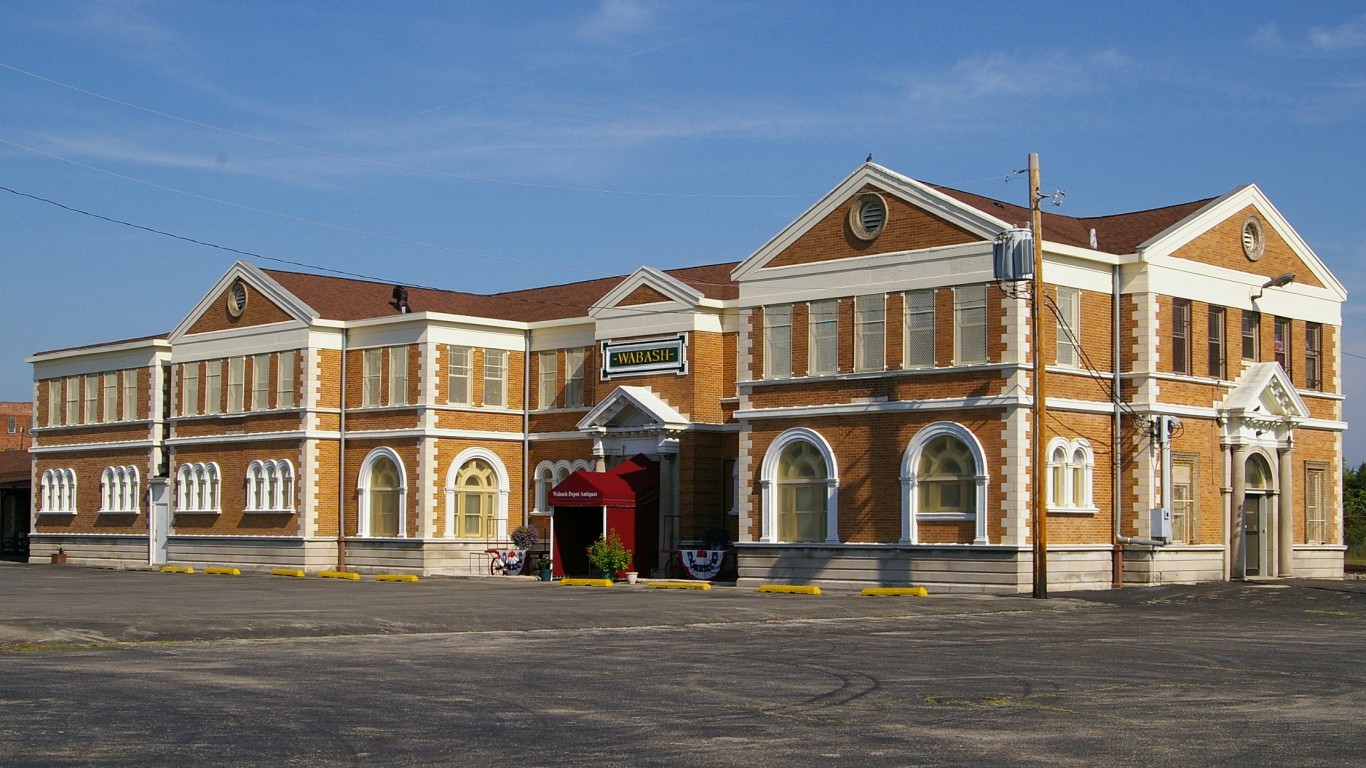
4. Danville, IL
> 2010-2020 population change: -8.3%
> 2010 population: 81,625
> 2020 population: 74,855

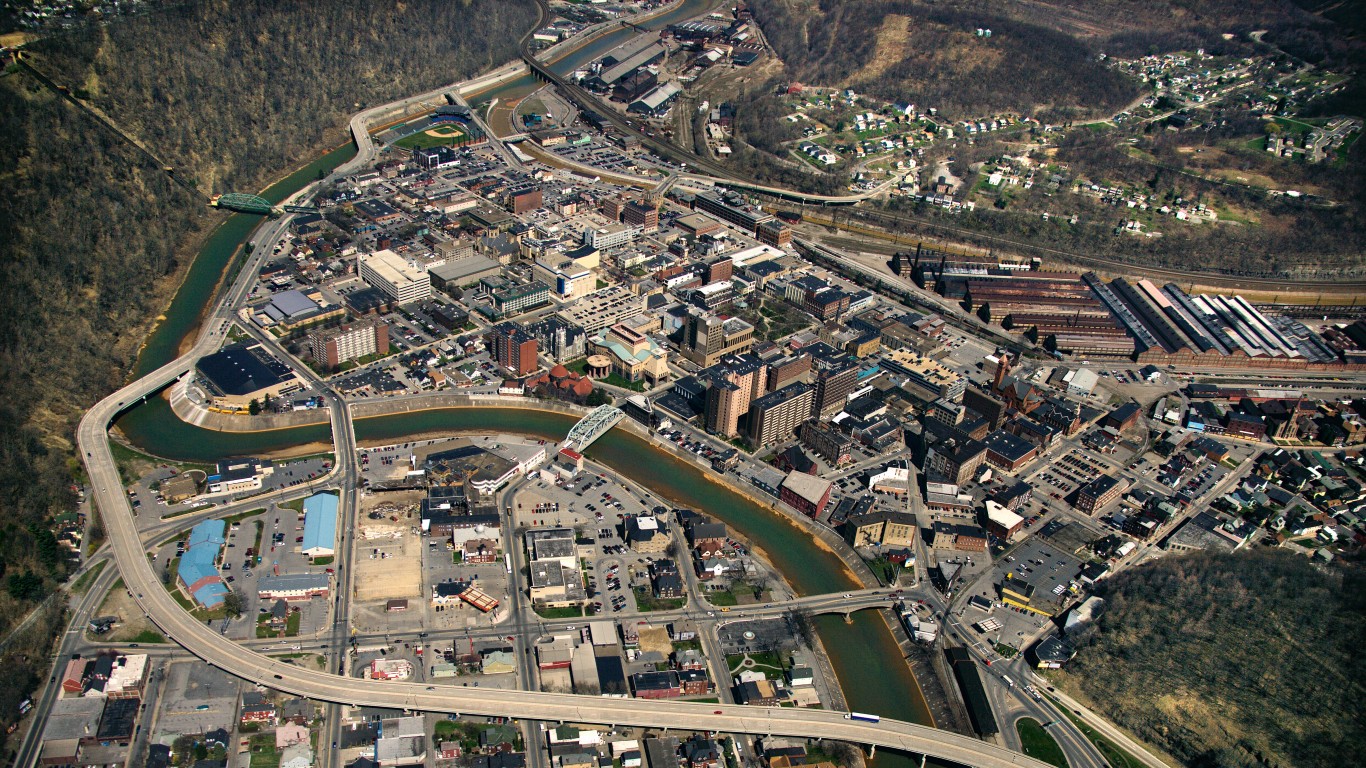
3. Charleston, WV
> 2010-2020 population change: -8.6%
> 2010 population: 278,009
> 2020 population: 254,145
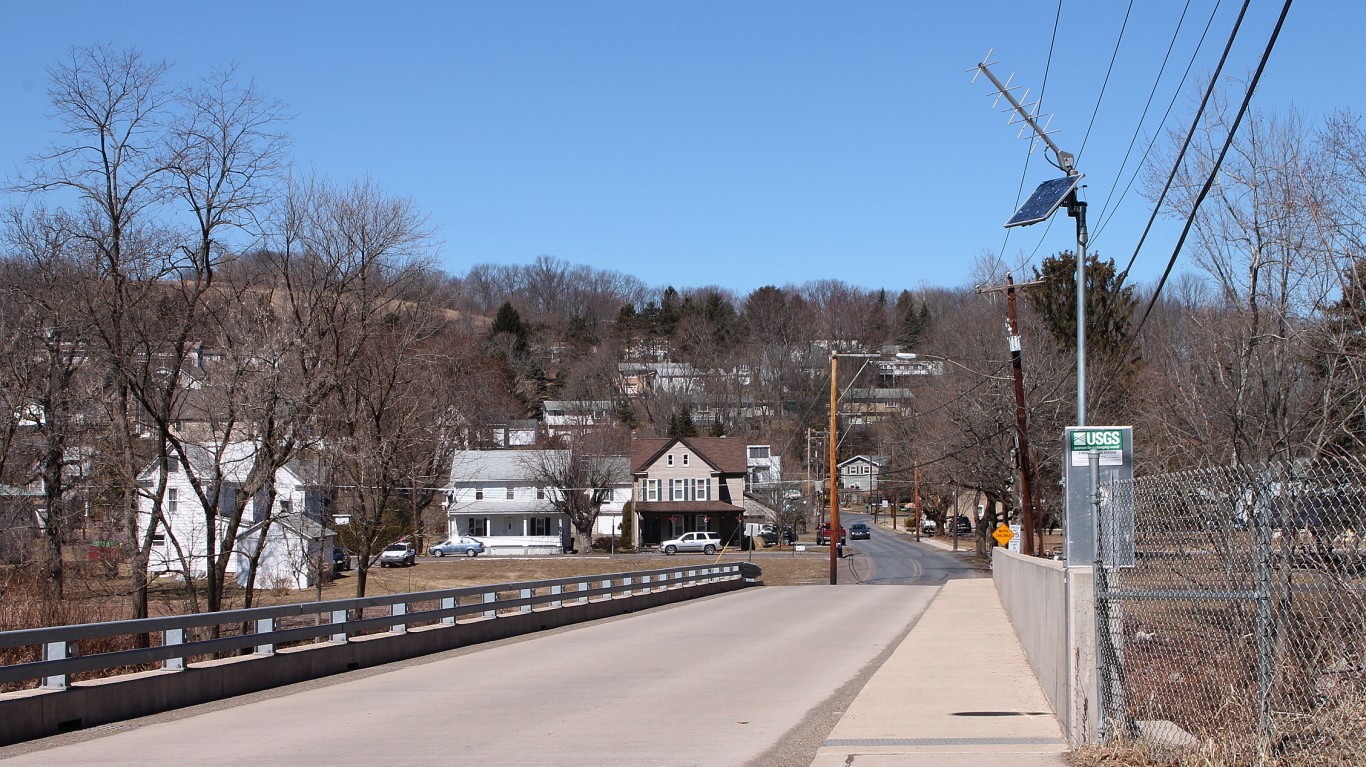
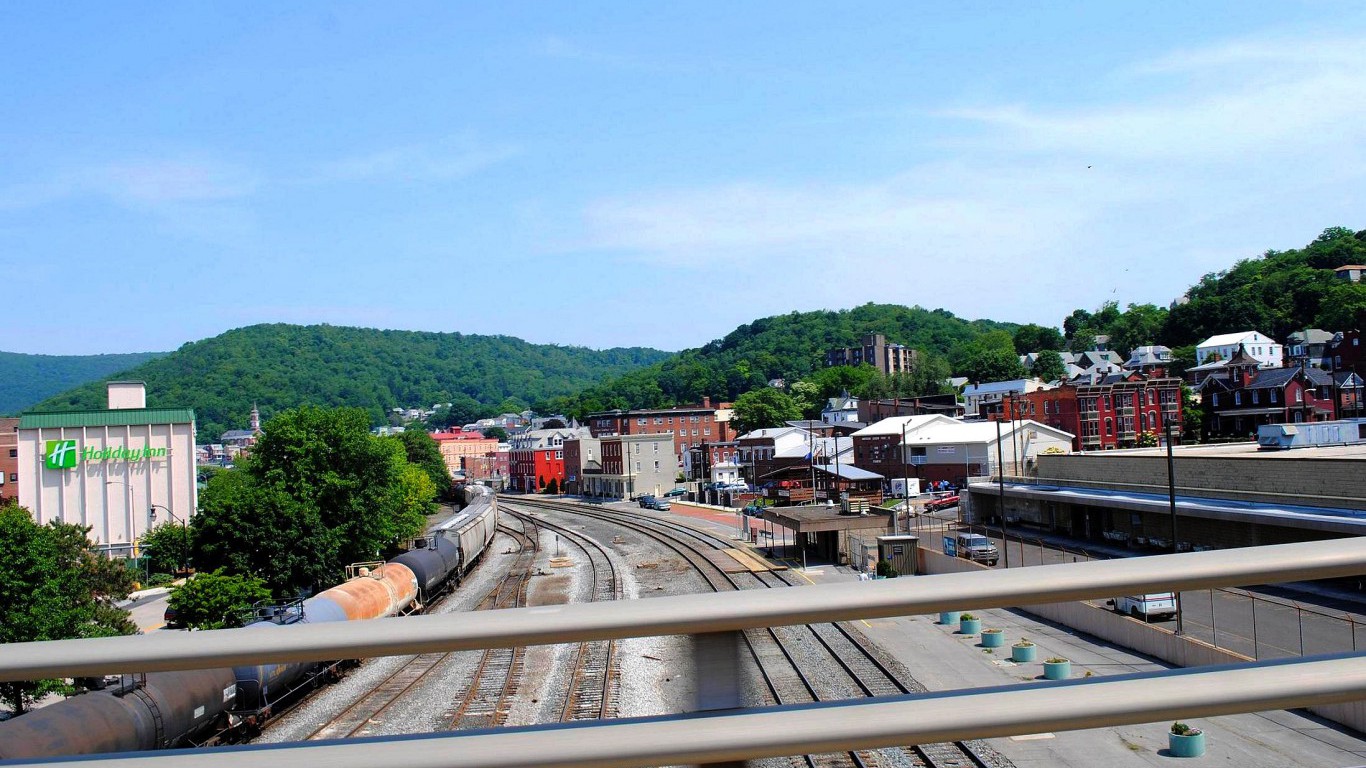
2. Johnstown, PA
> 2010-2020 population change: -10.4%
> 2010 population: 143,679
> 2020 population: 128,672
[in-text-ad-2]

1. Pine Bluff, AR
> 2010-2020 population change: -13.9%
> 2010 population: 100,258
> 2020 population: 86,278
The Average American Has No Idea How Much Money You Can Make Today (Sponsor)
The last few years made people forget how much banks and CD’s can pay. Meanwhile, interest rates have spiked and many can afford to pay you much more, but most are keeping yields low and hoping you won’t notice.
But there is good news. To win qualified customers, some accounts are paying almost 10x the national average! That’s an incredible way to keep your money safe and earn more at the same time. Our top pick for high yield savings accounts includes other benefits as well. You can earn up to 3.80% with a Checking & Savings Account today Sign up and get up to $300 with direct deposit. No account fees. FDIC Insured.
Click here to see how much more you could be earning on your savings today. It takes just a few minutes to open an account to make your money work for you.
Our top pick for high yield savings accounts includes other benefits as well. You can earn up to 4.00% with a Checking & Savings Account from Sofi. Sign up and get up to $300 with direct deposit. No account fees. FDIC Insured.
Thank you for reading! Have some feedback for us?
Contact the 24/7 Wall St. editorial team.
Latest from 24/7


Our expert who first called NVIDIA in 2009 is predicting 2025 will see a historic AI breakthrough.
You can follow him investing $500,000 of his own money on our top AI stocks for free.