The U.S. is in the midst of one of the greatest housing booms in history. Demand for houses was high throughout the 2010s, declined sharply in 2020 amid the early months of the COVID-19 pandemic, then returned to high levels in 2021, pushing the median price for a home higher than it has ever been.
Nationwide, the median home price in the second quarter of 2021 was $357,900 — nearly 23% higher than it was a year earlier. In some parts of the country, home prices increased by more than 30% or even 40% during that time.
To identify the fastest growing housing markets, 24/7 Wall St. reviewed the data on median sales price for U.S. metropolitan areas from the National Association of Realtors. Metropolitan areas were ranked based on the percentage change in the median sales price of single-family homes from the second quarter of 2020 to the second quarter of 2021.
This spike in housing prices was not confined to one area of the country. Of the 25 fastest growing housing markets, seven are in the Northeast And six each are in the South and the West. Just one, however, is located in the Midwest.
These fast-growing housing markets tend to cluster in more populated states, where entertainment options and economic opportunity are more plentiful. There are four major metropolitan areas on this list in each Florida and California, as well as two apiece in New York, Massachusetts, Texas, Colorado, and Arizona. These are the most expensive housing markets in Florida.
Click here to see Americas fastest growing housing markets.
Methodology
To identify the fastest growing housing markets, 24/7 Wall St. reviewed data on median sales price for U.S. metropolitan areas from the National Association of Realtors. Metropolitan areas were ranked based on the percentage change in the median sales price of single-family homes from the second quarter of 2020 to the second quarter of 2021. Sales price data is not seasonally adjusted and is for the most recent period available. Supplemental data on median household income came from the U.S. Census Bureau’s 2019 American Community Survey.

25. Reno, NV
> 1-yr. chg. in median home sale price: +27.4%
> Median home sale price 2020 Q2: $408,100
> Median home sale price 2010 Q2: $519,900
> Median household income: $72,132
[in-text-ad]

24. Riverside-San Bernardino-Ontario, CA
> 1-yr. chg. in median home sale price: +27.5%
> Median home sale price 2020 Q2: $400,000
> Median home sale price 2010 Q2: $510,000
> Median household income: $70,954

23. Portland-South Portland, ME
> 1-yr. chg. in median home sale price: +27.6%
> Median home sale price 2020 Q2: $336,100
> Median home sale price 2010 Q2: $428,800
> Median household income: $71,913

22. Trenton, NJ
> 1-yr. chg. in median home sale price: +27.6%
> Median home sale price 2020 Q2: $292,500
> Median home sale price 2010 Q2: $373,200
> Median household income: $79,492
[in-text-ad-2]
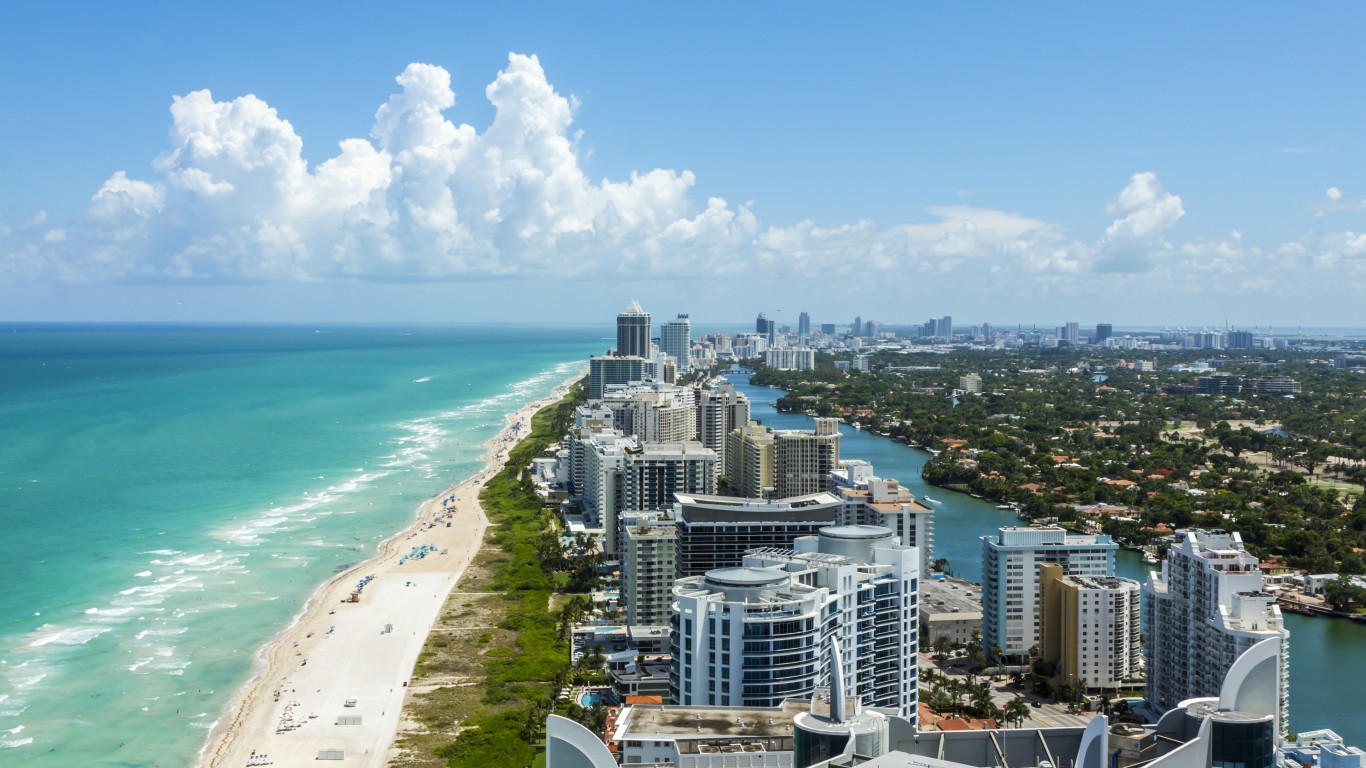
21. Miami-Fort Lauderdale-West Palm Beach, FL
> 1-yr. chg. in median home sale price: +28.0%
> Median home sale price 2020 Q2: $379,000
> Median home sale price 2010 Q2: $485,000
> Median household income: $60,141

20. Nassau County-Suffolk County, NY
> 1-yr. chg. in median home sale price: +28.1%
> Median home sale price 2020 Q2: $495,300
> Median home sale price 2010 Q2: $634,600
> Median household income: $.
[in-text-ad]

19. New York-Newark-Jersey City, NY-NJ-PA
> 1-yr. chg. in median home sale price: +28.3%
> Median home sale price 2020 Q2: $439,700
> Median home sale price 2010 Q2: $564,100
> Median household income: $83,160
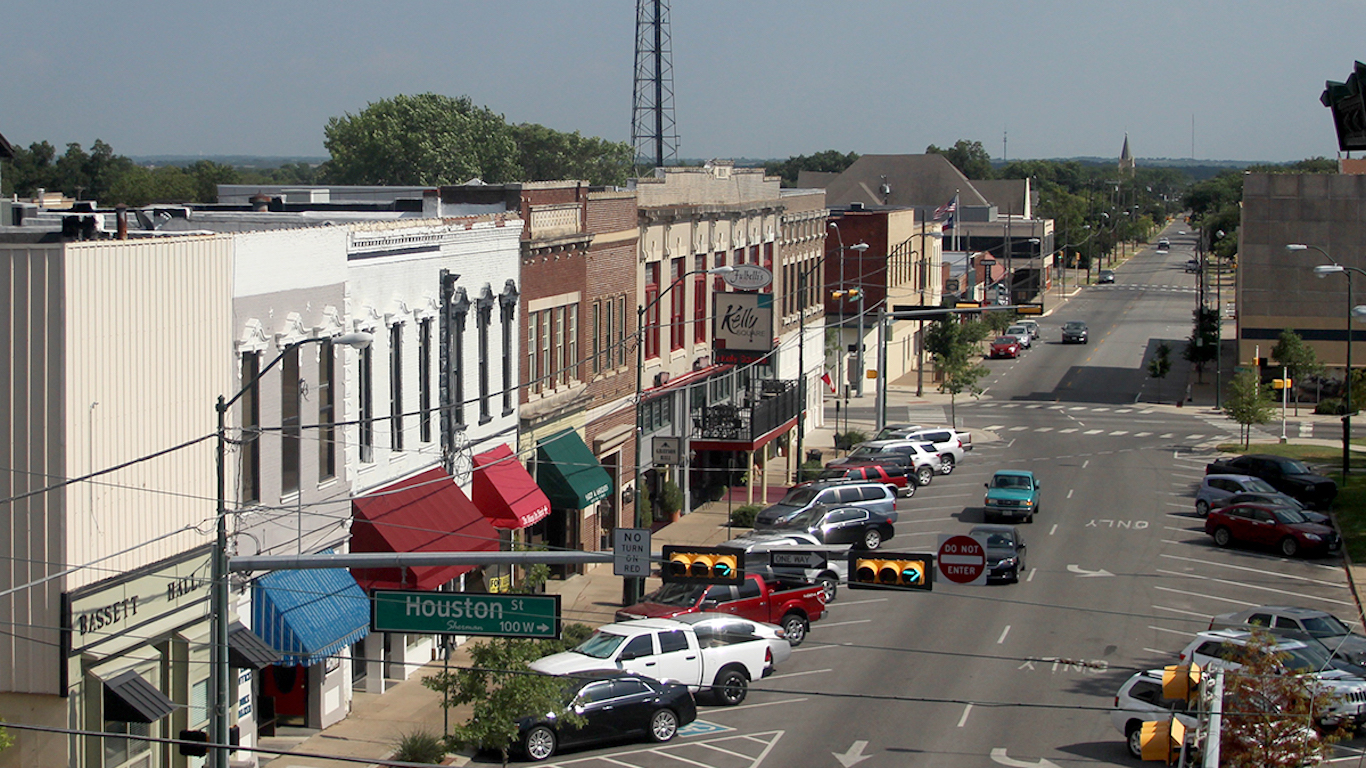
18. Sherman-Denison, TX
> 1-yr. chg. in median home sale price: +28.7%
> Median home sale price 2020 Q2: $193,700
> Median home sale price 2010 Q2: $249,200
> Median household income: $57,476

17. Los Angeles-Long Beach-Glendale, CA
> 1-yr. chg. in median home sale price: +28.8%
> Median home sale price 2020 Q2: $586,900
> Median home sale price 2010 Q2: $756,000
> Median household income: $.
[in-text-ad-2]

16. Anaheim-Santa Ana-Irvine, CA
> 1-yr. chg. in median home sale price: +29.2%
> Median home sale price 2020 Q2: $859,000
> Median home sale price 2010 Q2: $1,109,500
> Median household income: $.

15. Denver-Aurora-Lakewood, CO
> 1-yr. chg. in median home sale price: +29.3%
> Median home sale price 2020 Q2: $478,400
> Median home sale price 2010 Q2: $618,600
> Median household income: $85,641
[in-text-ad]

14. Spokane-Spokane Valley, WA
> 1-yr. chg. in median home sale price: +29.5%
> Median home sale price 2020 Q2: $296,900
> Median home sale price 2010 Q2: $384,500
> Median household income: $59,646

13. Phoenix-Mesa-Scottsdale, AZ
> 1-yr. chg. in median home sale price: +29.9%
> Median home sale price 2020 Q2: $314,700
> Median home sale price 2010 Q2: $408,700
> Median household income: $67,896

12. Fond du Lac, WI
> 1-yr. chg. in median home sale price: +29.9%
> Median home sale price 2020 Q2: $147,100
> Median home sale price 2010 Q2: $191,100
> Median household income: $65,329
[in-text-ad-2]

11. Punta Gorda, FL
> 1-yr. chg. in median home sale price: +30.8%
> Median home sale price 2020 Q2: $240,000
> Median home sale price 2010 Q2: $314,000
> Median household income: $54,652

10. San Francisco-Oakland-Hayward, CA
> 1-yr. chg. in median home sale price: +31.9%
> Median home sale price 2020 Q2: $1,050,000
> Median home sale price 2010 Q2: $1,385,000
> Median household income: $114,696
[in-text-ad]

9. Tucson, AZ
> 1-yr. chg. in median home sale price: +32.6%
> Median home sale price 2020 Q2: $250,700
> Median home sale price 2010 Q2: $332,400
> Median household income: $56,169

8. Cape Coral-Fort Myers, FL
> 1-yr. chg. in median home sale price: +35.6%
> Median home sale price 2020 Q2: $265,500
> Median home sale price 2010 Q2: $360,000
> Median household income: $62,240

7. Bridgeport-Stamford-Norwalk, CT
> 1-yr. chg. in median home sale price: +37.1%
> Median home sale price 2020 Q2: $494,600
> Median home sale price 2010 Q2: $678,200
> Median household income: $97,053
[in-text-ad-2]

6. Boulder, CO
> 1-yr. chg. in median home sale price: +37.7%
> Median home sale price 2020 Q2: $606,700
> Median home sale price 2010 Q2: $835,200
> Median household income: $88,535

5. Barnstable Town, MA
> 1-yr. chg. in median home sale price: +37.8%
> Median home sale price 2020 Q2: $455,300
> Median home sale price 2010 Q2: $627,400
> Median household income: $85,042
[in-text-ad]

4. Boise City-Nampa, ID
> 1-yr. chg. in median home sale price: +41.0%
> Median home sale price 2020 Q2: $332,800
> Median home sale price 2010 Q2: $469,100
> Median household income: $66,466

3. Naples-Immokalee-Marco Island, FL
> 1-yr. chg. in median home sale price: +41.9%
> Median home sale price 2020 Q2: $464,700
> Median home sale price 2010 Q2: $659,500
> Median household income: $76,025

2. Austin-Round Rock, TX
> 1-yr. chg. in median home sale price: +45.1%
> Median home sale price 2020 Q2: $355,000
> Median home sale price 2010 Q2: $515,100
> Median household income: $80,954
[in-text-ad-2]
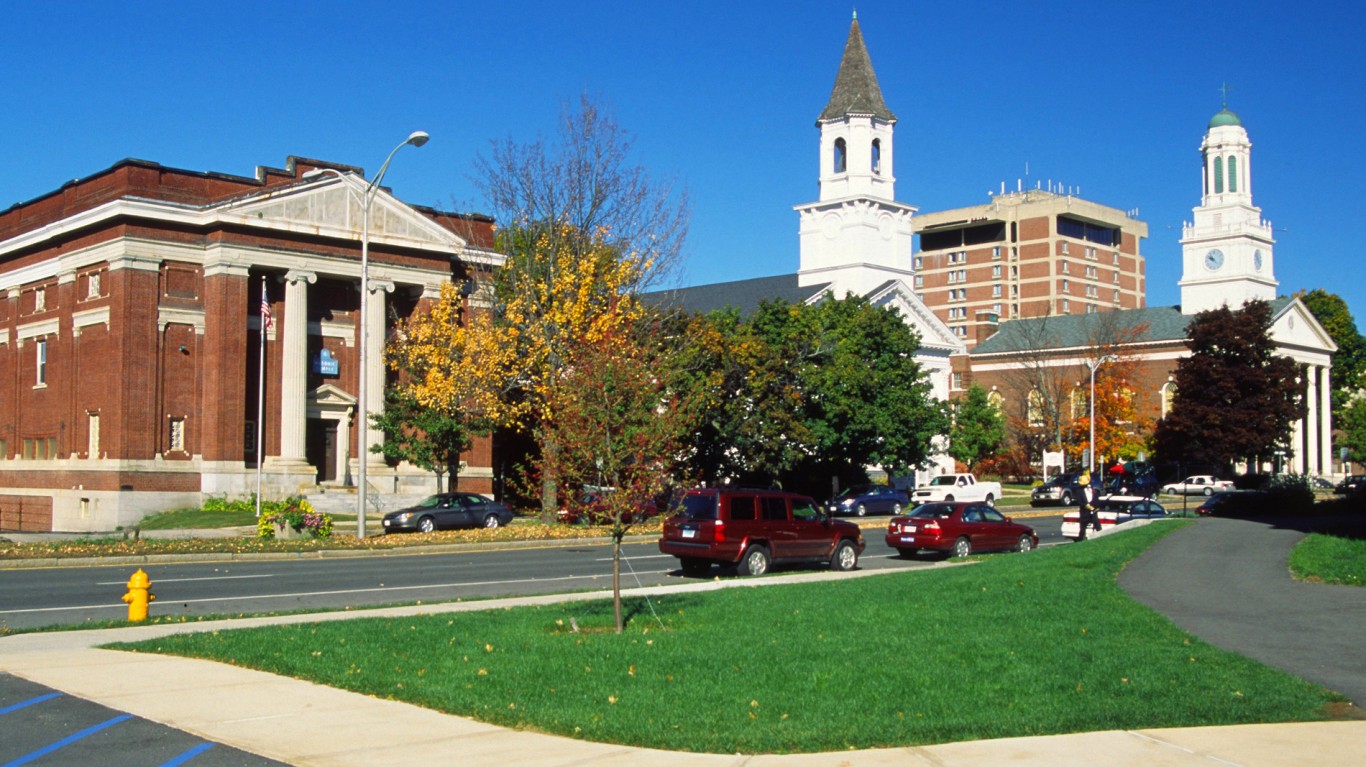
1. Pittsfield, MA
> 1-yr. chg. in median home sale price: +46.5%
> Median home sale price 2020 Q2: $219,800
> Median home sale price 2010 Q2: $321,900
> Median household income: $58,895
“The Next NVIDIA” Could Change Your Life
If you missed out on NVIDIA’s historic run, your chance to see life-changing profits from AI isn’t over.
The 24/7 Wall Street Analyst who first called NVIDIA’s AI-fueled rise in 2009 just published a brand-new research report named “The Next NVIDIA.”
Click here to download your FREE copy.
Thank you for reading! Have some feedback for us?
Contact the 24/7 Wall St. editorial team.
 24/7 Wall St.
 24/7 Wall St.
 24/7 Wall St.
