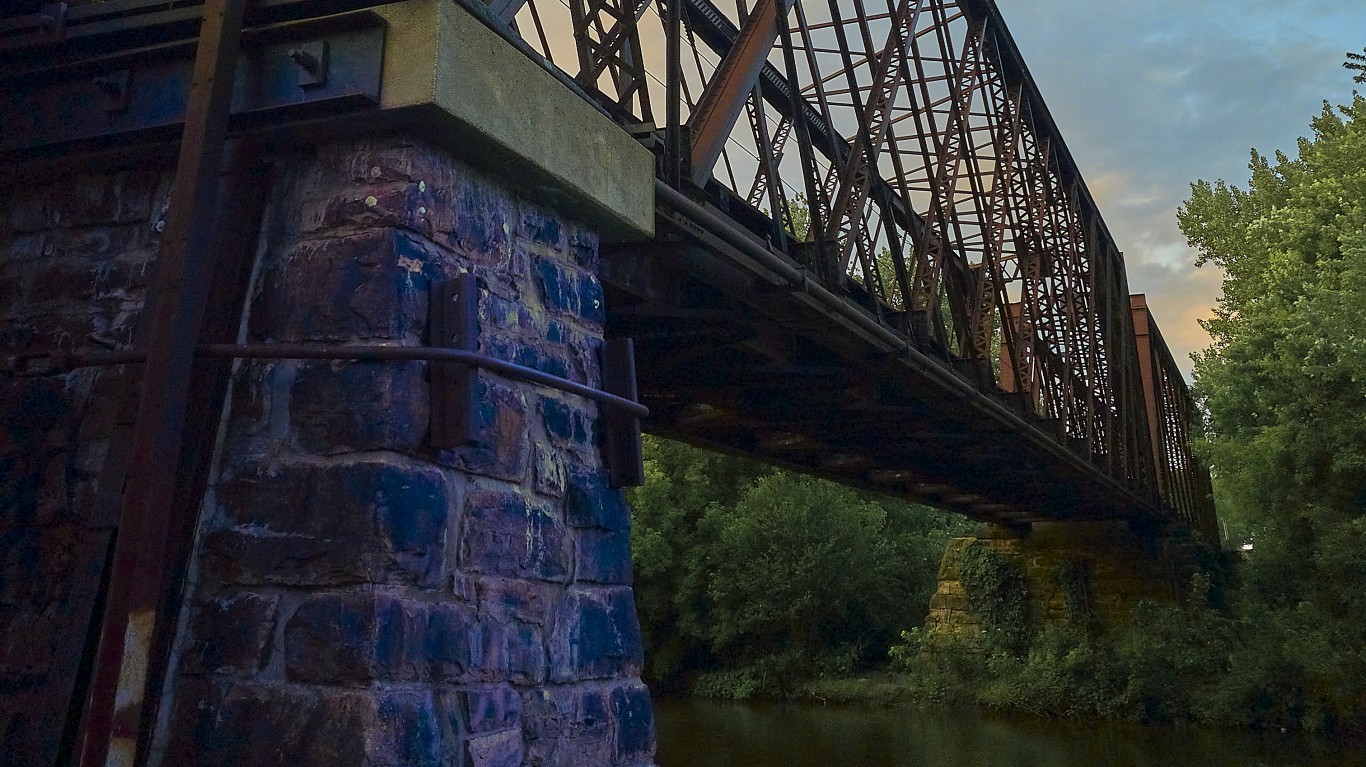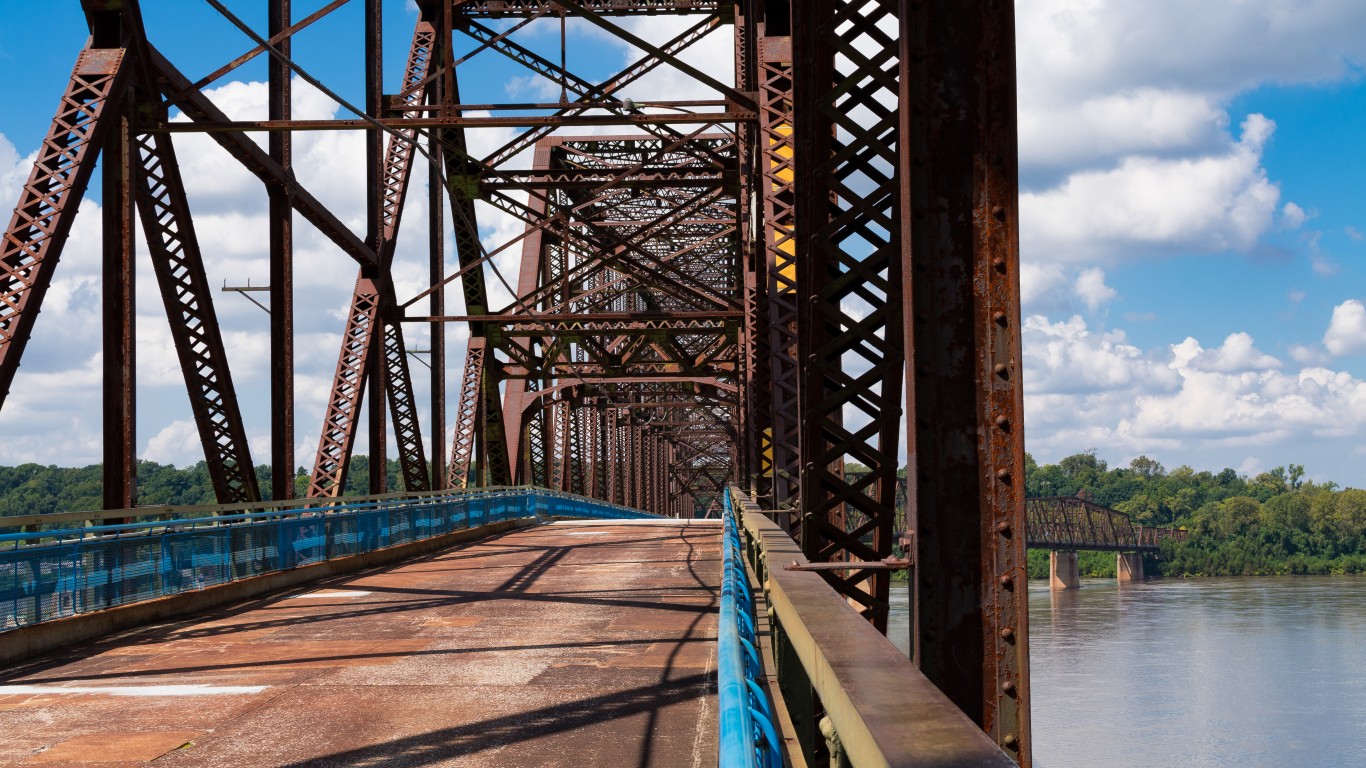
If you’re hearing a lot about bridges lately, it’s probably because these vital passageways are front and center in President Joe Biden’s $1 trillion infrastructure proposal. The ambitious plan targets improvements to the nation’s roads, transit hubs, broadband networks, water systems — and bridges.
The proposed legislation, which is scheduled for a vote in the House on Sept. 27, would “fix the ten most economically significant bridges in the country in need of reconstruction” and another 10,000 smaller bridges in the worst condition. Even as Congress debates the plan, members from both sides of the aisle agree the nation’s hard infrastructure desperately needs a long-overdue upgrade.
Of the 618,456 bridges in the U.S. (comprising over 396.2 million square meters of bridges), 7.3% — 45,031 bridges (comprising 21 million square meters) — were classified in poor condition as of 2020. Another 294,992 bridges, 47.7%, were classified as fair and 278,433 bridges, 45.5%, as good, according to the Bureau of Transportation Statistics.
Under federal law, states must periodically inspect bridges — based on standards set by the Pavement and Bridge Condition Performance Measures final rule — and report the findings to the Federal Highway Administration. The deck, superstructure, substructure, and culvert are all rated on a scale of 0 to 9. If all the elements rate at least 7, the bridge is classified as being in good condition. If an element rates no less than between 5 and 6, the bridge is considered in fair condition. If any of the bridge’s elements rate 4 or less, the bridge’s condition is classified as poor.
To determine the states with the most bridges in poor condition, 24/7 Wall St. reviewed data from the FHWA. States were ranked on the share of total bridges classified as being in poor condition as of Dec. 31, 2020.
Bridges are also considered structurally deficient “if significant load-carrying elements are in poor condition due to deterioration or damage” or if “the waterway opening of the bridge causes intolerable roadway traffic interruptions.” However, a bridge classified as structurally deficient isn’t necessarily unsafe and may require some measures taken or more frequent monitoring. If a bridge is found unsafe, it would be shut to traffic immediately.
To encourage state spending on structurally deficient bridges, there is a penalty threshold under the National Highway Performance Program. If more than 10% of the total deck area of a state’s bridges is rated as structurally deficient for three consecutive years, the state must set aside NHPP funds for eligible projects on bridges on the National Highway System.
The statistics from FHWA are national. As with so much of the nation’s infrastructure, Conditions of bridges vary by state, with some in better shape than in others. The safest state for bridge hopping is Nevada. There, a mere 1.4% of its bridges have lapsed into poor condition. At the other end of the spectrum is West Virginia, where 21.1% of bridges are considered as being in poor conditions. For more on how states rank on infrastructure, see states that are falling apart.
Interestingly, Iowa has the second largest percentage of bridges in poor conditions. Yet that same state was the inspiration for the romantic book and movie “The Bridges of Madison County.” Apparently, 19.1% of those bridges might be in poor condition. (See how “Bridges” ranks among the 29 biggest Meryl Streep movies, ranked worst to best.)
Click here to see the states with the most structurally deficient bridges
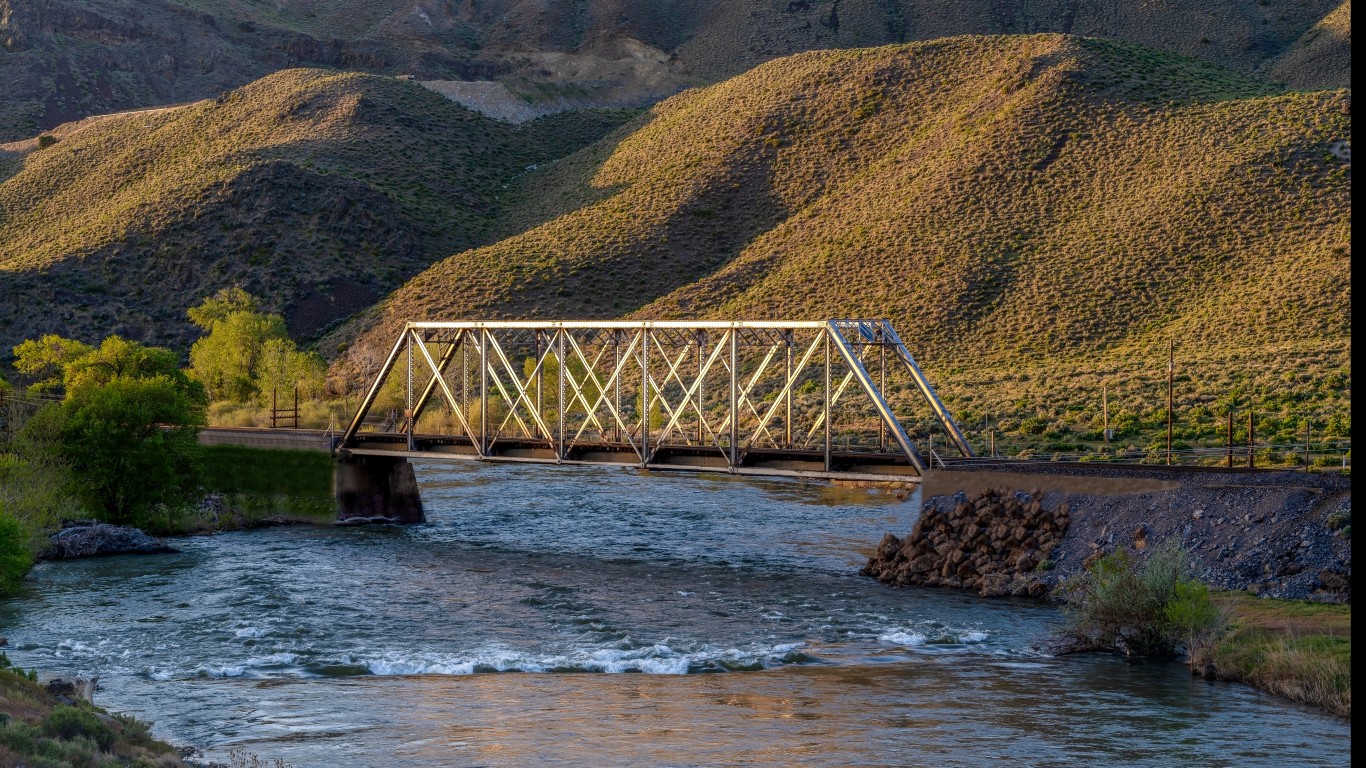
50. Nevada
> Share of bridges in poor condition: 1.4%
> Total bridges in poor condition: 28 — 2nd fewest
> Total bridges in Nevada: 2,056 — 5th fewest
[in-text-ad]
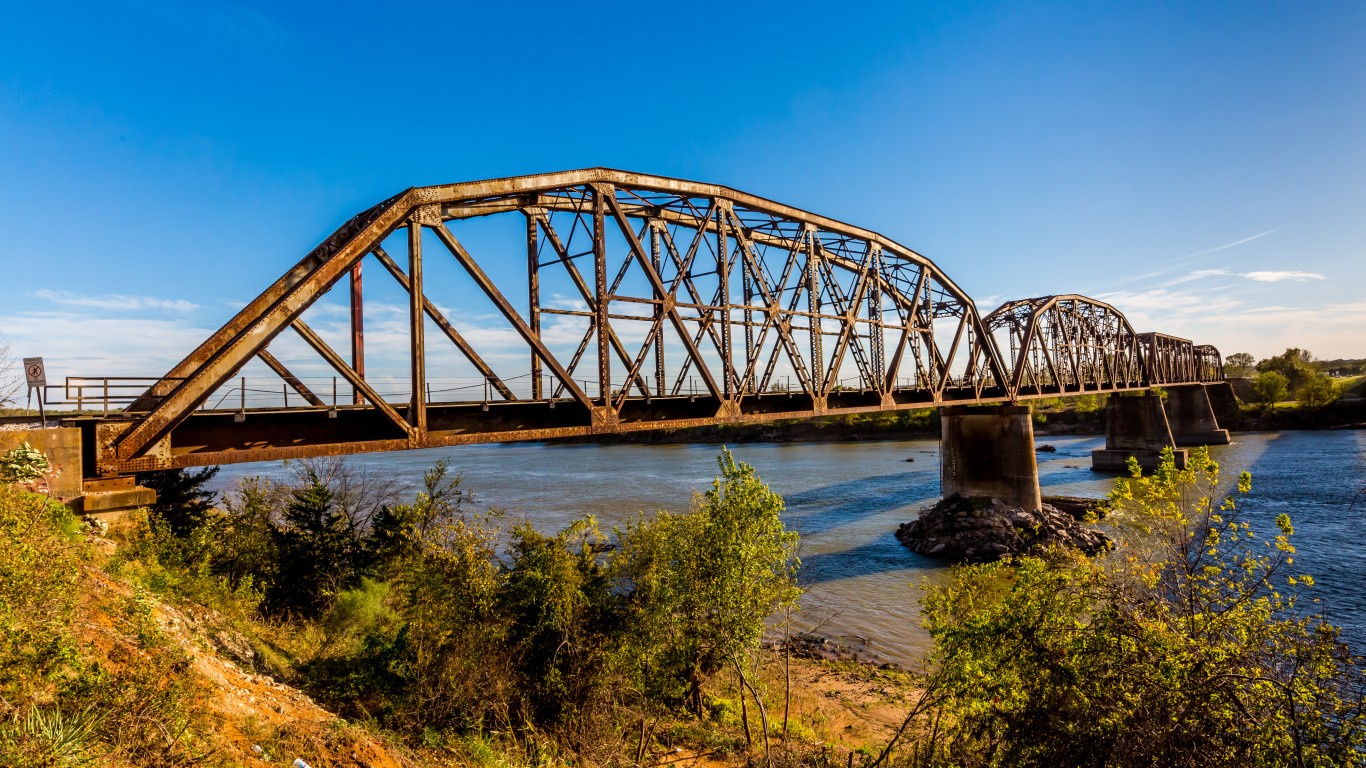
49. Texas
> Share of bridges in poor condition: 1.5%
> Total bridges in poor condition: 818 — 21st most
> Total bridges in Texas: 54,682 — the most
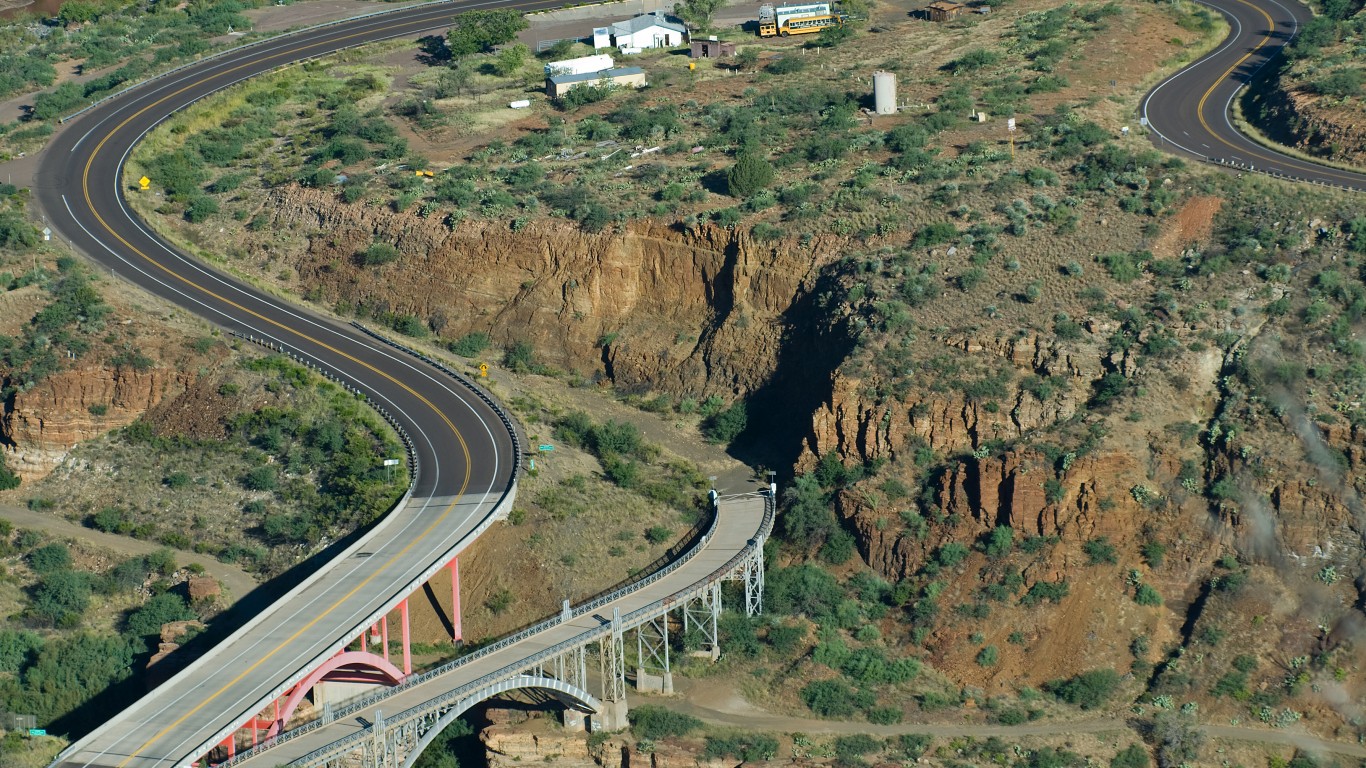
48. Arizona
> Share of bridges in poor condition: 1.6%
> Total bridges in poor condition: 132 — 6th fewest
> Total bridges in Arizona: 8,428 — 23rd fewest
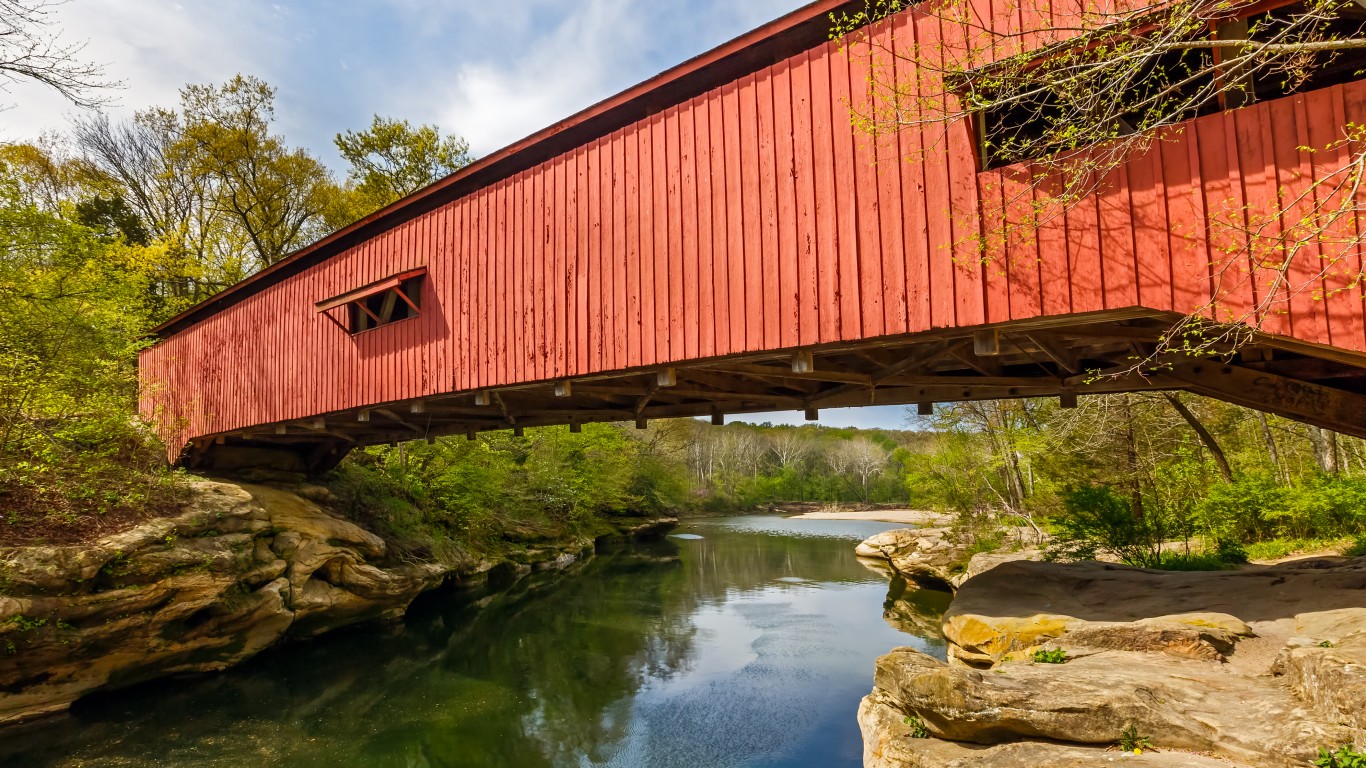
47. Utah
> Share of bridges in poor condition: 2.0%
> Total bridges in poor condition: 62 — 3rd fewest
> Total bridges in Utah: 3,062 — 9th fewest
[in-text-ad-2]
46. Delaware
> Share of bridges in poor condition: 2.2%
> Total bridges in poor condition: 19 — the fewest
> Total bridges in Delaware: 882 — 2nd fewest
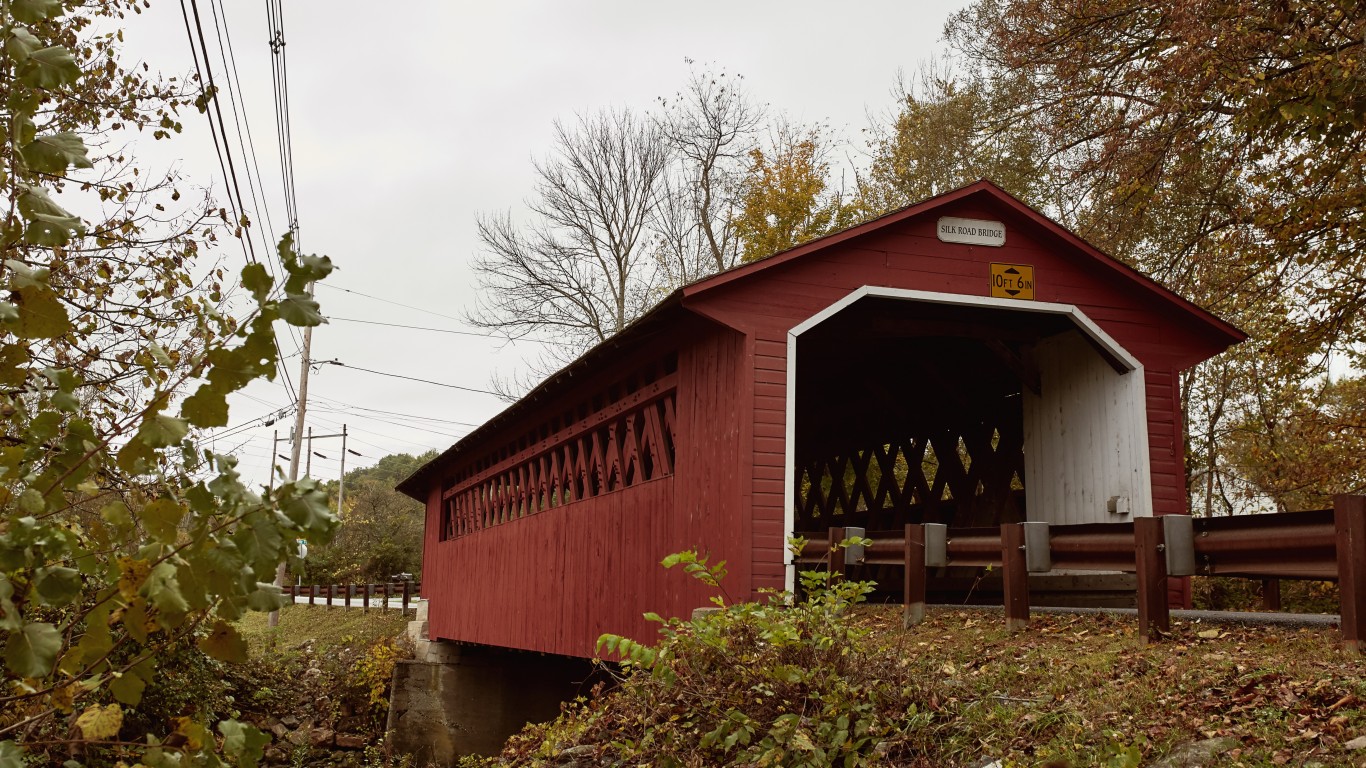
45. Vermont
> Share of bridges in poor condition: 2.3%
> Total bridges in poor condition: 66 — 4th fewest
> Total bridges in Vermont: 2,827 — 8th fewest
[in-text-ad]
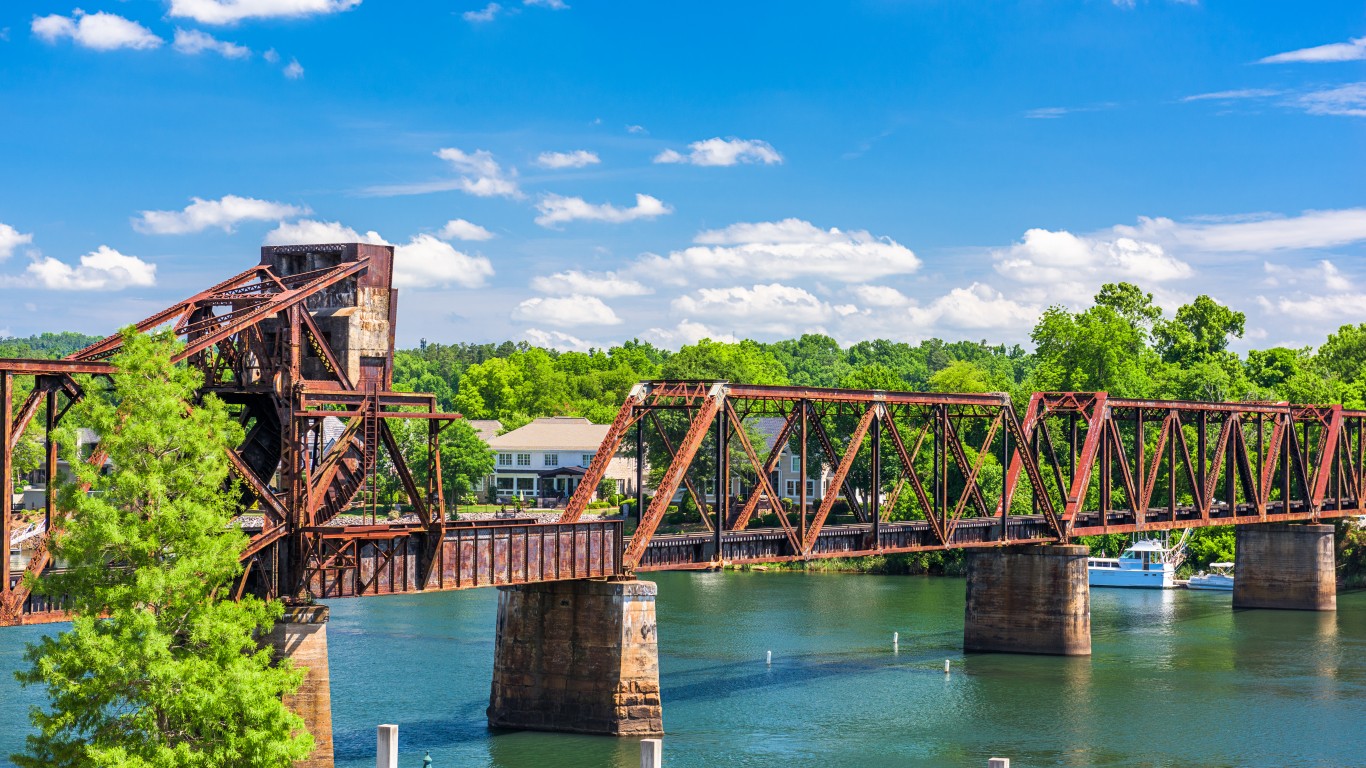
44. Georgia
> Share of bridges in poor condition: 2.5%
> Total bridges in poor condition: 374 — 16th fewest
> Total bridges in Georgia: 14,964 — 17th most
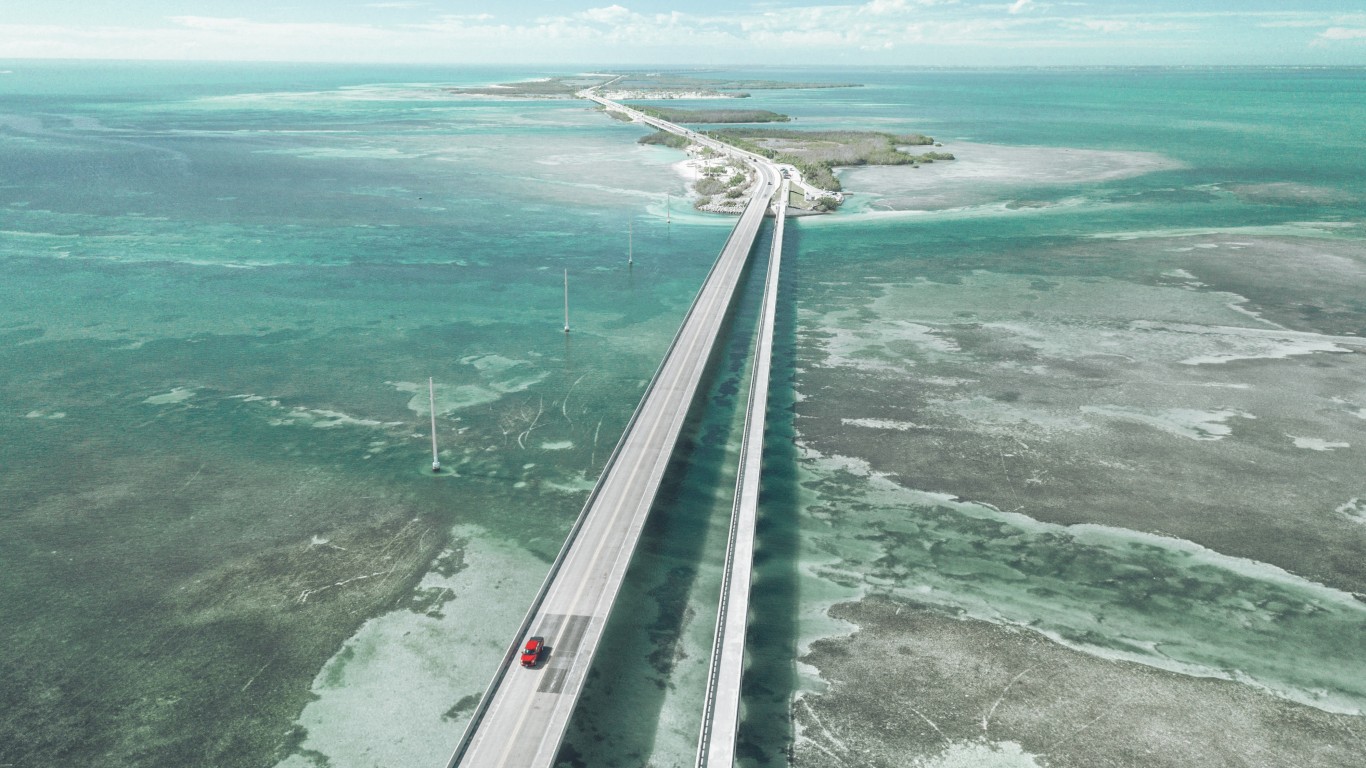
43. Florida
> Share of bridges in poor condition: 3.2%
> Total bridges in poor condition: 408 — 19th fewest
> Total bridges in Florida: 12,592 — 24th most
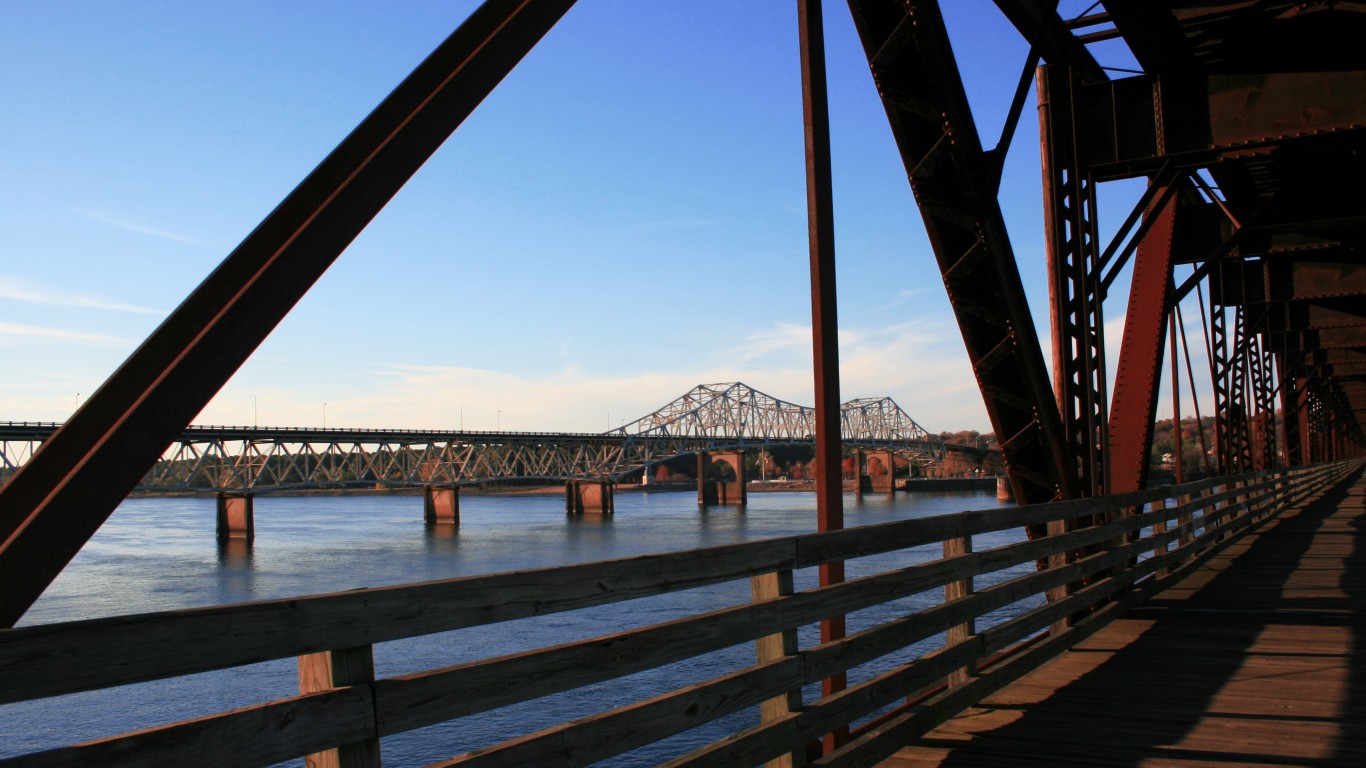
42. Alabama
> Share of bridges in poor condition: 3.8%
> Total bridges in poor condition: 620 — 25th most
> Total bridges in Alabama: 16,155 — 15th most
[in-text-ad-2]
41. Virginia
> Share of bridges in poor condition: 4.1%
> Total bridges in poor condition: 577 — 25th fewest
> Total bridges in Virginia: 13,963 — 20th most
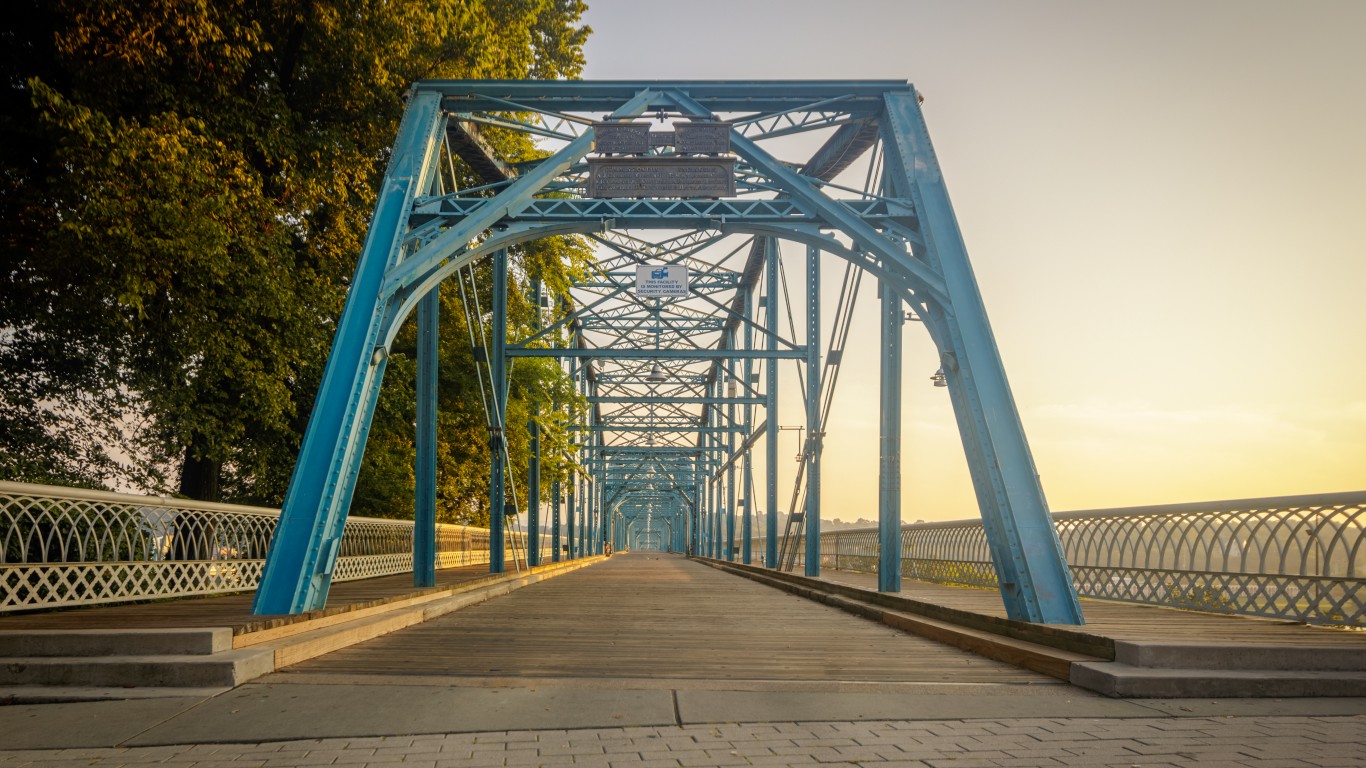
40. Tennessee
> Share of bridges in poor condition: 4.4%
> Total bridges in poor condition: 881 — 20th most
> Total bridges in Tennessee: 20,235 — 10th most
[in-text-ad]
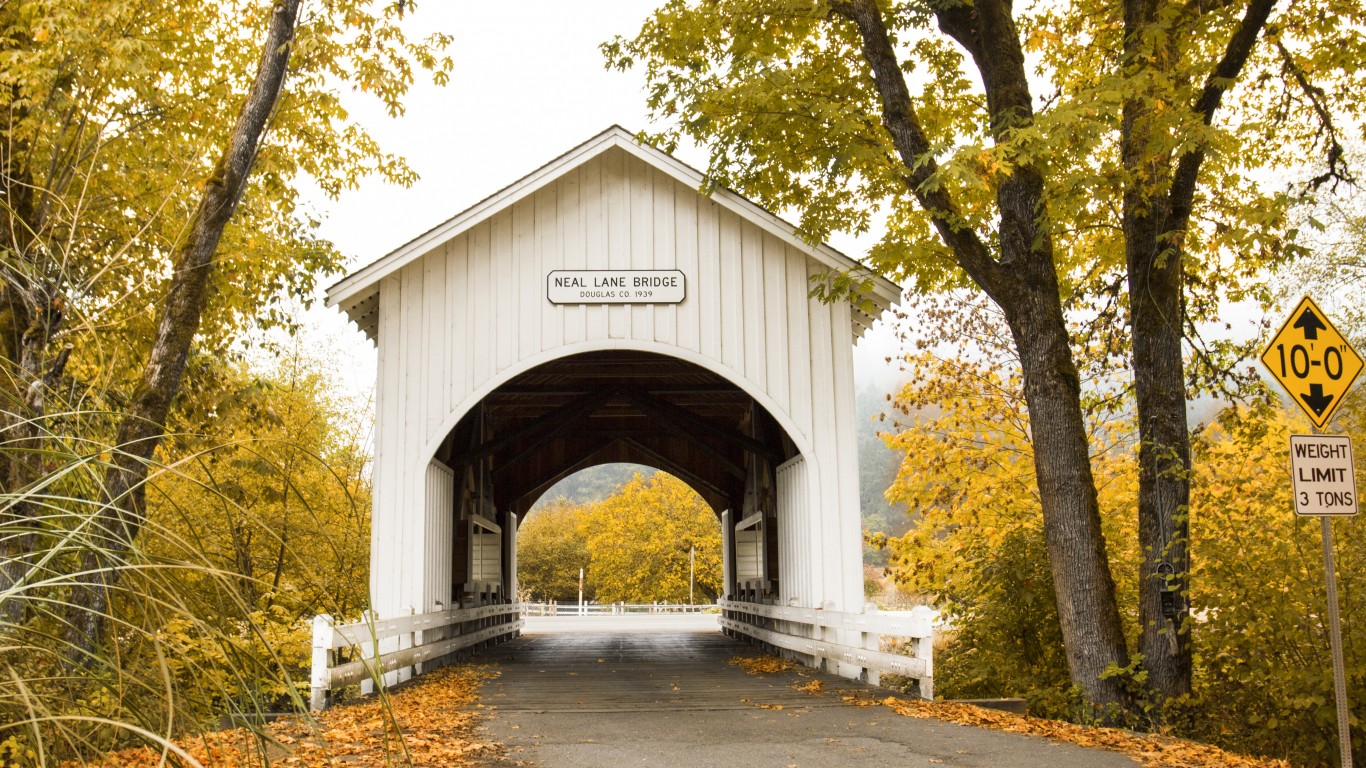
39. Oregon
> Share of bridges in poor condition: 4.8%
> Total bridges in poor condition: 395 — 18th fewest
> Total bridges in Oregon: 8,214 — 21st fewest
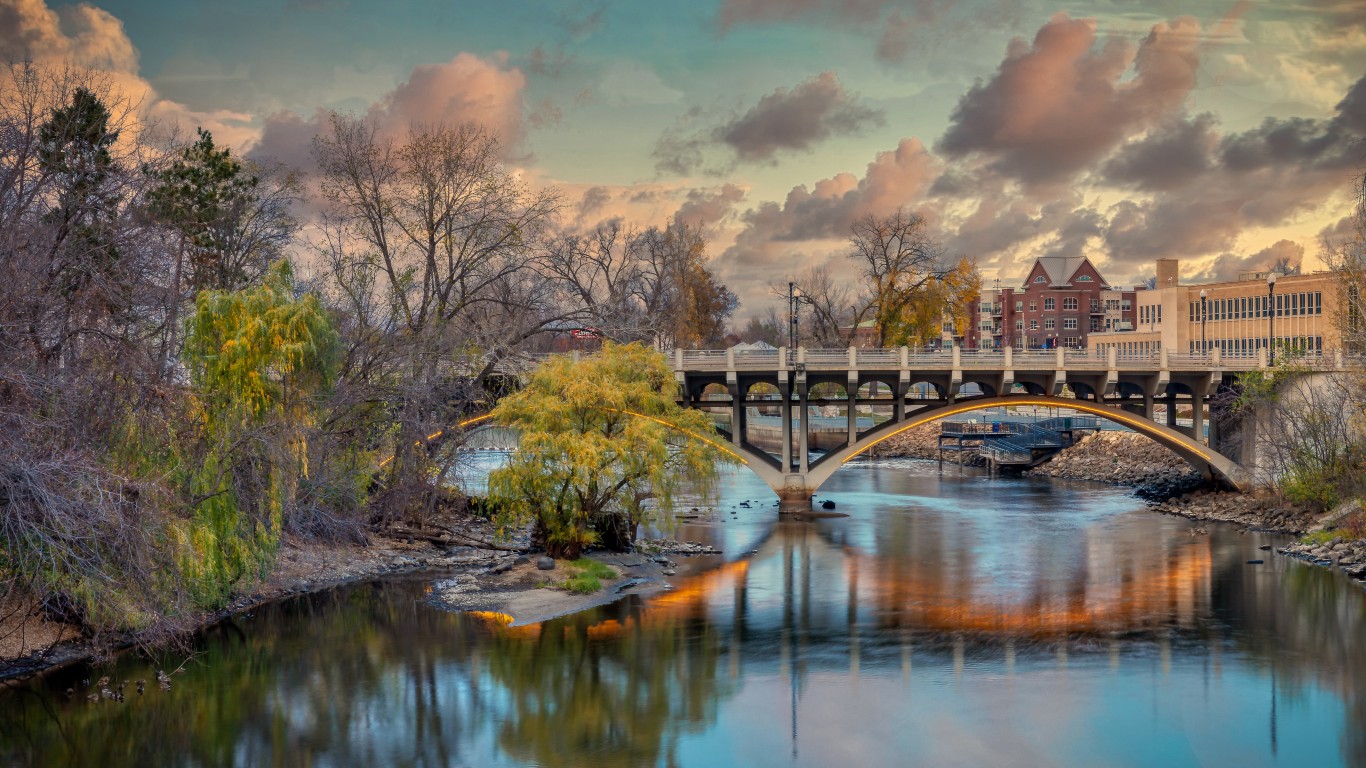
38. Minnesota
> Share of bridges in poor condition: 4.9%
> Total bridges in poor condition: 661 — 24th most
> Total bridges in Minnesota: 13,471 — 21st most
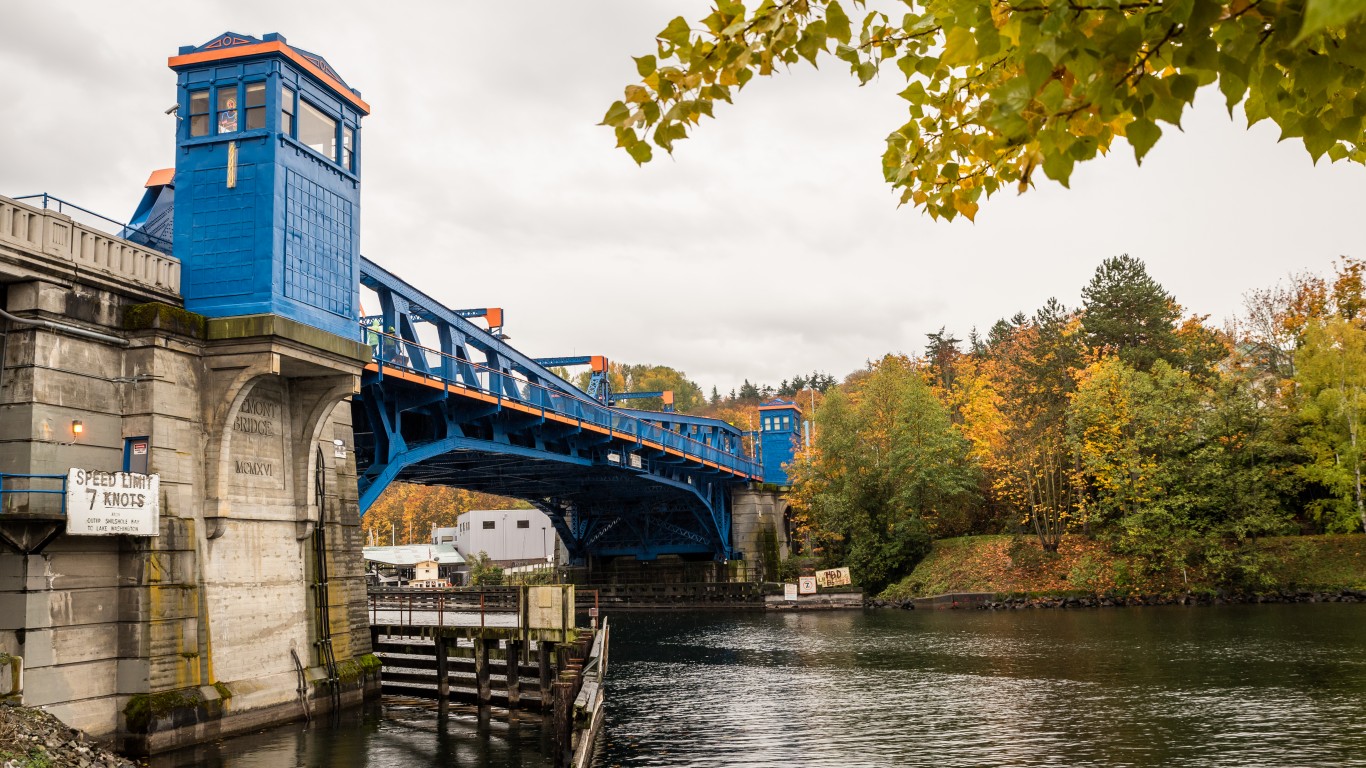
37. Washington
> Share of bridges in poor condition: 5.0%
> Total bridges in poor condition: 416 — 20th fewest
> Total bridges in Washington: 8,338 — 22nd fewest
[in-text-ad-2]
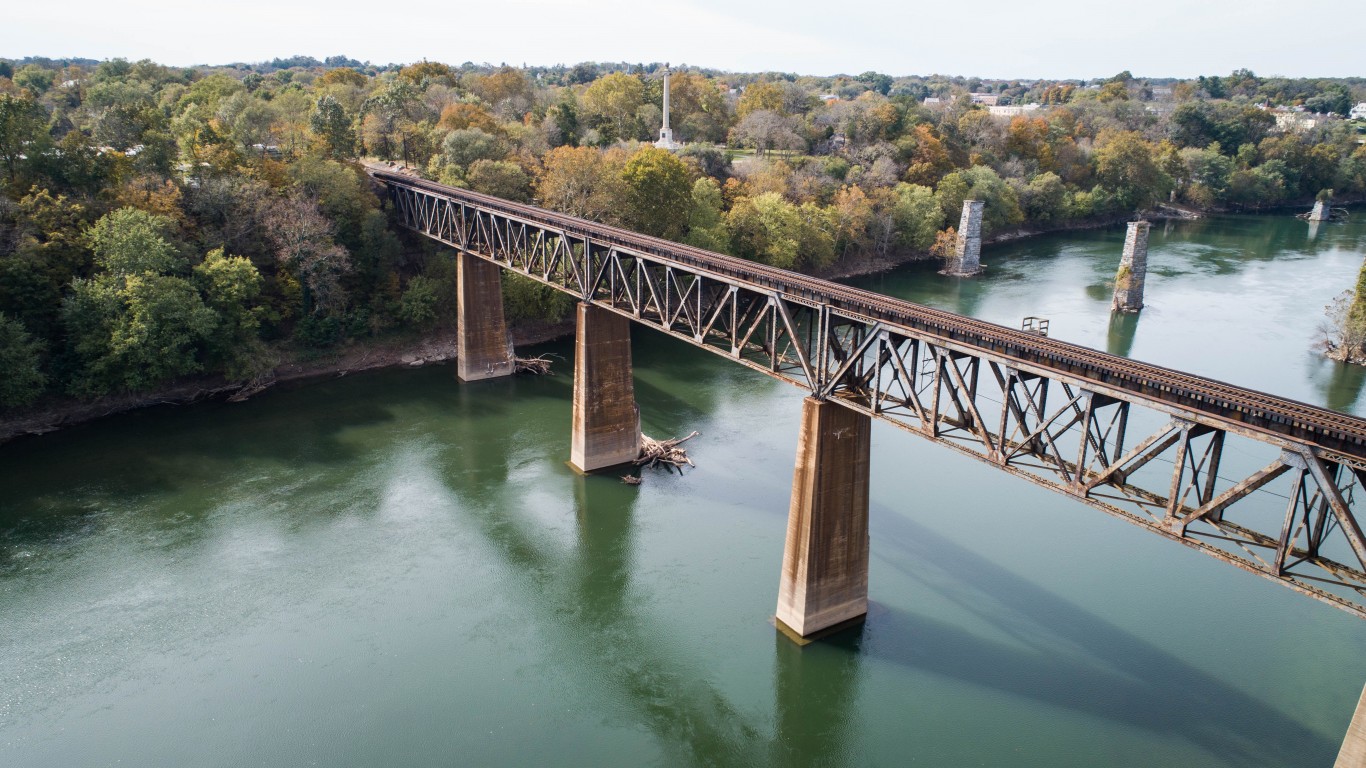
36. Maryland
> Share of bridges in poor condition: 5.0%
> Total bridges in poor condition: 273 — 13th fewest
> Total bridges in Maryland: 5,430 — 17th fewest
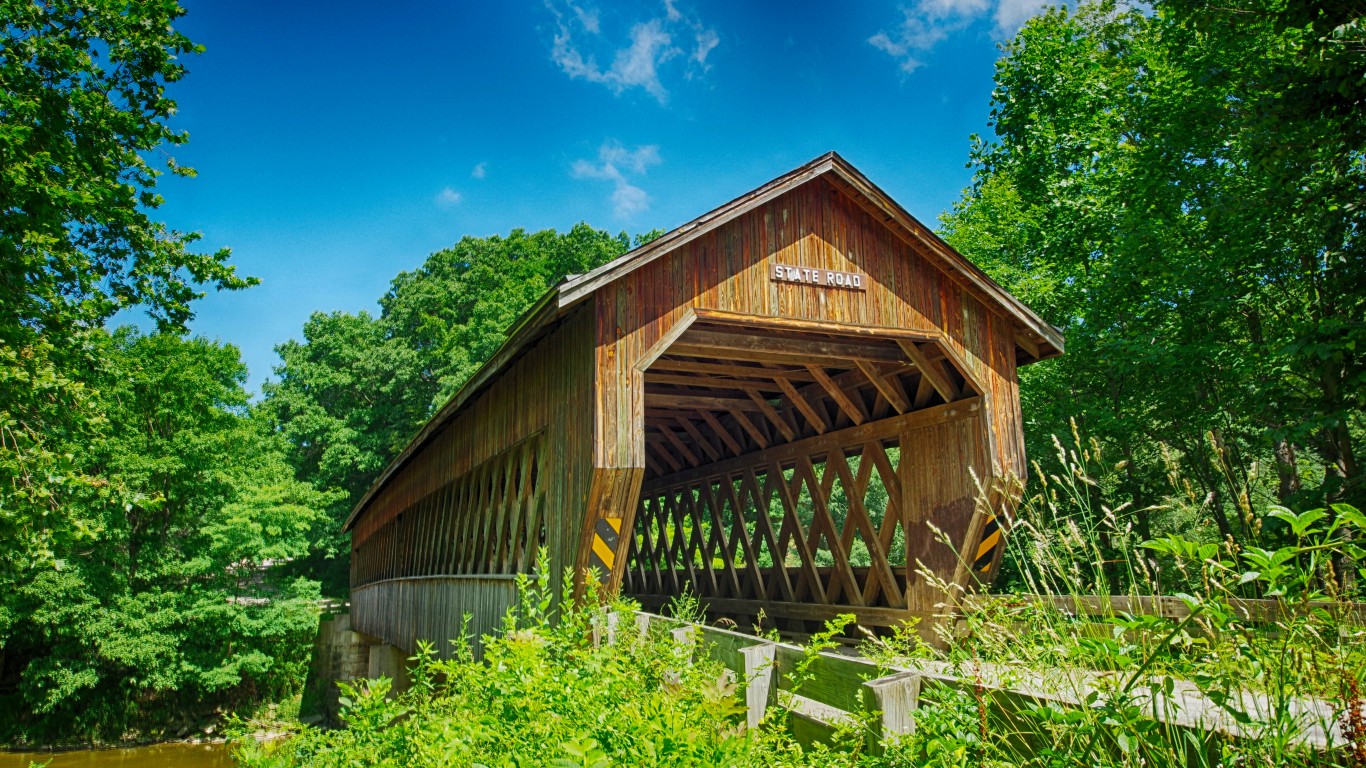
35. Ohio
> Share of bridges in poor condition: 5.1%
> Total bridges in poor condition: 1,377 — 12th most
> Total bridges in Ohio: 27,072 — 2nd most
[in-text-ad]
34. Arkansas
> Share of bridges in poor condition: 5.1%
> Total bridges in poor condition: 663 — 23rd most
> Total bridges in Arkansas: 12,946 — 22nd most
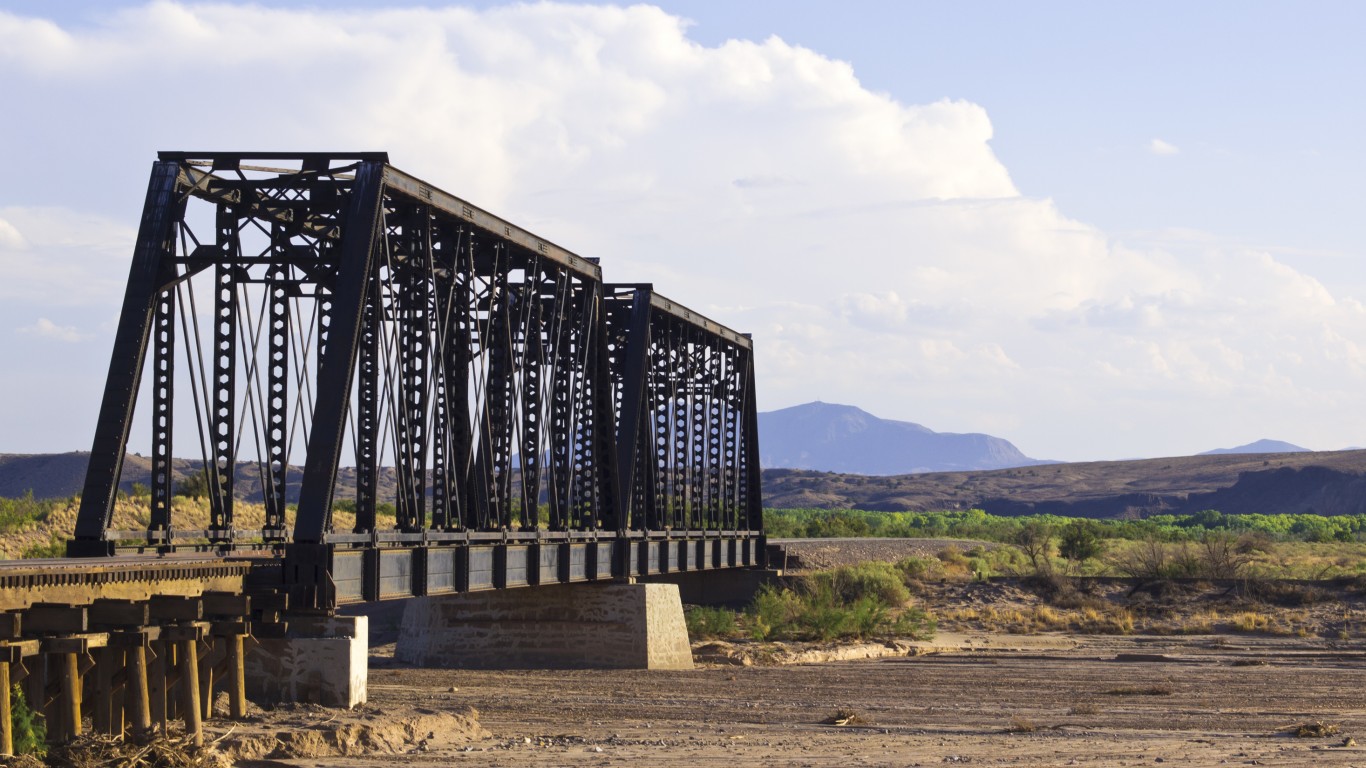
33. New Mexico
> Share of bridges in poor condition: 5.1%
> Total bridges in poor condition: 207 — 9th fewest
> Total bridges in New Mexico: 4,024 — 11th fewest
32. Kansas
> Share of bridges in poor condition: 5.3%
> Total bridges in poor condition: 1,321 — 13th most
> Total bridges in Kansas: 24,948 — 5th most
[in-text-ad-2]
31. Colorado
> Share of bridges in poor condition: 5.4%
> Total bridges in poor condition: 481 — 23rd fewest
> Total bridges in Colorado: 8,829 — 24th fewest
30. Connecticut
> Share of bridges in poor condition: 5.7%
> Total bridges in poor condition: 248 — 12th fewest
> Total bridges in Connecticut: 4,357 — 13th fewest
[in-text-ad]
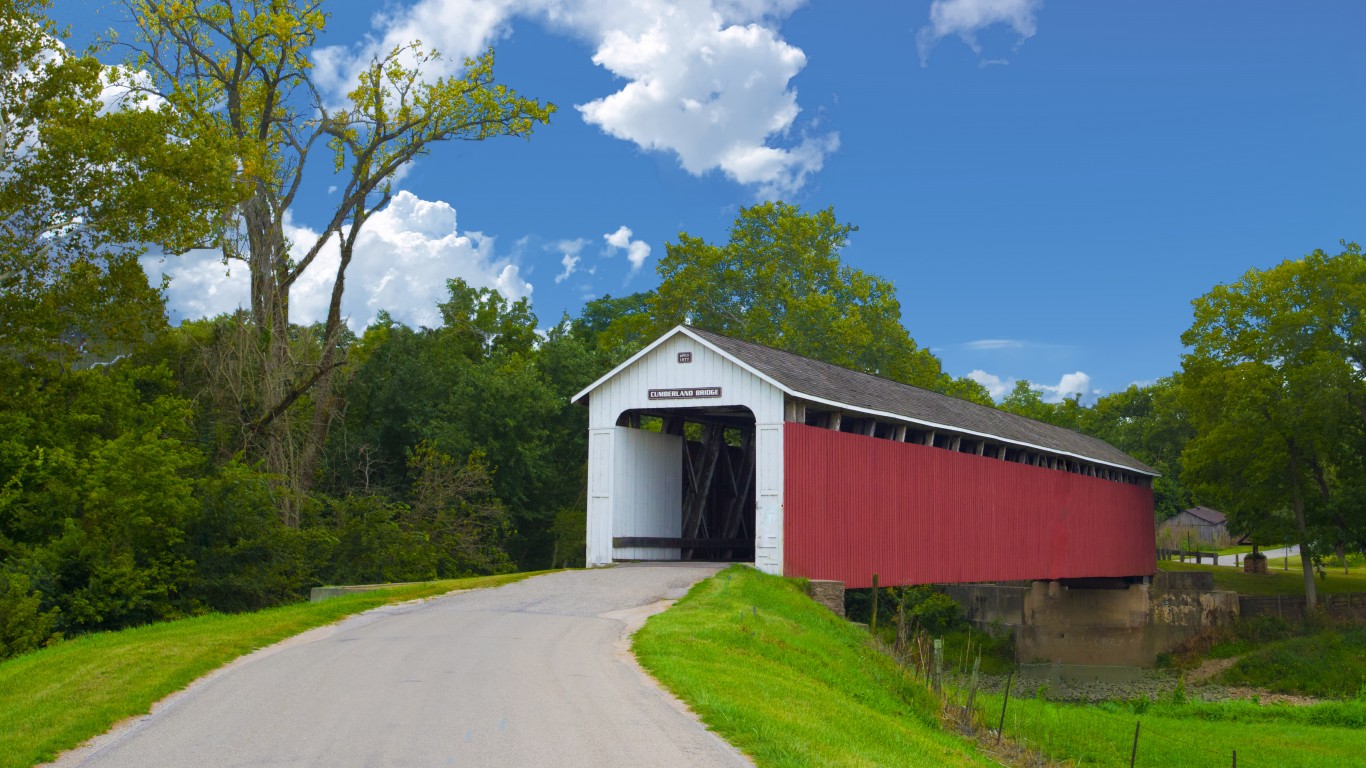
29. Indiana
> Share of bridges in poor condition: 5.7%
> Total bridges in poor condition: 1,111 — 16th most
> Total bridges in Indiana: 19,327 — 11th most
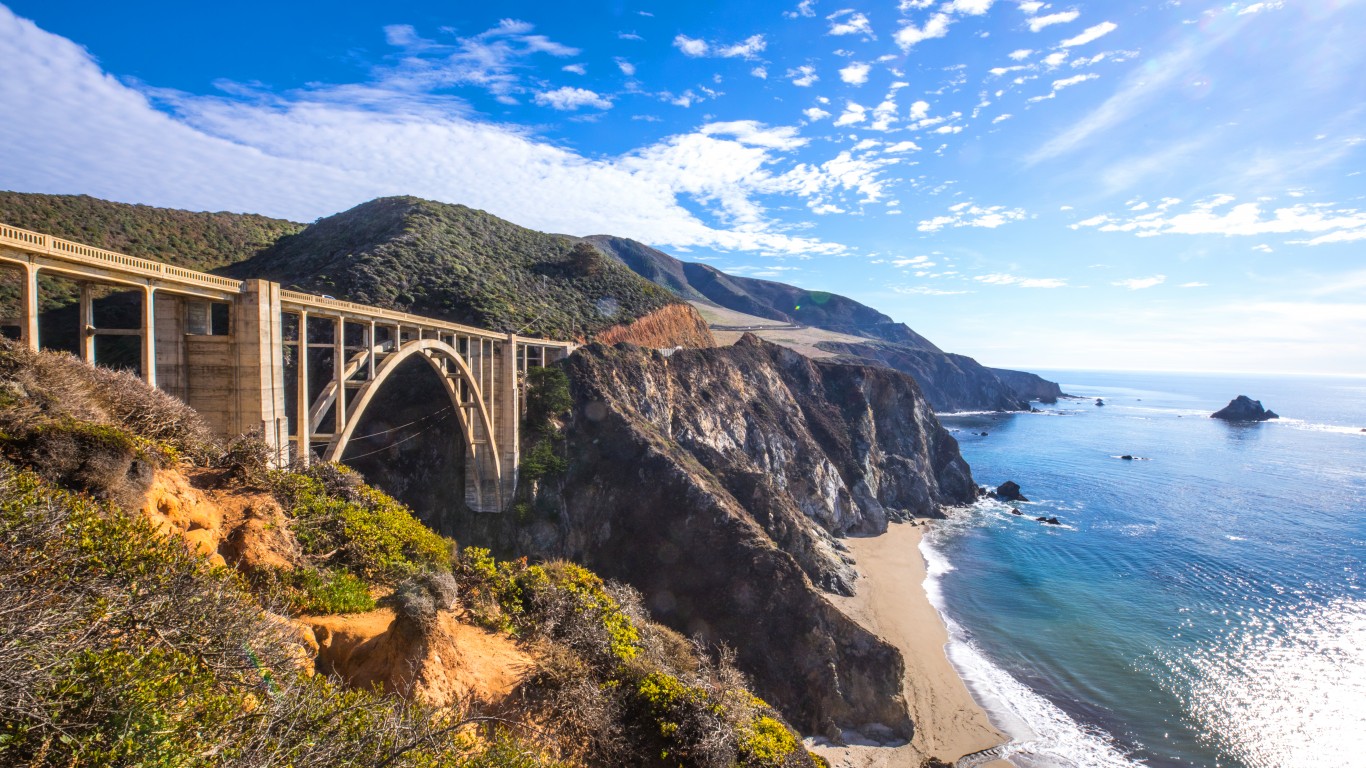
28. California
> Share of bridges in poor condition: 6.0%
> Total bridges in poor condition: 1,536 — 9th most
> Total bridges in California: 25,763 — 4th most
27. Idaho
> Share of bridges in poor condition: 6.3%
> Total bridges in poor condition: 286 — 14th fewest
> Total bridges in Idaho: 4,522 — 14th fewest
[in-text-ad-2]
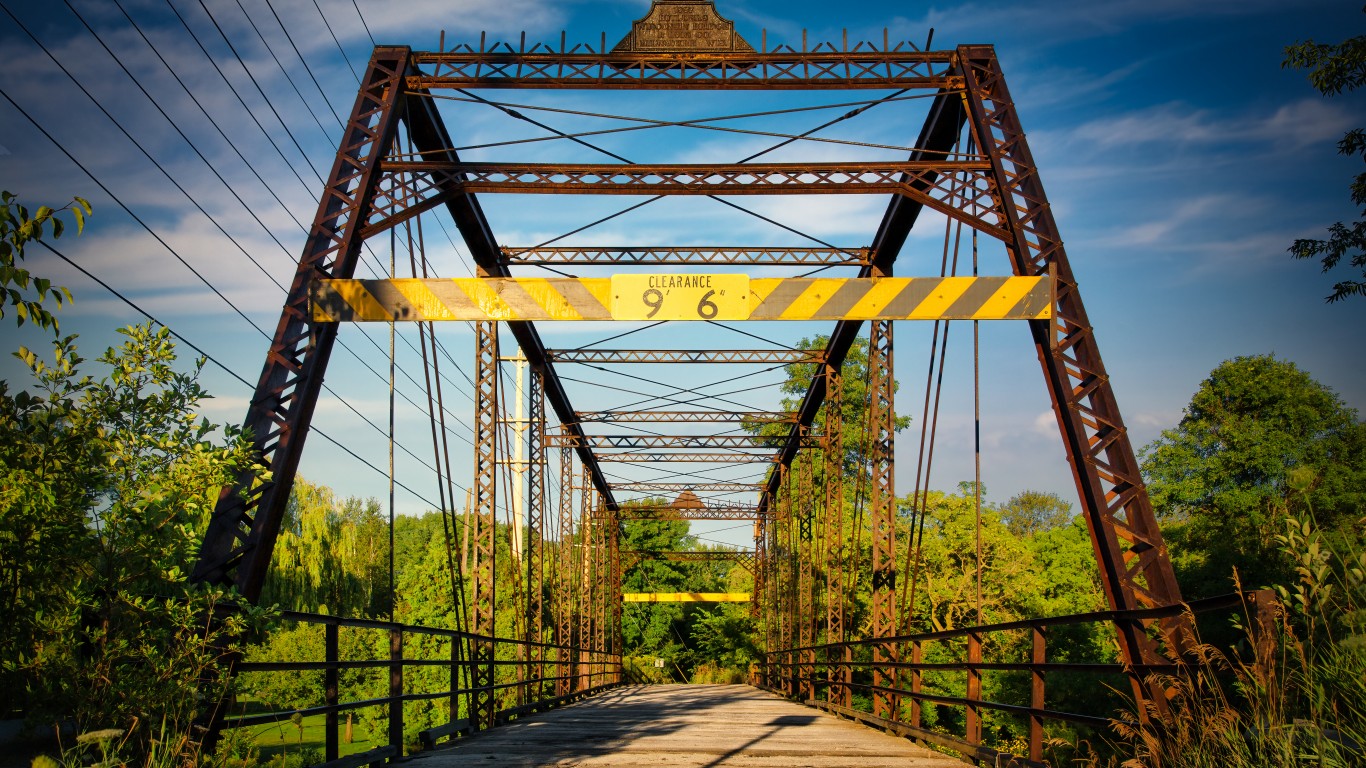
26. Wisconsin
> Share of bridges in poor condition: 6.9%
> Total bridges in poor condition: 979 — 19th most
> Total bridges in Wisconsin: 14,271 — 19th most
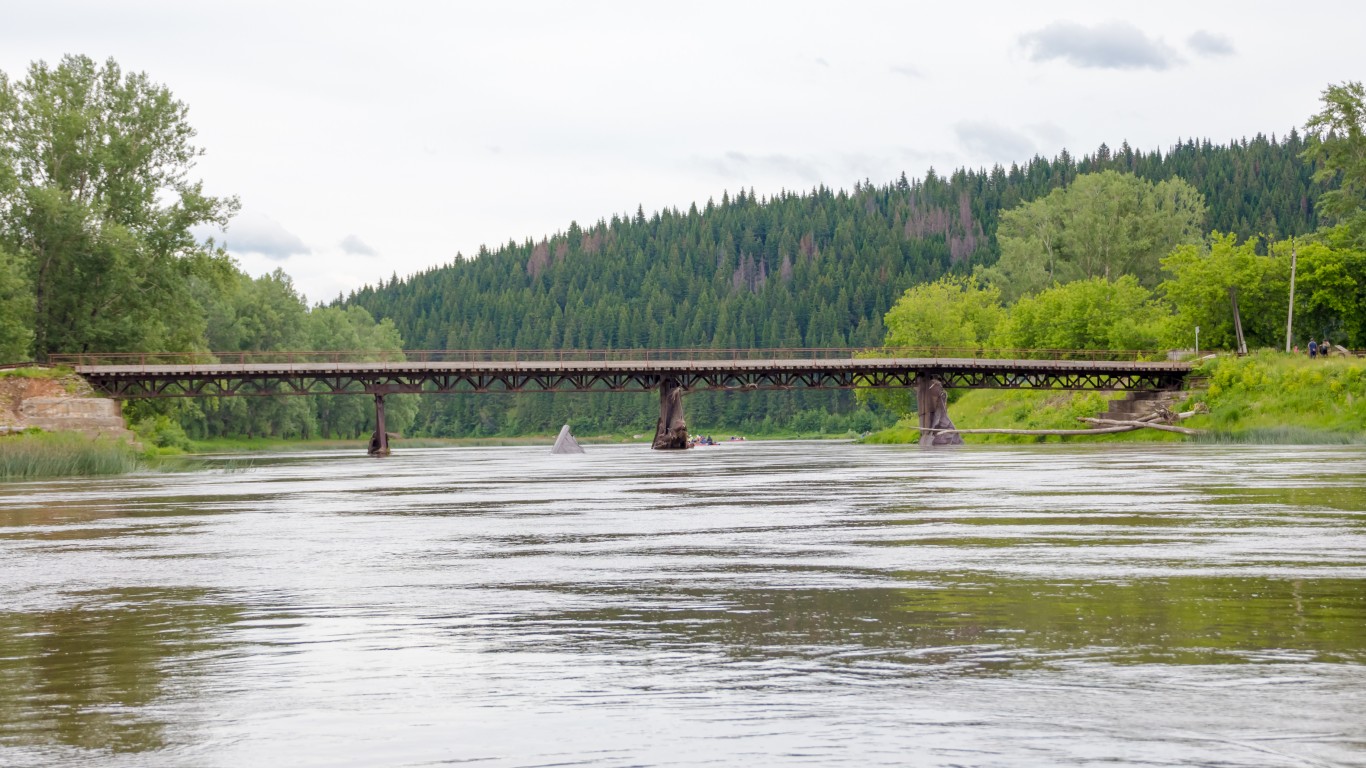
25. Wyoming
> Share of bridges in poor condition: 7.0%
> Total bridges in poor condition: 218 — 11th fewest
> Total bridges in Wyoming: 3,122 — 10th fewest
[in-text-ad]
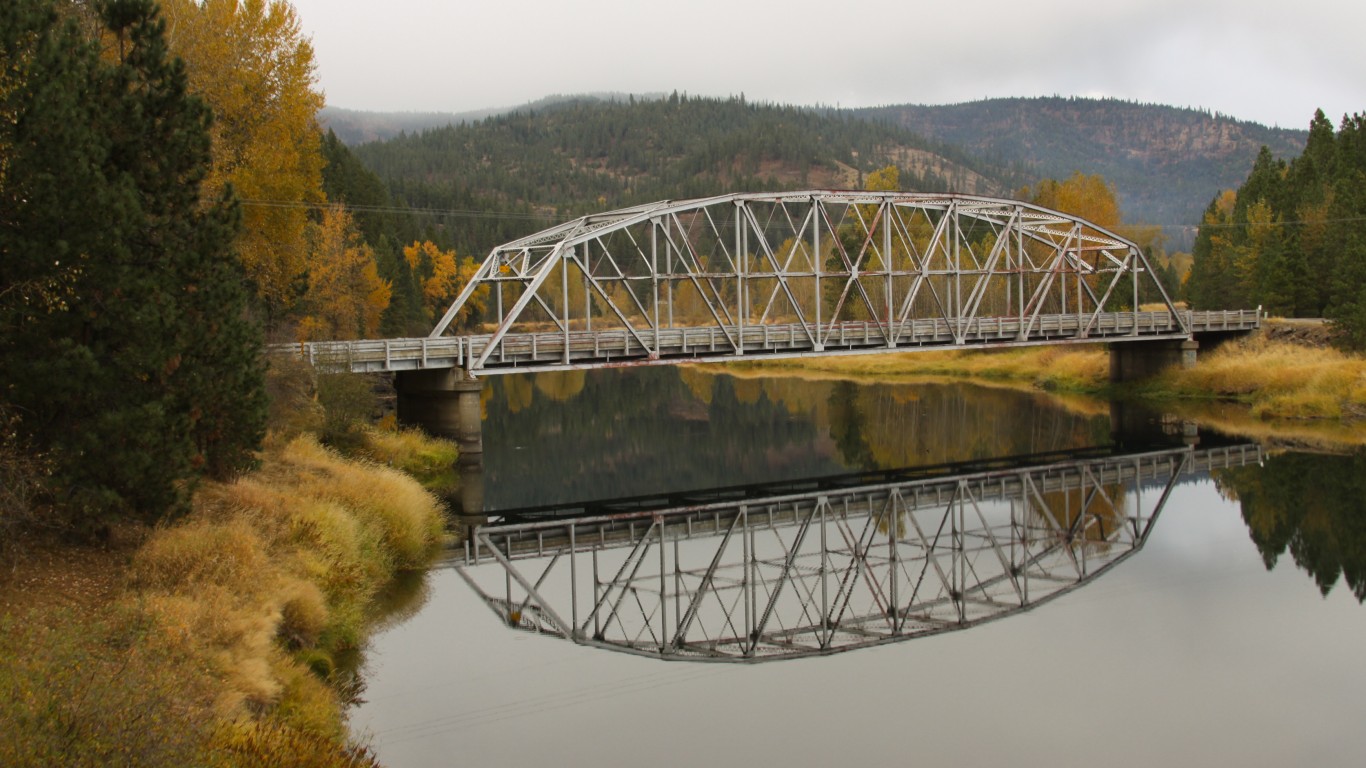
24. Montana
> Share of bridges in poor condition: 7.2%
> Total bridges in poor condition: 377 — 17th fewest
> Total bridges in Montana: 5,271 — 16th fewest
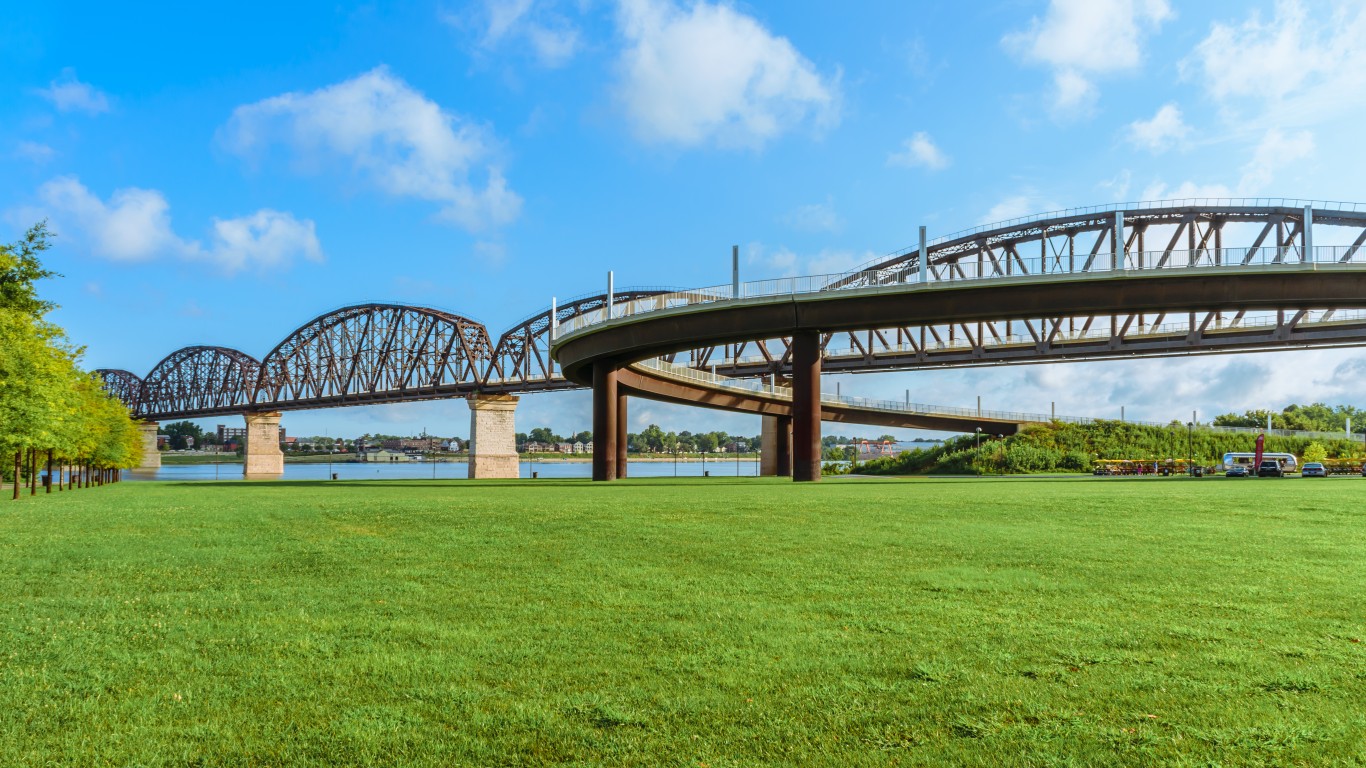
23. Kentucky
> Share of bridges in poor condition: 7.2%
> Total bridges in poor condition: 1,033 — 18th most
> Total bridges in Kentucky: 14,422 — 18th most
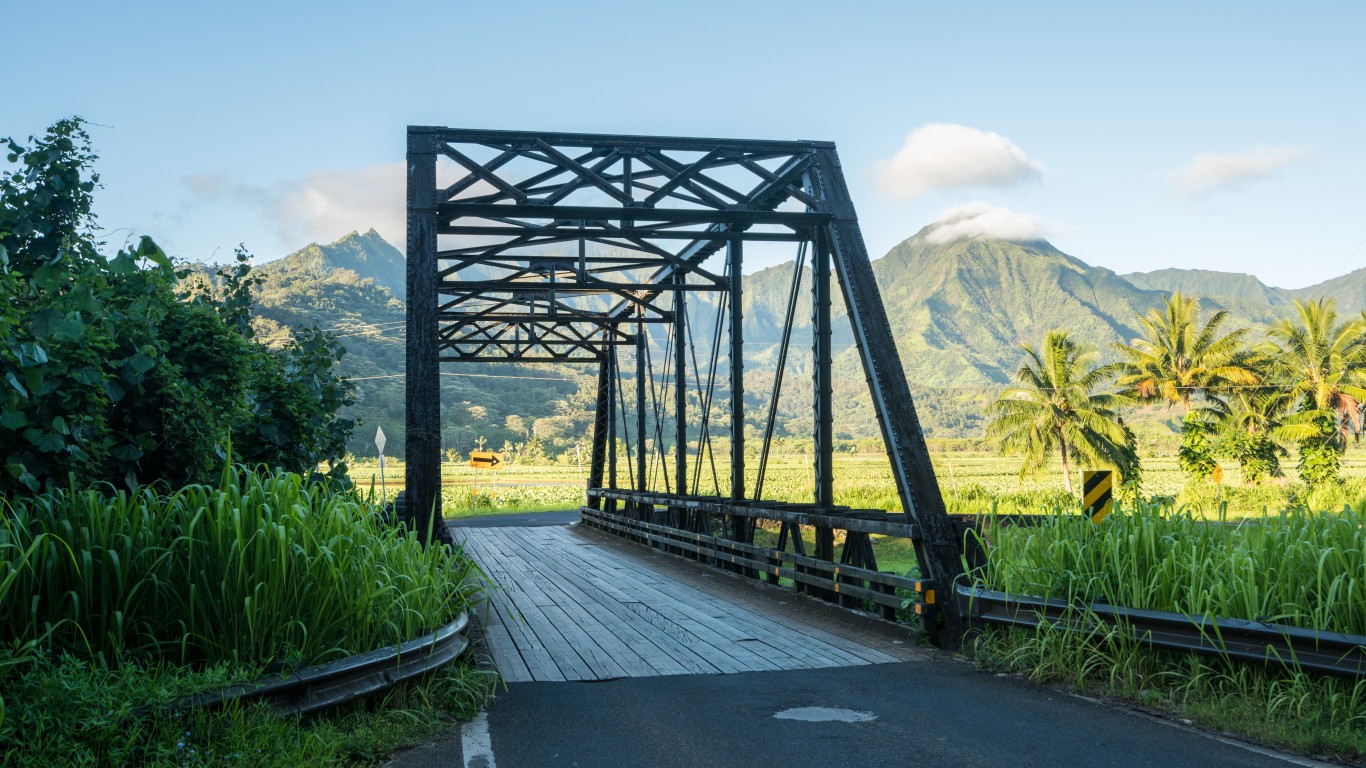
22. Hawaii
> Share of bridges in poor condition: 7.3%
> Total bridges in poor condition: 84 — 5th fewest
> Total bridges in Hawaii: 1,153 — 3rd fewest
[in-text-ad-2]
21. New Jersey
> Share of bridges in poor condition: 7.4%
> Total bridges in poor condition: 502 — 24th fewest
> Total bridges in New Jersey: 6,801 — 19th fewest
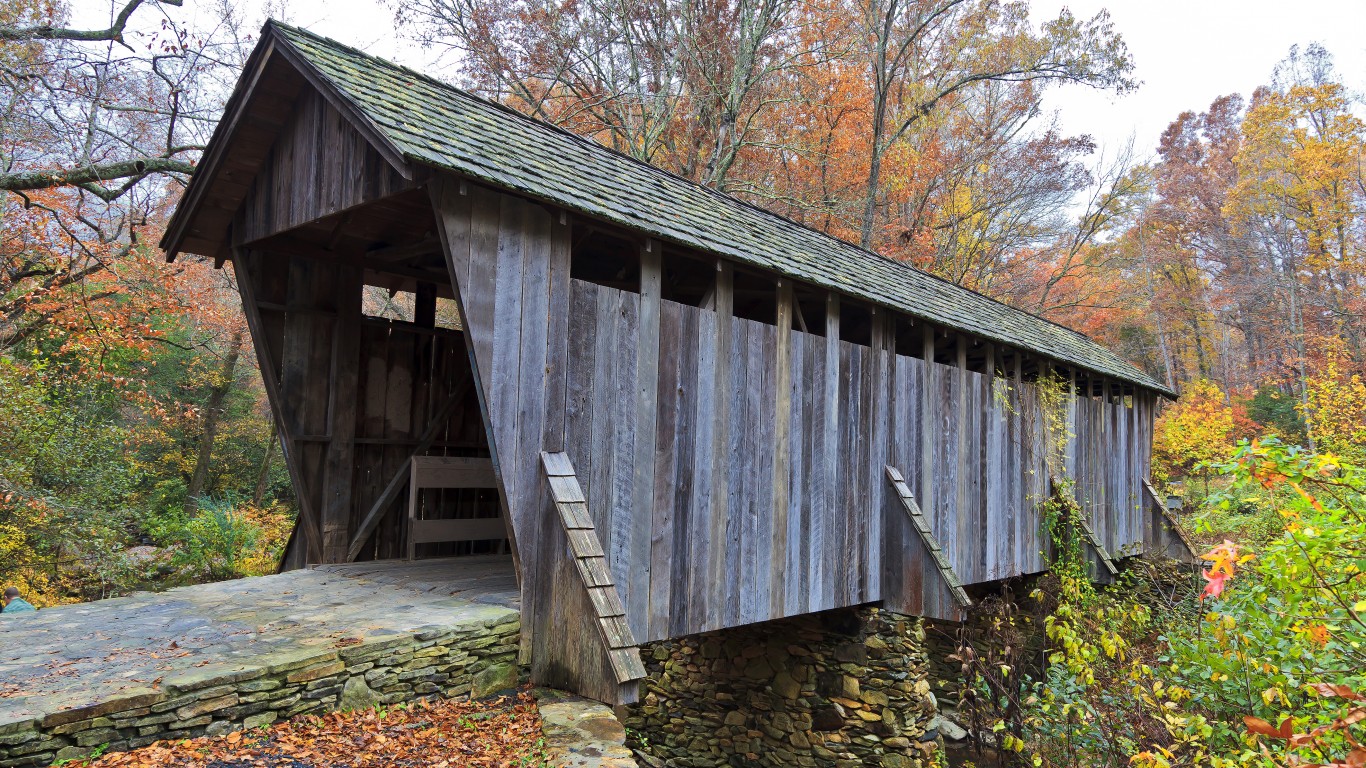
20. North Carolina
> Share of bridges in poor condition: 7.8%
> Total bridges in poor condition: 1,460 — 10th most
> Total bridges in North Carolina: 18,749 — 12th most
[in-text-ad]
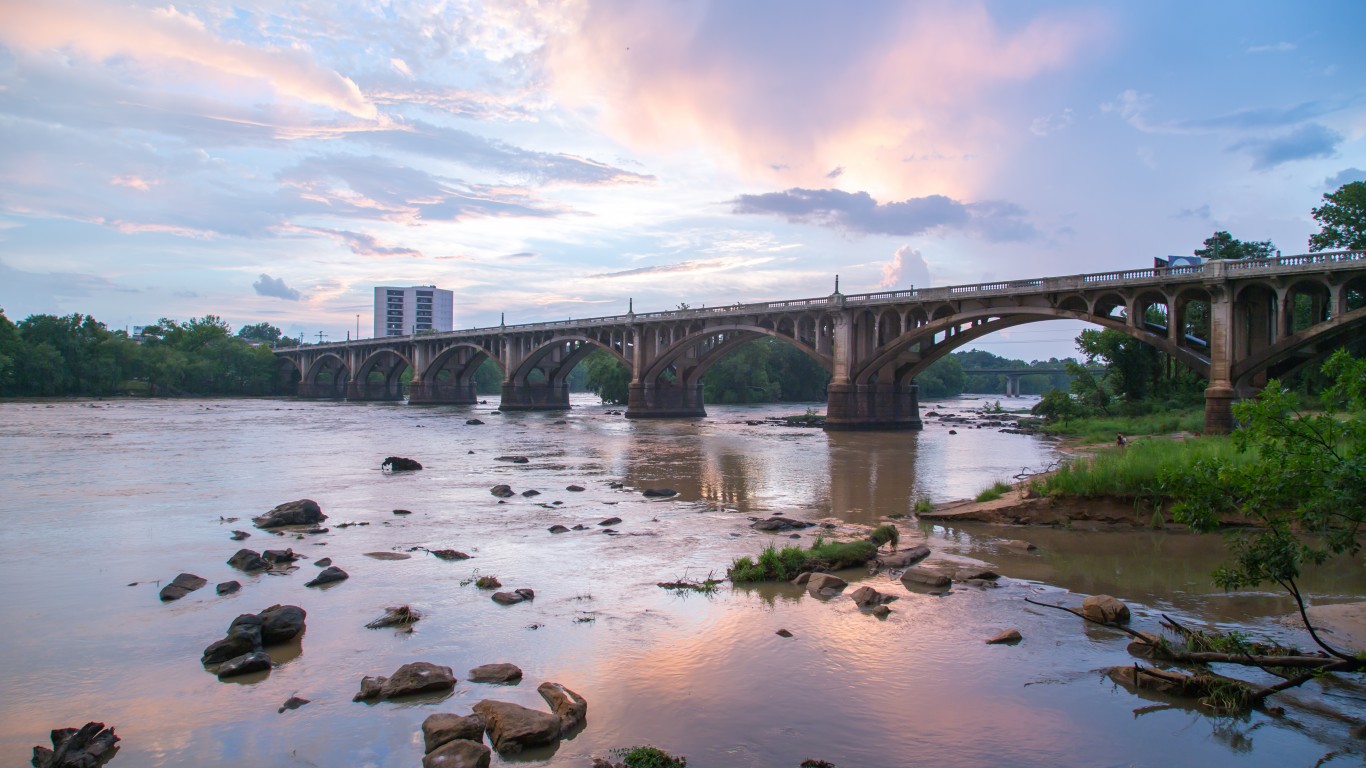
19. South Carolina
> Share of bridges in poor condition: 7.9%
> Total bridges in poor condition: 745 — 22nd most
> Total bridges in South Carolina: 9,455 — 25th fewest
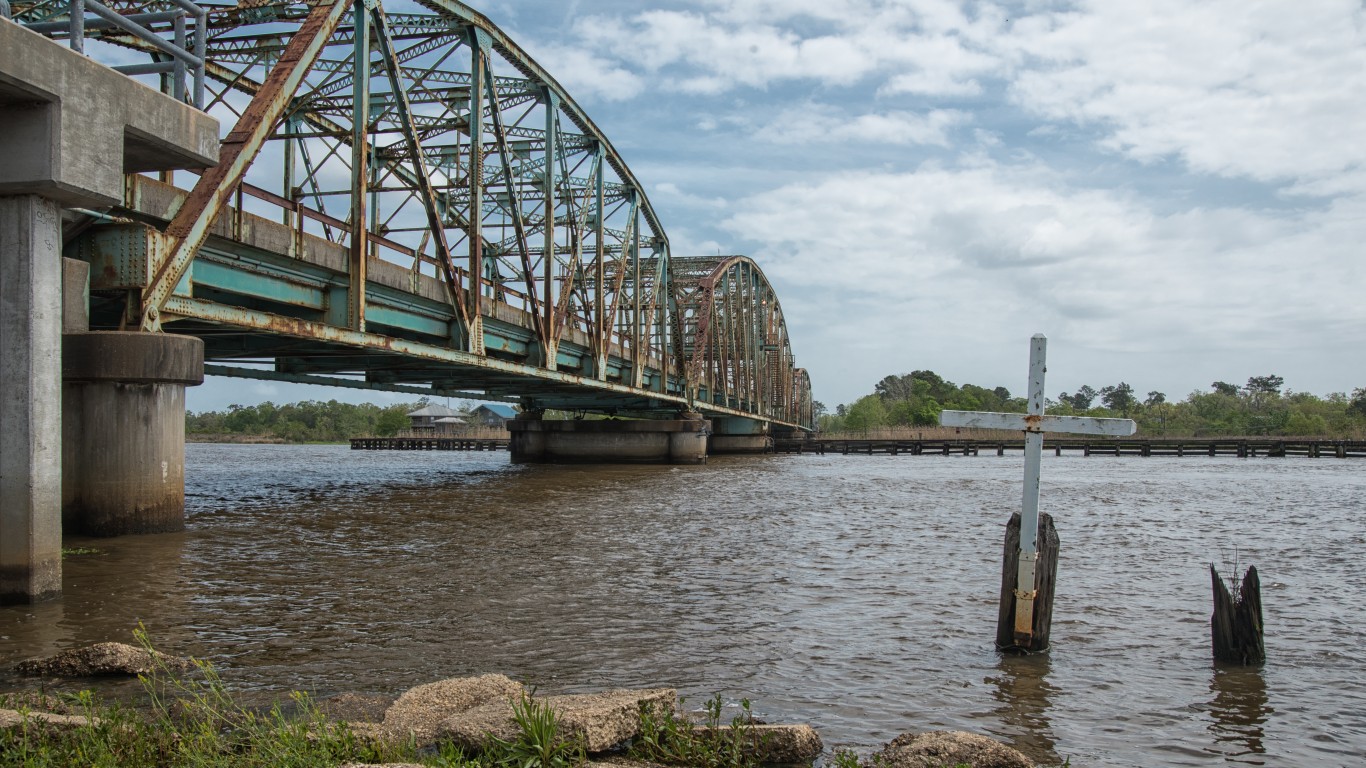
18. Mississippi
> Share of bridges in poor condition: 8.2%
> Total bridges in poor condition: 1,386 — 11th most
> Total bridges in Mississippi: 16,878 — 14th most
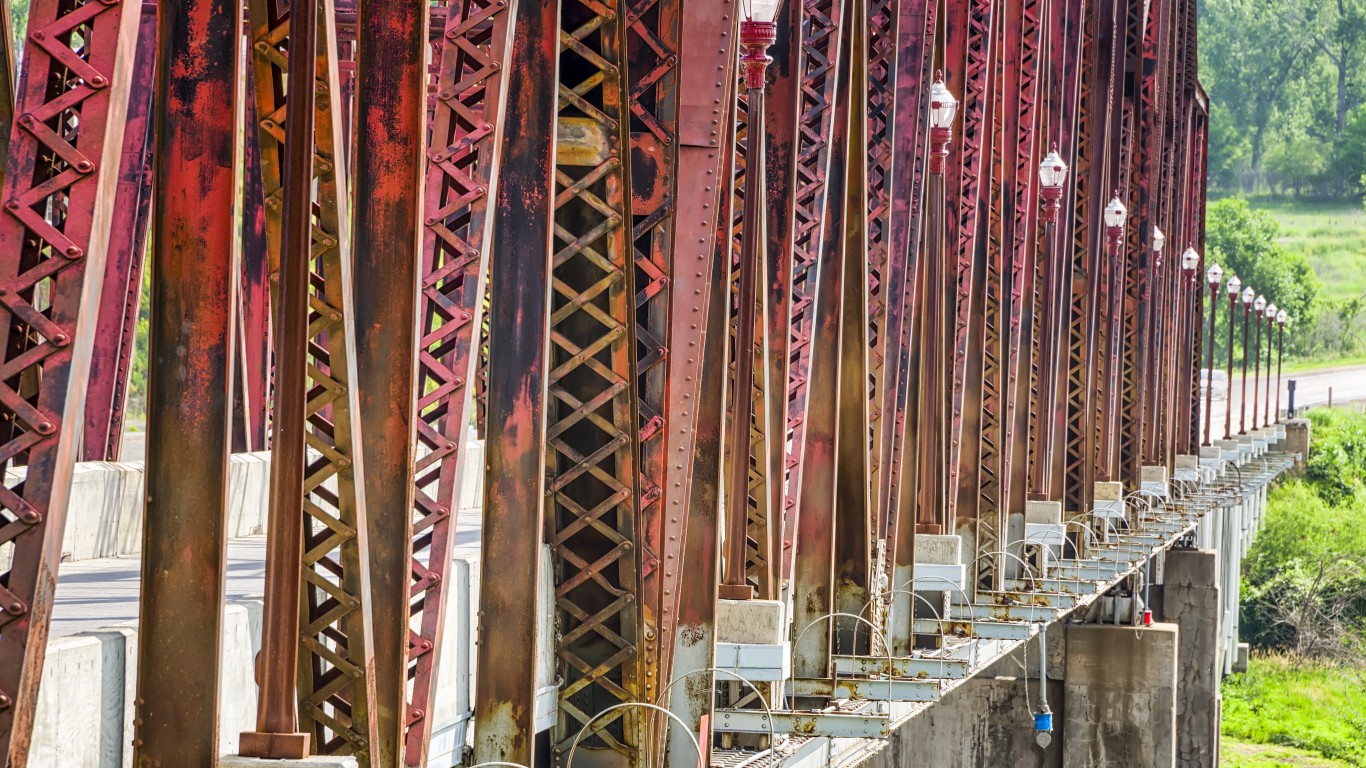
17. Nebraska
> Share of bridges in poor condition: 8.5%
> Total bridges in poor condition: 1,302 — 14th most
> Total bridges in Nebraska: 15,348 — 16th most
[in-text-ad-2]
16. New Hampshire
> Share of bridges in poor condition: 8.6%
> Total bridges in poor condition: 215 — 10th fewest
> Total bridges in New Hampshire: 2,514 — 7th fewest
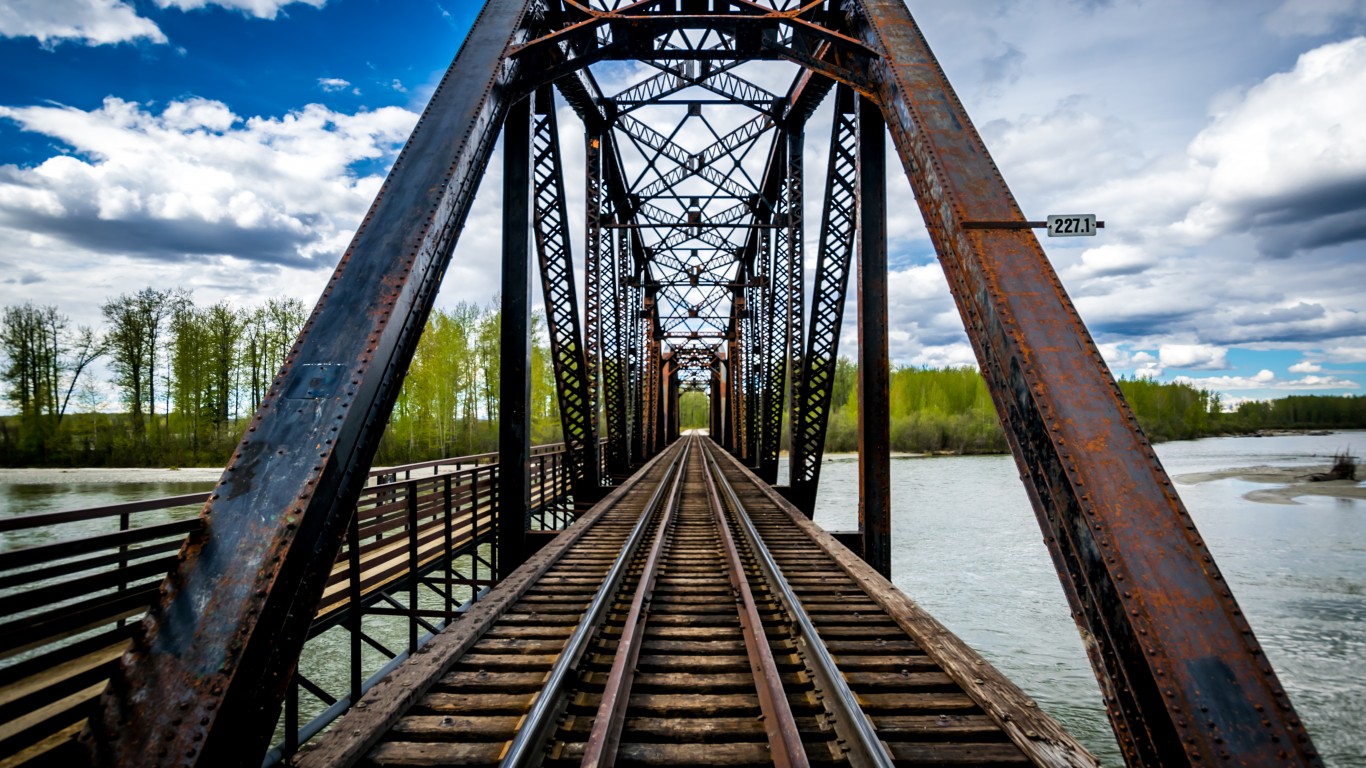
15. Alaska
> Share of bridges in poor condition: 8.6%
> Total bridges in poor condition: 141 — 7th fewest
> Total bridges in Alaska: 1,645 — 4th fewest
[in-text-ad]
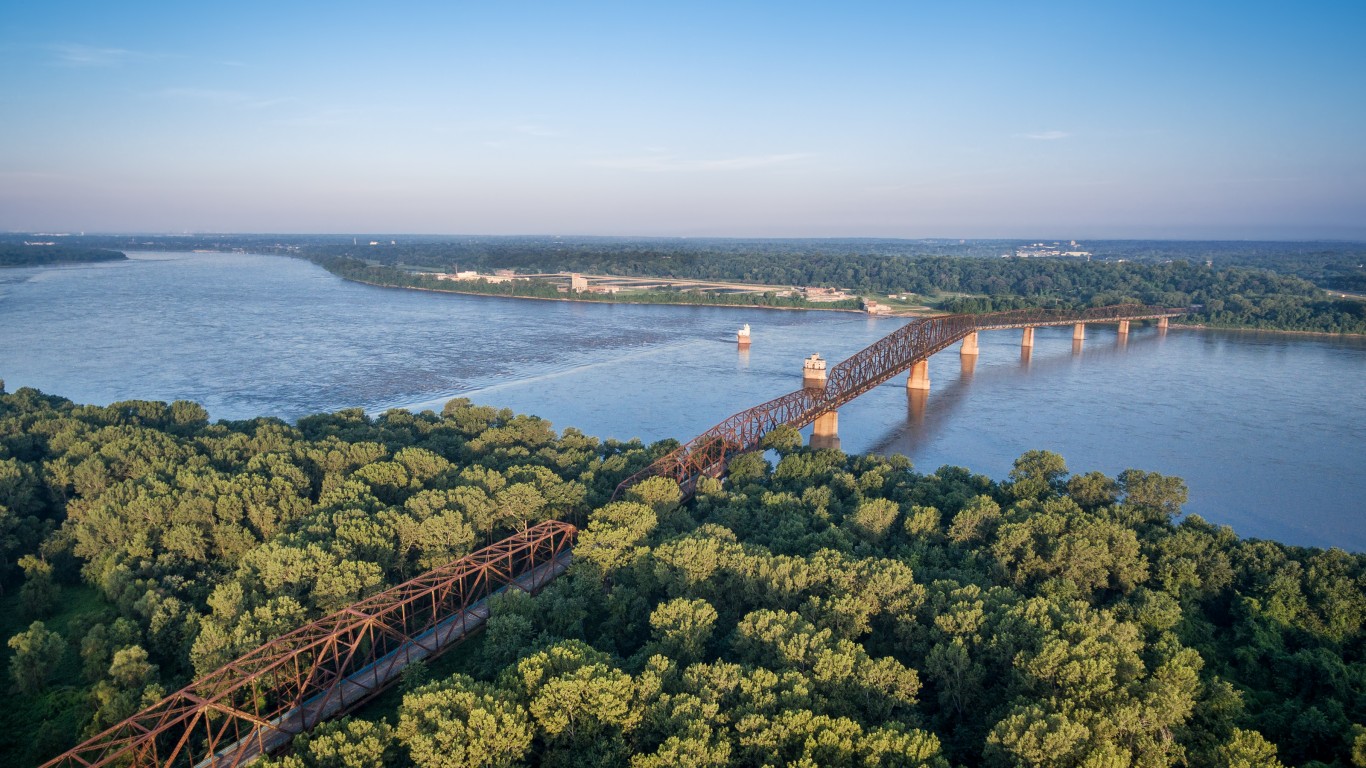
14. Illinois
> Share of bridges in poor condition: 8.8%
> Total bridges in poor condition: 2,374 — 3rd most
> Total bridges in Illinois: 26,848 — 3rd most

13. Missouri
> Share of bridges in poor condition: 8.9%
> Total bridges in poor condition: 2,190 — 5th most
> Total bridges in Missouri: 24,538 — 6th most
12. Massachusetts
> Share of bridges in poor condition: 9.0%
> Total bridges in poor condition: 472 — 22nd fewest
> Total bridges in Massachusetts: 5,229 — 15th fewest
[in-text-ad-2]
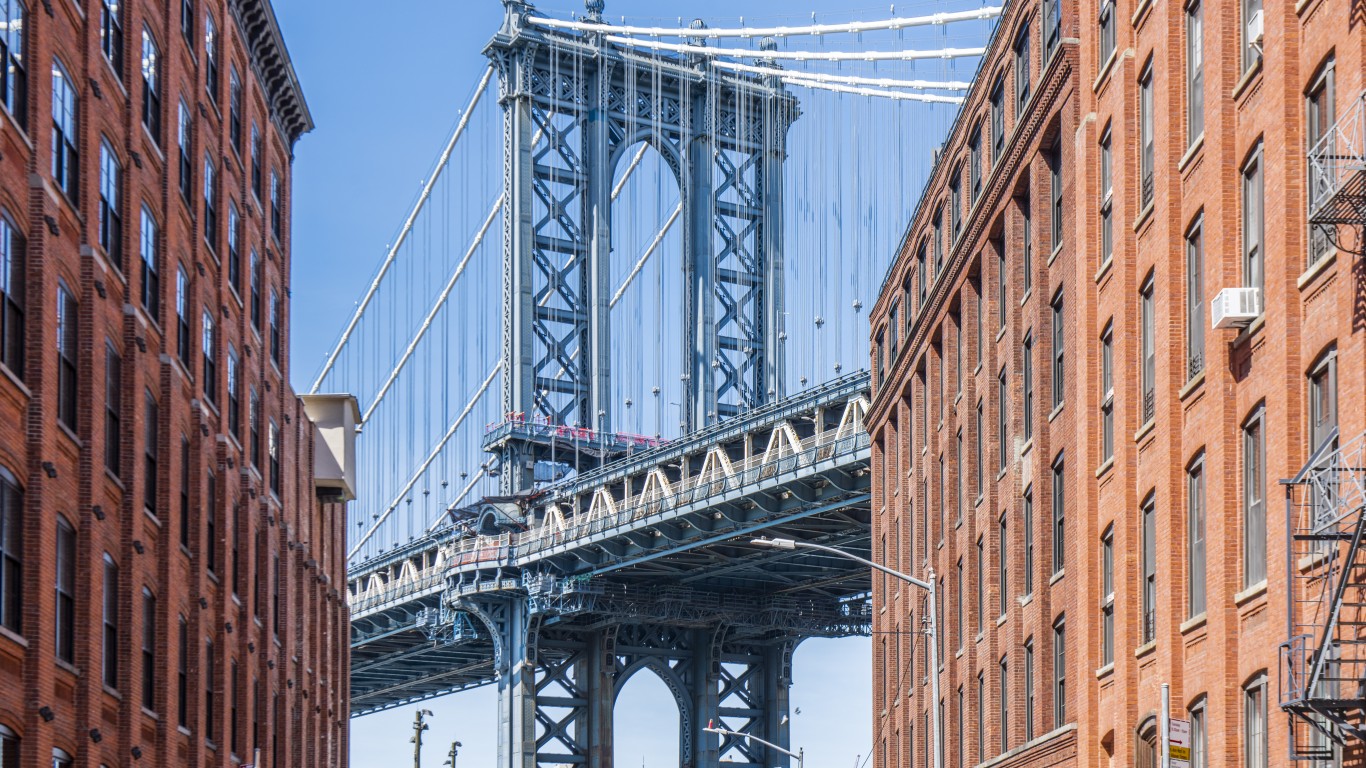
11. New York
> Share of bridges in poor condition: 9.7%
> Total bridges in poor condition: 1,702 — 6th most
> Total bridges in New York: 17,552 — 13th most
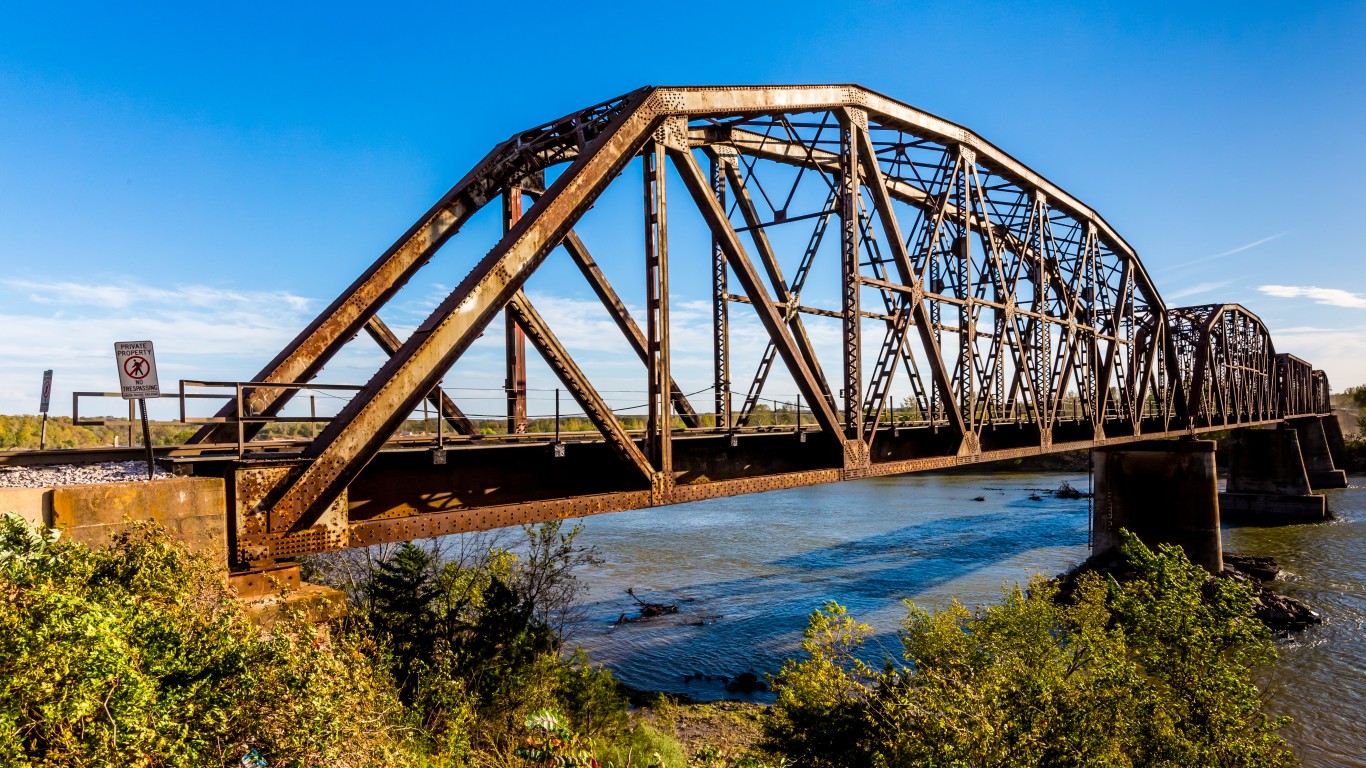
10. Oklahoma
> Share of bridges in poor condition: 10.0%
> Total bridges in poor condition: 2,326 — 4th most
> Total bridges in Oklahoma: 23,155 — 8th most
[in-text-ad]
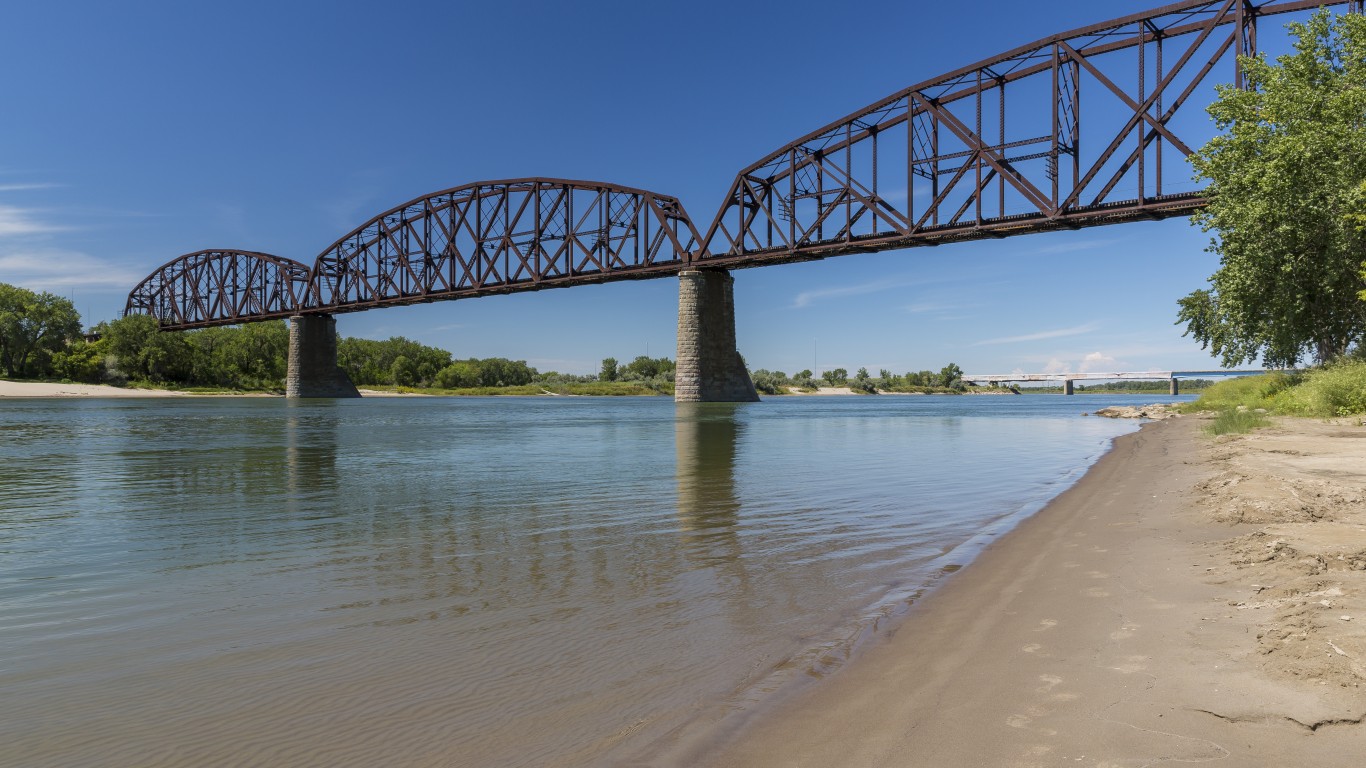
9. North Dakota
> Share of bridges in poor condition: 10.3%
> Total bridges in poor condition: 444 — 21st fewest
> Total bridges in North Dakota: 4,312 — 12th fewest
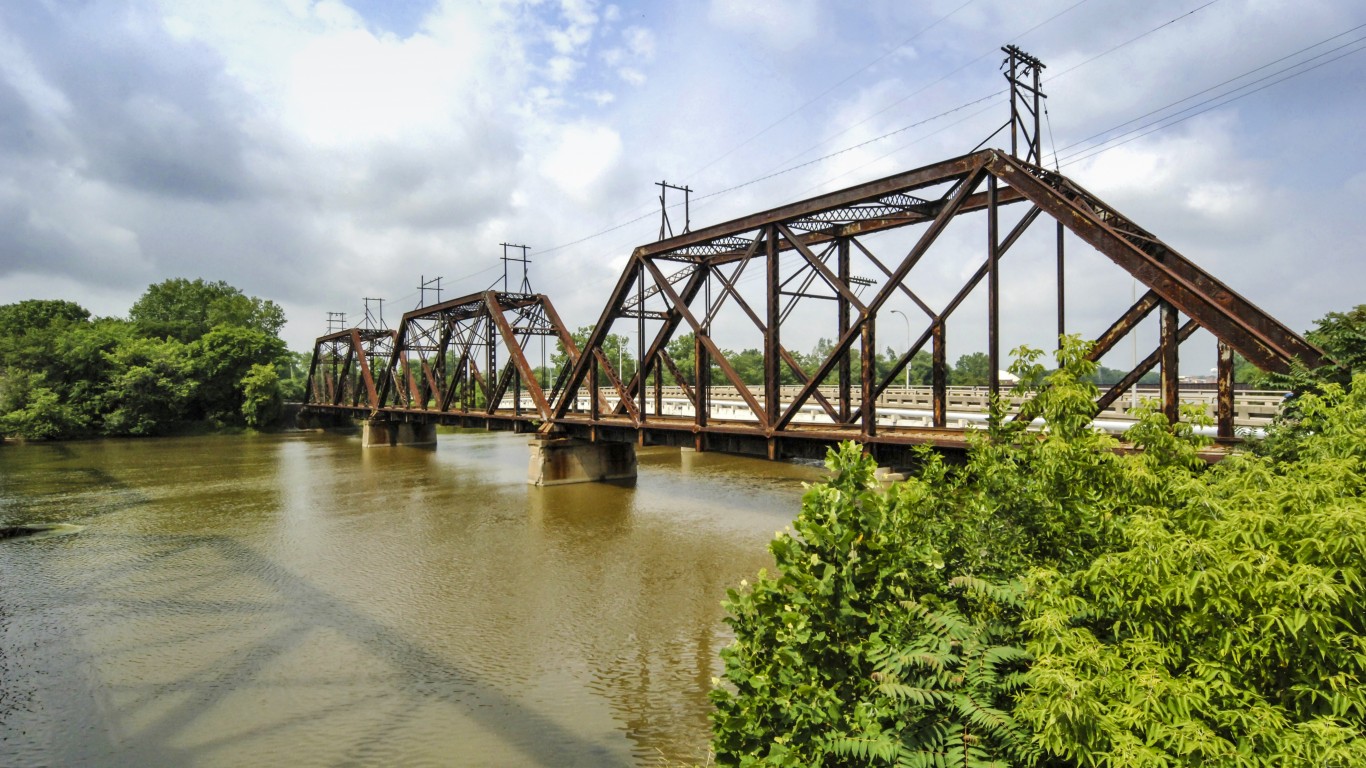
8. Michigan
> Share of bridges in poor condition: 10.8%
> Total bridges in poor condition: 1,219 — 15th most
> Total bridges in Michigan: 11,271 — 25th most
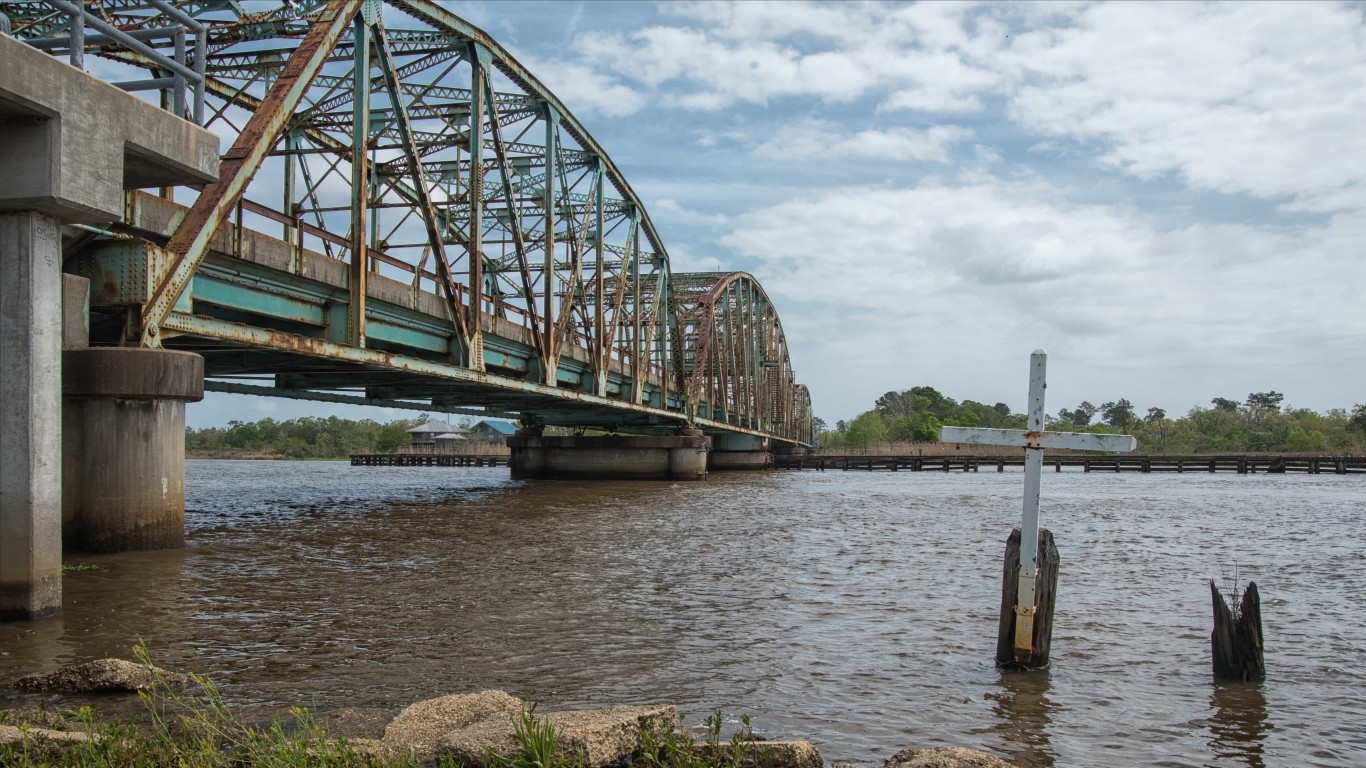
7. Louisiana
> Share of bridges in poor condition: 12.7%
> Total bridges in poor condition: 1,634 — 7th most
> Total bridges in Louisiana: 12,853 — 23rd most
[in-text-ad-2]
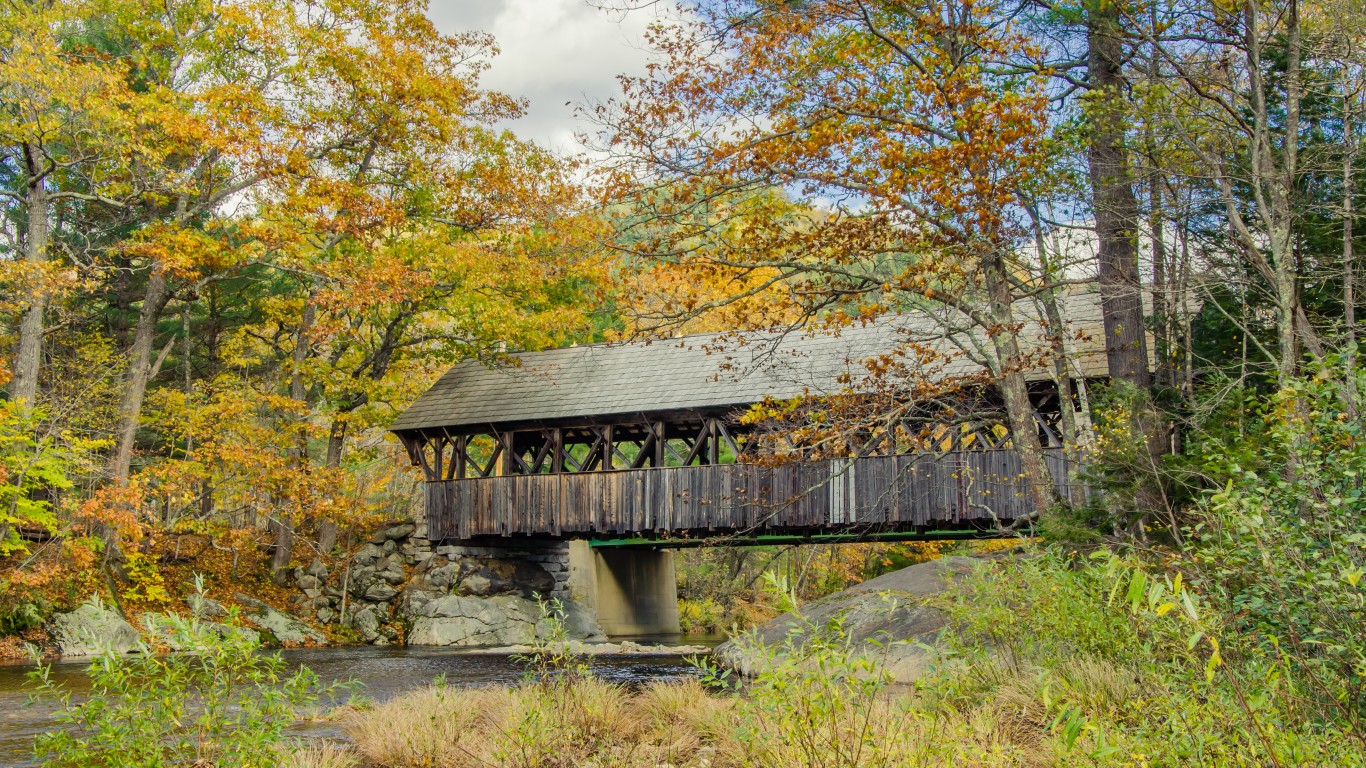
6. Maine
> Share of bridges in poor condition: 12.7%
> Total bridges in poor condition: 315 — 15th fewest
> Total bridges in Maine: 2,472 — 6th fewest
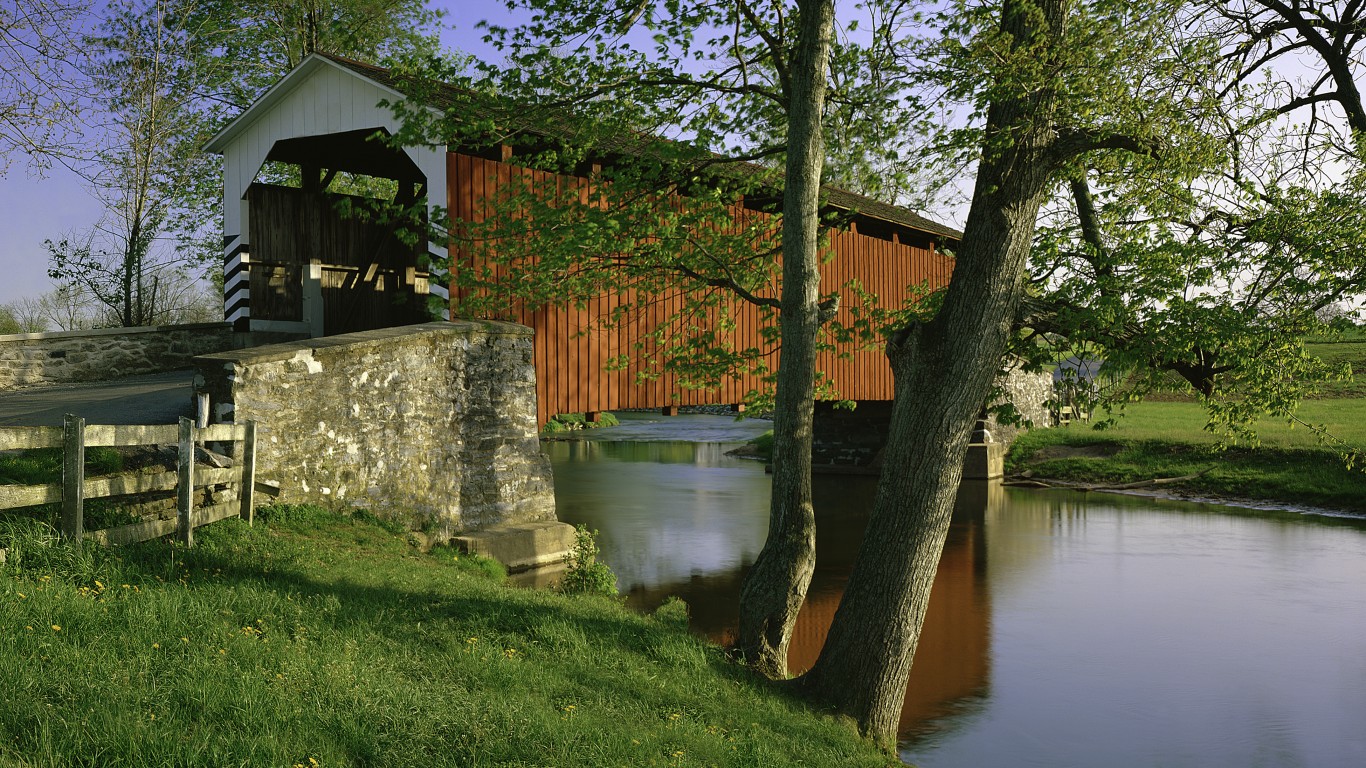
5. Pennsylvania
> Share of bridges in poor condition: 14.6%
> Total bridges in poor condition: 3,353 — 2nd most
> Total bridges in Pennsylvania: 22,965 — 9th most
[in-text-ad]
4. South Dakota
> Share of bridges in poor condition: 17.7%
> Total bridges in poor condition: 1,038 — 17th most
> Total bridges in South Dakota: 5,880 — 18th fewest
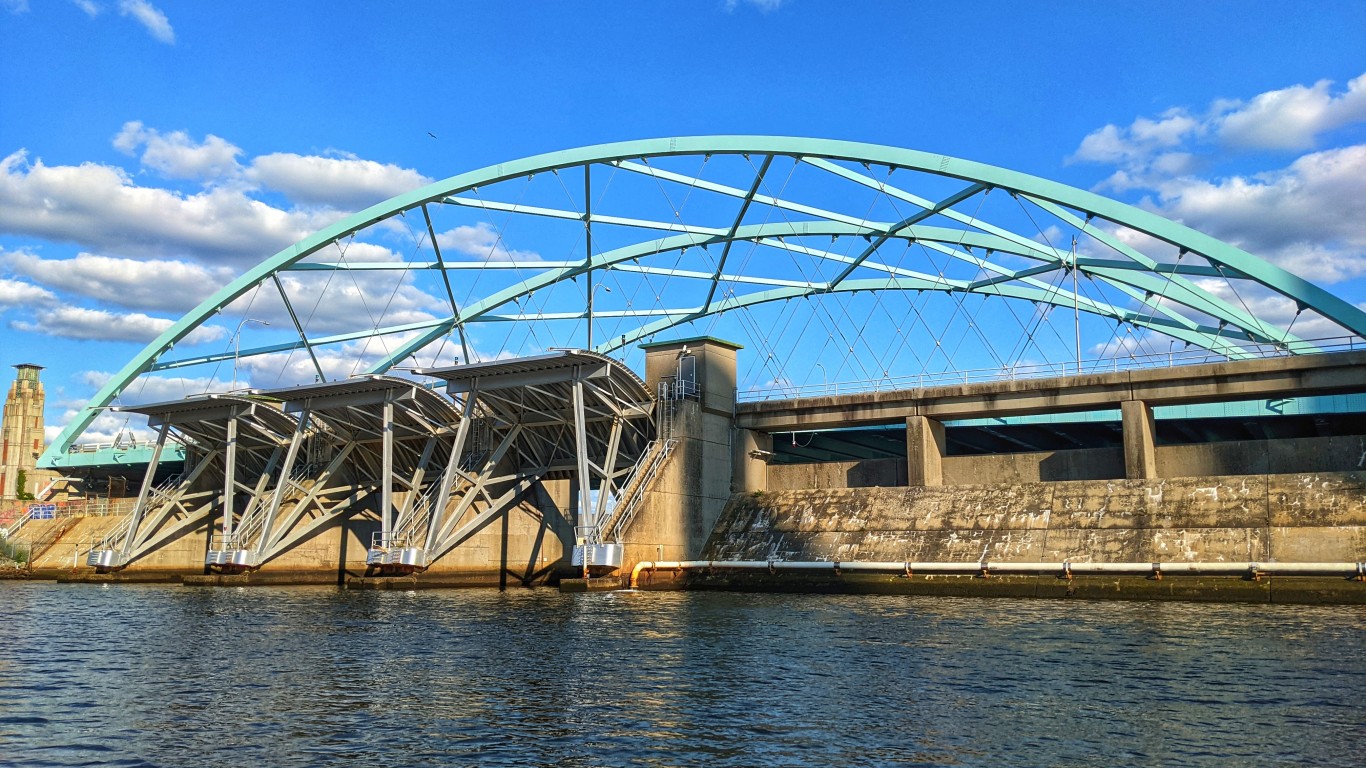
3. Rhode Island
> Share of bridges in poor condition: 19.0%
> Total bridges in poor condition: 148 — 8th fewest
> Total bridges in Rhode Island: 777 — the fewest
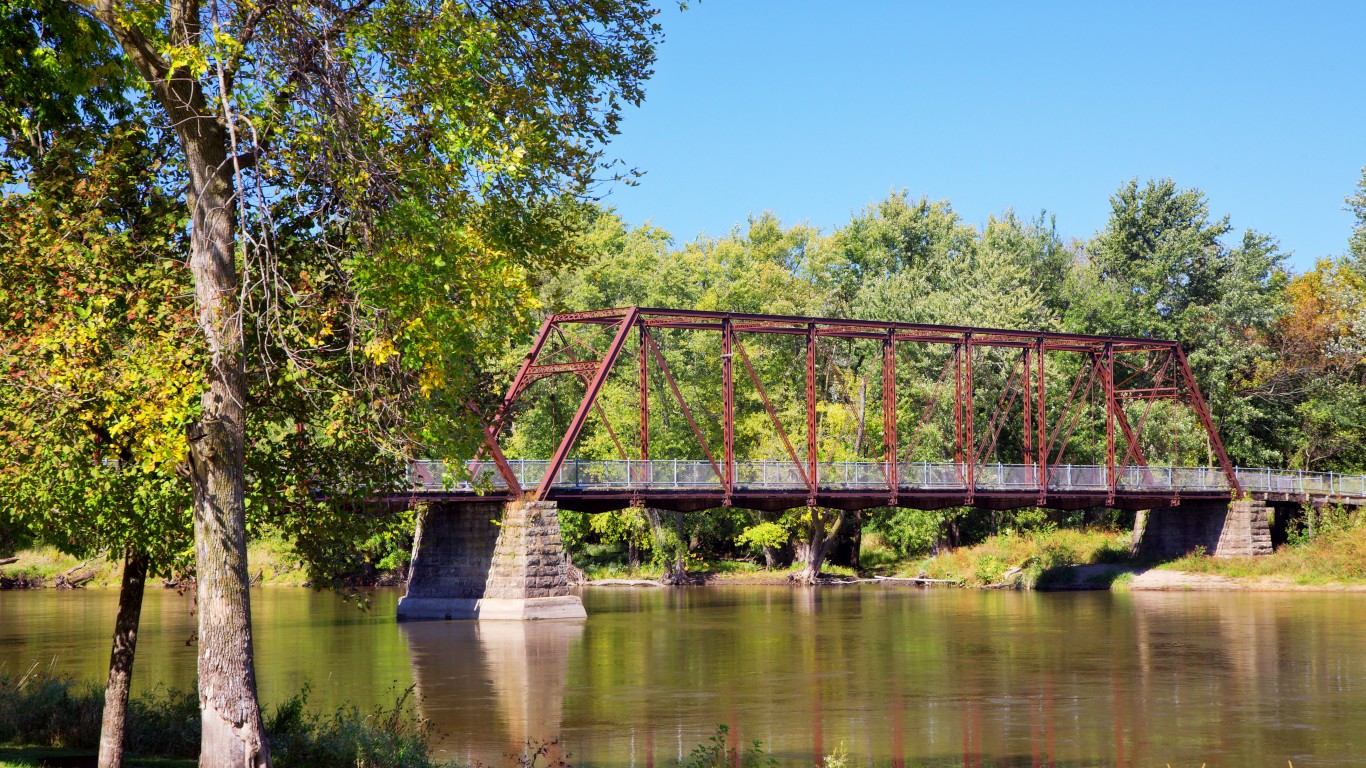
2. Iowa
> Share of bridges in poor condition: 19.1%
> Total bridges in poor condition: 4,571 — the most
> Total bridges in Iowa: 23,982 — 7th most
[in-text-ad-2]
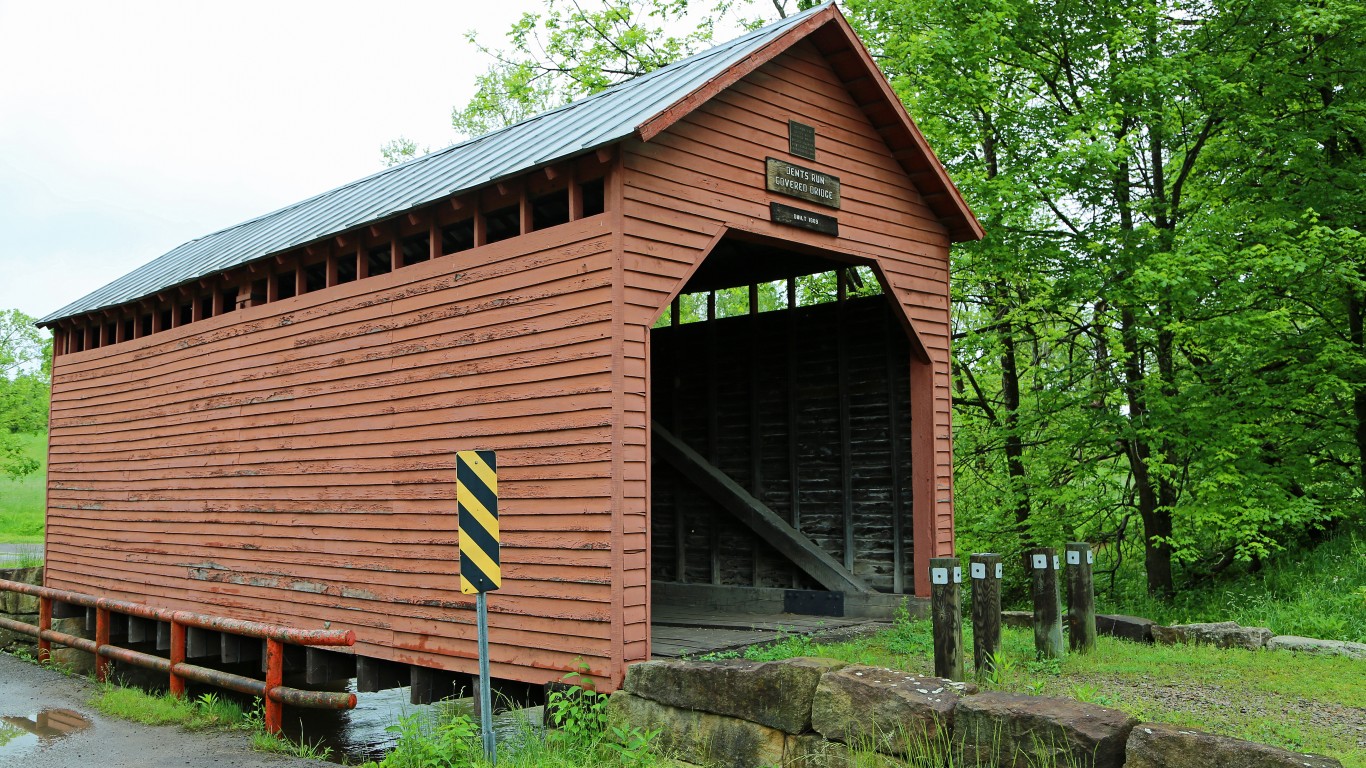
1. West Virginia
> Share of bridges in poor condition: 21.2%
> Total bridges in poor condition: 1,545 — 8th most
> Total bridges in West Virginia: 7,295 — 20th fewest
Take Charge of Your Retirement In Just A Few Minutes (Sponsor)
Retirement planning doesn’t have to feel overwhelming. The key is finding expert guidance—and SmartAsset’s simple quiz makes it easier than ever for you to connect with a vetted financial advisor.
Here’s how it works:
- Answer a Few Simple Questions. Tell us a bit about your goals and preferences—it only takes a few minutes!
- Get Matched with Vetted Advisors Our smart tool matches you with up to three pre-screened, vetted advisors who serve your area and are held to a fiduciary standard to act in your best interests. Click here to begin
- Choose Your Fit Review their profiles, schedule an introductory call (or meet in person), and select the advisor who feel is right for you.
Why wait? Start building the retirement you’ve always dreamed of. Click here to get started today!
Thank you for reading! Have some feedback for us?
Contact the 24/7 Wall St. editorial team.
 24/7 Wall St.
 24/7 Wall St.
 24/7 Wall St.