
Pennsylvania may be the country’s fifth-most populous state, but its population growth has lagged for decades. According to the 2020 U.S. Census, the Keystone State’s resident population edged past 13 million, from 12.7 million in 2010, a gain of only 2.4% compared to the nation’s 7.4% population growth in the same period. Here’s how every state’s population has changed since 2010.
The state remains an important electoral battleground, but it just lost a seat in the U.S. House of Representatives and could lose federal money for social and infrastructure programs to other states whose populations have grown at a higher rate, according to the Associated Press. Here are America’s fastest shrinking cities.
Pennsylvania ranks eighth in the nation in the highest number of people moving across state lines, according to a 2020 report from Move.org. This is partly spurred by income-related problems tied to the coronavirus pandemic.
Like many Americans, Pennsylvania residents pursued warmer temperatures in lower-cost Sun Belt states like Georgia, Florida, and Texas. Others moved to nearby locations in New Jersey, New York, and Ohio.
Click here to see where people from Pennsylvania are moving the most
To identify where people from Pennsylvania are moving to most, 24/7 Wall St. reviewed state-to-state migration flows from the U.S. Census Bureau’s American Community Survey. Migration flow figures show the estimated number of people living in other states (or Washington D.C.) in 2019 who had lived in Pennsylvania the previous year. State population and population change figures are based on one-year estimates from the ACS (five-year estimates for Washington D.C.)
“Data are based on a sample and are subject to sampling variability. The degree of uncertainty for an estimate arising from sampling variability is represented through the use of a margin of error. The value shown here is the 90 percent margin of error. The margin of error can be interpreted roughly as providing a 90 percent probability that the interval defined by the estimate minus the margin of error and the estimate plus the margin of error (the lower and upper confidence bounds) contains the true value. In addition to sampling variability, the ACS estimates are subject to nonsampling error (for a discussion of non sampling variability, see Accuracy of the Data). The effect of nonsampling error is not represented in these tables.”

50. North Dakota
> People from Pennsylvania who moved to North Dakota in 2019: 19 (0.01% of all outbound Pennsylvanians)
> 1-year net change in population: 1,985 (0.26% – 24th highest)
> Total population: 762,062 (5th lowest)
[in-text-ad]

49. Hawaii
> People from Pennsylvania who moved to Hawaii in 2019: 23 (0.01% of all outbound Pennsylvanians)
> 1-year net change in population: -4,619 (-0.33% – 7th lowest)
> Total population: 1,415,872 (12th lowest)

48. South Dakota
> People from Pennsylvania who moved to South Dakota in 2019: 28 (0.01% of all outbound Pennsylvanians)
> 1-year net change in population: 2,424 (0.27% – 22nd highest)
> Total population: 884,659 (6th lowest)

47. Nebraska
> People from Pennsylvania who moved to Nebraska in 2019: 157 (0.06% of all outbound Pennsylvanians)
> 1-year net change in population: 5,140 (0.27% – 23rd highest)
> Total population: 1,934,408 (15th lowest)
[in-text-ad-2]

46. Iowa
> People from Pennsylvania who moved to Iowa in 2019: 318 (0.12% of all outbound Pennsylvanians)
> 1-year net change in population: -1,075 (-0.03% – 14th lowest)
> Total population: 3,155,070 (21st lowest)
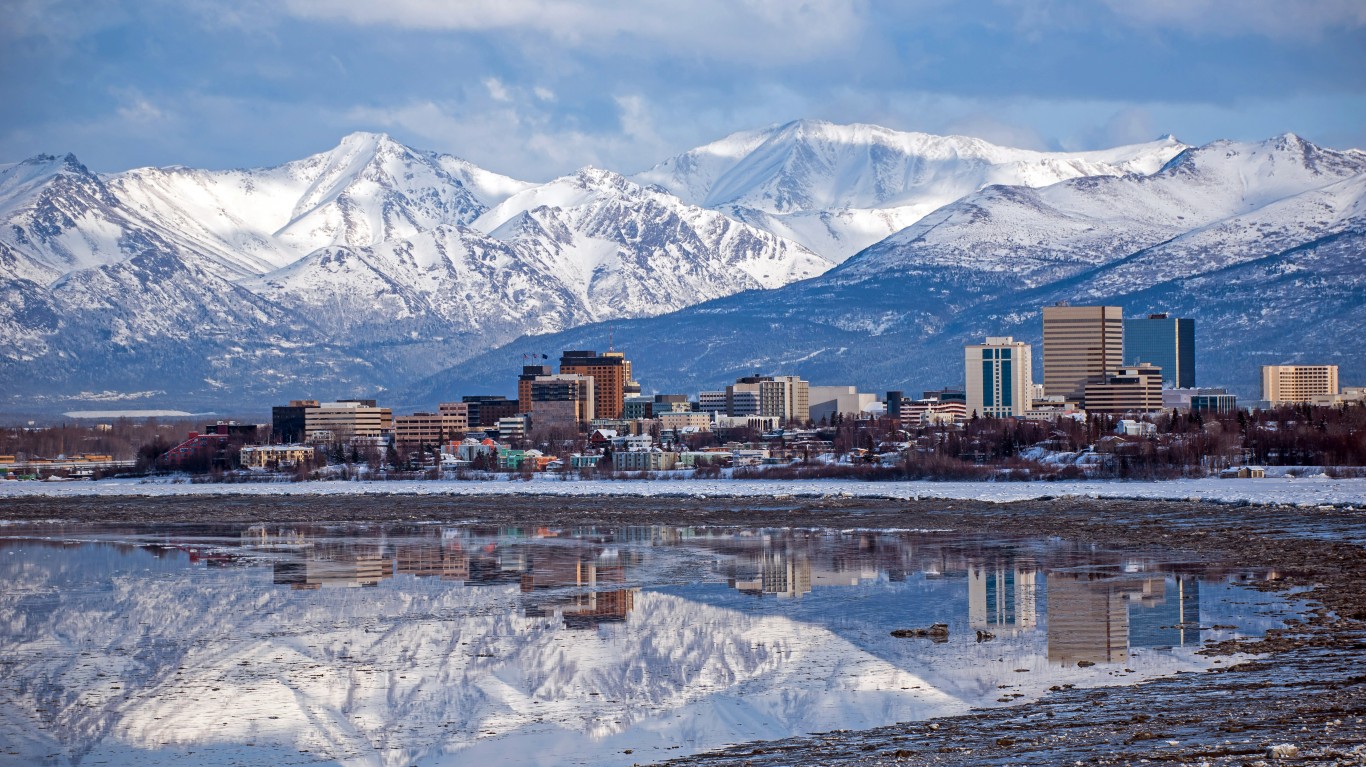
45. Alaska
> People from Pennsylvania who moved to Alaska in 2019: 385 (0.15% of all outbound Pennsylvanians)
> 1-year net change in population: -5,893 (-0.81% – the lowest)
> Total population: 731,545 (4th lowest)
[in-text-ad]

44. Wyoming
> People from Pennsylvania who moved to Wyoming in 2019: 447 (0.17% of all outbound Pennsylvanians)
> 1-year net change in population: 1,022 (0.18% – 22nd lowest)
> Total population: 578,759 (the lowest)

43. Utah
> People from Pennsylvania who moved to Utah in 2019: 478 (0.19% of all outbound Pennsylvanians)
> 1-year net change in population: 44,853 (1.40% – 4th highest)
> Total population: 3,205,958 (22nd lowest)

42. Arkansas
> People from Pennsylvania who moved to Arkansas in 2019: 533 (0.21% of all outbound Pennsylvanians)
> 1-year net change in population: 3,979 (0.13% – 20th lowest)
> Total population: 3,017,804 (19th lowest)
[in-text-ad-2]

41. Montana
> People from Pennsylvania who moved to Montana in 2019: 651 (0.25% of all outbound Pennsylvanians)
> 1-year net change in population: 6,473 (0.61% – 16th highest)
> Total population: 1,068,778 (9th lowest)
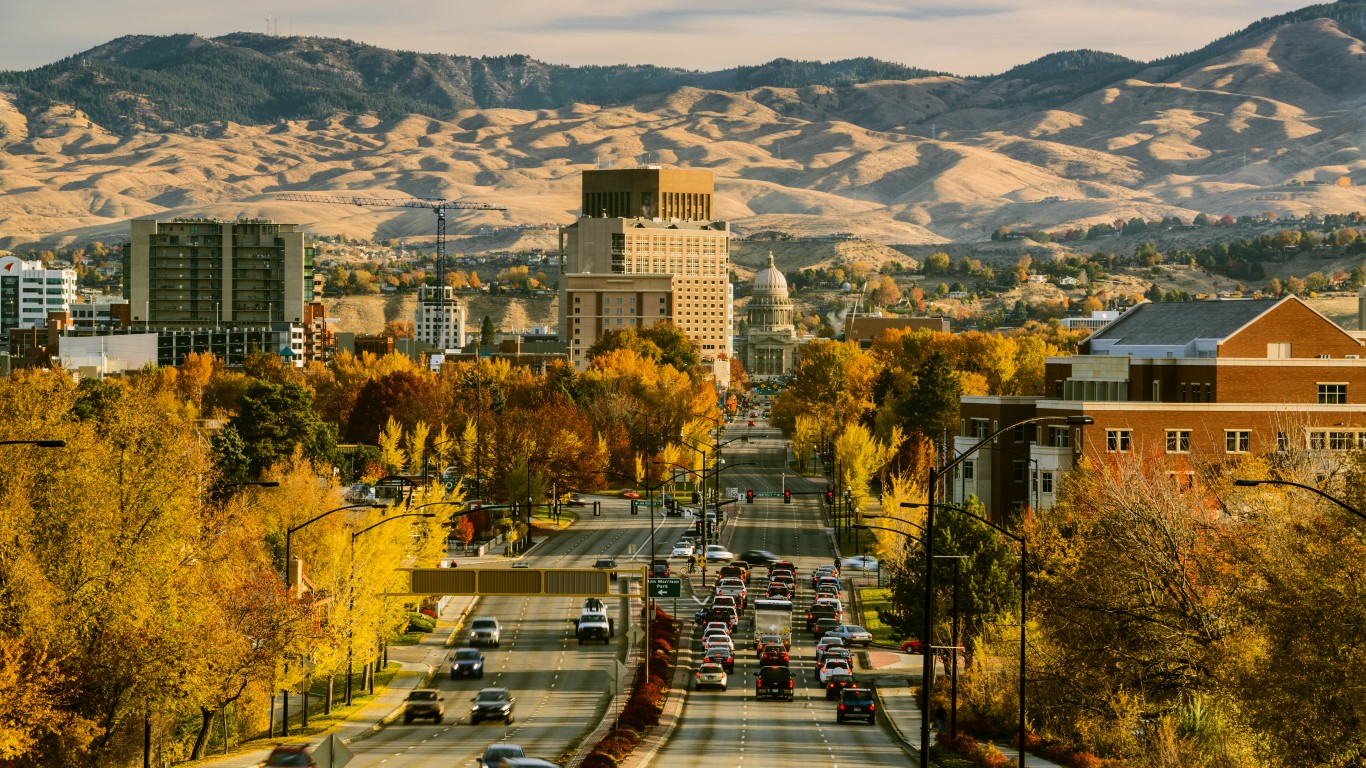
40. Idaho
> People from Pennsylvania who moved to Idaho in 2019: 653 (0.25% of all outbound Pennsylvanians)
> 1-year net change in population: 32,857 (1.84% – the highest)
> Total population: 1,787,065 (13th lowest)
[in-text-ad]

39. Louisiana
> People from Pennsylvania who moved to Louisiana in 2019: 710 (0.28% of all outbound Pennsylvanians)
> 1-year net change in population: -11,184 (-0.24% – 9th lowest)
> Total population: 4,648,794 (24th highest)

38. New Mexico
> People from Pennsylvania who moved to New Mexico in 2019: 791 (0.31% of all outbound Pennsylvanians)
> 1-year net change in population: 1,401 (0.07% – 19th lowest)
> Total population: 2,096,829 (16th lowest)

37. Oklahoma
> People from Pennsylvania who moved to Oklahoma in 2019: 881 (0.34% of all outbound Pennsylvanians)
> 1-year net change in population: 13,892 (0.35% – 20th highest)
> Total population: 3,956,971 (24th lowest)
[in-text-ad-2]

36. Mississippi
> People from Pennsylvania who moved to Mississippi in 2019: 917 (0.36% of all outbound Pennsylvanians)
> 1-year net change in population: -10,381 (-0.35% – 6th lowest)
> Total population: 2,976,149 (18th lowest)

35. Wisconsin
> People from Pennsylvania who moved to Wisconsin in 2019: 990 (0.39% of all outbound Pennsylvanians)
> 1-year net change in population: 8,866 (0.15% – 21st lowest)
> Total population: 5,822,434 (19th highest)
[in-text-ad]

34. Maine
> People from Pennsylvania who moved to Maine in 2019: 1,249 (0.49% of all outbound Pennsylvanians)
> 1-year net change in population: 5,808 (0.43% – 19th highest)
> Total population: 1,344,212 (10th lowest)

33. New Hampshire
> People from Pennsylvania who moved to New Hampshire in 2019: 1,306 (0.51% of all outbound Pennsylvanians)
> 1-year net change in population: 3,253 (0.24% – 25th highest)
> Total population: 1,359,711 (11th lowest)
32. Missouri
> People from Pennsylvania who moved to Missouri in 2019: 1,320 (0.51% of all outbound Pennsylvanians)
> 1-year net change in population: 10,976 (0.18% – 23rd lowest)
> Total population: 6,137,428 (17th highest)
[in-text-ad-2]

31. Minnesota
> People from Pennsylvania who moved to Minnesota in 2019: 1,349 (0.53% of all outbound Pennsylvanians)
> 1-year net change in population: 28,453 (0.50% – 18th highest)
> Total population: 5,639,632 (21st highest)

30. Vermont
> People from Pennsylvania who moved to Vermont in 2019: 1,401 (0.55% of all outbound Pennsylvanians)
> 1-year net change in population: -2,310 (-0.37% – 5th lowest)
> Total population: 623,989 (2nd lowest)
[in-text-ad]

29. Rhode Island
> People from Pennsylvania who moved to Rhode Island in 2019: 1,538 (0.60% of all outbound Pennsylvanians)
> 1-year net change in population: 2,046 (0.19% – 24th lowest)
> Total population: 1,059,361 (8th lowest)

28. Nevada
> People from Pennsylvania who moved to Nevada in 2019: 1,582 (0.62% of all outbound Pennsylvanians)
> 1-year net change in population: 45,764 (1.49% – 2nd highest)
> Total population: 3,080,156 (20th lowest)

27. Oregon
> People from Pennsylvania who moved to Oregon in 2019: 1,678 (0.65% of all outbound Pennsylvanians)
> 1-year net change in population: 27,024 (0.64% – 15th highest)
> Total population: 4,217,737 (25th lowest)
[in-text-ad-2]

26. District of Columbia
> People from Pennsylvania who moved to District of Columbia in 2019: 1,718 (0.67% of all outbound Pennsylvanians)
> 1-year net change in population: 8,185 (1.18% – 6th highest)
> Total population: 692,683 (3rd lowest)

25. Tennessee
> People from Pennsylvania who moved to Tennessee in 2019: 1,833 (0.71% of all outbound Pennsylvanians)
> 1-year net change in population: 59,164 (0.87% – 12th highest)
> Total population: 6,829,174 (15th highest)
[in-text-ad]

24. Kansas
> People from Pennsylvania who moved to Kansas in 2019: 2,189 (0.85% of all outbound Pennsylvanians)
> 1-year net change in population: 1,804 (0.06% – 18th lowest)
> Total population: 2,913,314 (17th lowest)

23. Alabama
> People from Pennsylvania who moved to Alabama in 2019: 2,336 (0.91% of all outbound Pennsylvanians)
> 1-year net change in population: 15,314 (0.31% – 21st highest)
> Total population: 4,903,185 (23rd highest)

22. Kentucky
> People from Pennsylvania who moved to Kentucky in 2019: 3,235 (1.26% of all outbound Pennsylvanians)
> 1-year net change in population: -729 (-0.02% – 15th lowest)
> Total population: 4,467,673 (25th highest)
[in-text-ad-2]

21. Colorado
> People from Pennsylvania who moved to Colorado in 2019: 3,362 (1.31% of all outbound Pennsylvanians)
> 1-year net change in population: 63,172 (1.10% – 7th highest)
> Total population: 5,758,736 (20th highest)

20. Connecticut
> People from Pennsylvania who moved to Connecticut in 2019: 3,711 (1.44% of all outbound Pennsylvanians)
> 1-year net change in population: -7,378 (-0.21% – 10th lowest)
> Total population: 3,565,287 (23rd lowest)
[in-text-ad]

19. Illinois
> People from Pennsylvania who moved to Illinois in 2019: 4,591 (1.79% of all outbound Pennsylvanians)
> 1-year net change in population: -69,259 (-0.55% – 3rd lowest)
> Total population: 12,671,821 (5th highest)

18. Washington
> People from Pennsylvania who moved to Washington in 2019: 4,833 (1.88% of all outbound Pennsylvanians)
> 1-year net change in population: 79,302 (1.04% – 8th highest)
> Total population: 7,614,893 (12th highest)

17. Arizona
> People from Pennsylvania who moved to Arizona in 2019: 4,906 (1.91% of all outbound Pennsylvanians)
> 1-year net change in population: 107,071 (1.47% – 3rd highest)
> Total population: 7,278,717 (13th highest)
[in-text-ad-2]

16. Michigan
> People from Pennsylvania who moved to Michigan in 2019: 5,074 (1.98% of all outbound Pennsylvanians)
> 1-year net change in population: -9,058 (-0.09% – 13th lowest)
> Total population: 9,986,857 (9th highest)

15. Indiana
> People from Pennsylvania who moved to Indiana in 2019: 5,331 (2.08% of all outbound Pennsylvanians)
> 1-year net change in population: 40,341 (0.60% – 17th highest)
> Total population: 6,732,219 (16th highest)
[in-text-ad]

14. West Virginia
> People from Pennsylvania who moved to West Virginia in 2019: 5,706 (2.22% of all outbound Pennsylvanians)
> 1-year net change in population: -13,685 (-0.76% – 2nd lowest)
> Total population: 1,792,147 (14th lowest)

13. Massachusetts
> People from Pennsylvania who moved to Massachusetts in 2019: 6,043 (2.35% of all outbound Pennsylvanians)
> 1-year net change in population: -9,646 (-0.14% – 11th lowest)
> Total population: 6,892,503 (14th highest)

12. South Carolina
> People from Pennsylvania who moved to South Carolina in 2019: 7,227 (2.81% of all outbound Pennsylvanians)
> 1-year net change in population: 64,587 (1.25% – 5th highest)
> Total population: 5,148,714 (22nd highest)
[in-text-ad-2]

11. Georgia
> People from Pennsylvania who moved to Georgia in 2019: 7,726 (3.01% of all outbound Pennsylvanians)
> 1-year net change in population: 97,948 (0.92% – 11th highest)
> Total population: 10,617,423 (7th highest)

10. Delaware
> People from Pennsylvania who moved to Delaware in 2019: 8,902 (3.47% of all outbound Pennsylvanians)
> 1-year net change in population: 6,593 (0.68% – 14th highest)
> Total population: 973,764 (7th lowest)
[in-text-ad]

9. Texas
> People from Pennsylvania who moved to Texas in 2019: 9,352 (3.64% of all outbound Pennsylvanians)
> 1-year net change in population: 294,036 (1.01% – 9th highest)
> Total population: 28,995,881 (2nd highest)

8. Virginia
> People from Pennsylvania who moved to Virginia in 2019: 12,284 (4.78% of all outbound Pennsylvanians)
> 1-year net change in population: 17,834 (0.21% – 25th lowest)
> Total population: 8,535,519 (11th highest)

7. California
> People from Pennsylvania who moved to California in 2019: 12,578 (4.90% of all outbound Pennsylvanians)
> 1-year net change in population: -44,822 (-0.11% – 12th lowest)
> Total population: 39,512,223 (the highest)
[in-text-ad-2]

6. North Carolina
> People from Pennsylvania who moved to North Carolina in 2019: 13,341 (5.19% of all outbound Pennsylvanians)
> 1-year net change in population: 104,464 (1.00% – 10th highest)
> Total population: 10,488,084 (8th highest)

5. Maryland
> People from Pennsylvania who moved to Maryland in 2019: 14,376 (5.60% of all outbound Pennsylvanians)
> 1-year net change in population: 2,962 (0.05% – 17th lowest)
> Total population: 6,045,680 (18th highest)
[in-text-ad]

4. Ohio
> People from Pennsylvania who moved to Ohio in 2019: 16,792 (6.54% of all outbound Pennsylvanians)
> 1-year net change in population: -342 (0.00% – 16th lowest)
> Total population: 11,689,100 (6th highest)

3. New Jersey
> People from Pennsylvania who moved to New Jersey in 2019: 22,445 (8.74% of all outbound Pennsylvanians)
> 1-year net change in population: -26,330 (-0.30% – 8th lowest)
> Total population: 8,882,190 (10th highest)

2. New York
> People from Pennsylvania who moved to New York in 2019: 22,641 (8.81% of all outbound Pennsylvanians)
> 1-year net change in population: -88,648 (-0.46% – 4th lowest)
> Total population: 19,453,561 (4th highest)
[in-text-ad-2]

1. Florida
> People from Pennsylvania who moved to Florida in 2019: 34,965 (13.61% of all outbound Pennsylvanians)
> 1-year net change in population: 178,412 (0.83% – 13th highest)
> Total population: 21,477,737 (3rd highest)
It’s Your Money, Your Future—Own It (sponsor)
Are you ahead, or behind on retirement? For families with more than $500,000 saved for retirement, finding a financial advisor who puts your interest first can be the difference, and today it’s easier than ever. SmartAsset’s free tool matches you with up to three fiduciary financial advisors who serve your area in minutes. Each advisor has been carefully vetted and must act in your best interests. Start your search now.
If you’ve saved and built a substantial nest egg for you and your family, don’t delay; get started right here and help your retirement dreams become a retirement reality.
Thank you for reading! Have some feedback for us?
Contact the 24/7 Wall St. editorial team.
 24/7 Wall St.
 24/7 Wall St.
 24/7 Wall St.
 24/7 Wall St.

