
In July the Office of the Director of National Intelligence delivered an unclassified report to Congress titled “Preliminary Assessment: Unidentified Aerial Phenomena.” That’s UFOs, or unidentified flying objects, to you and me. It was based on a review of 144 reported sightings made by military aviators between 2004 and 2021, mostly in the last two years. Of the 144, an explanation was found for only one — a deflated balloon. The rest remain unexplained. (These are the most important events in NASA’s history.)
Meanwhile, reported sightings by civilians vastly outnumber those by military personnel and have been increasing. There is even a National UFO Reporting Center, which documents sightings of unexplained aerial phenomena all over the world. There were 6,281 reported sightings in 2019 and a whopping 7,267 in 2020.
The increase in recent sightings may have something to do with renewed interest in UFOs related to the government report. Often there’s a ready explanation for sightings, including ordinary aircraft, celestial objects such as bright stars and planets, weather phenomena, drones, and satellites. But sometimes there isn’t.
To identify the states with the most UFO sightings 24/7 Wall St. reviewed data provided by Cheryl Costa and Linda Miller, authors of “UFO Sightings Desk Reference: United States of America 2001-2020P.” Interestingly, the list is headed by three states in the Northeast: Vermont, with 109 sightings per 100,000 residents; Maine, with 103.1; and New Hampshire, with 101. That could be because aliens appreciate the beauty of New England. It might also have something to do with the fact that visibility is better in rural states with less light pollution and higher elevations.
For whatever reason, the states with the fewest sightings are in the South: Mississippi, with 29.9 sightings per 100,000 residents; Louisiana, with 30; and Texas, with 32.4. (This is exactly what it takes to become an astronaut.)
Click here to see the states with the most UFO sightings

50. Mississippi
> 2001-2020 sightings per 100K: 29.9
> Total sightings: 891
> Population 2019: 2,976,149
> Population per sq. mile: 64.3
[in-text-ad]

49. Louisiana
> 2001-2020 sightings per 100K: 30.0
> Total sightings: 1,396
> Population 2019: 4,648,794
> Population per sq. mile: 106.3

48. Texas
> 2001-2020 sightings per 100K: 32.4
> Total sightings: 9,408
> Population 2019: 28,995,881
> Population per sq. mile: 103.2

47. Georgia
> 2001-2020 sightings per 100K: 33.5
> Total sightings: 3,560
> Population 2019: 10,617,423
> Population per sq. mile: 178.6
[in-text-ad-2]

46. Alabama
> 2001-2020 sightings per 100K: 34.5
> Total sightings: 1,692
> Population 2019: 4,903,185
> Population per sq. mile: 97.0

45. New York
> 2001-2020 sightings per 100K: 36.6
> Total sightings: 7,124
> Population 2019: 19,453,561
> Population per sq. mile: 415.3
[in-text-ad]

44. Maryland
> 2001-2020 sightings per 100K: 37.6
> Total sightings: 2,274
> Population 2019: 6,045,680
> Population per sq. mile: 615.0

43. Virginia
> 2001-2020 sightings per 100K: 38.5
> Total sightings: 3,288
> Population 2019: 8,535,519
> Population per sq. mile: 212.1

42. New Jersey
> 2001-2020 sightings per 100K: 41.2
> Total sightings: 3,660
> Population 2019: 8,882,190
> Population per sq. mile: 1214.7
[in-text-ad-2]

41. Illinois
> 2001-2020 sightings per 100K: 42.8
> Total sightings: 5,429
> Population 2019: 12,671,821
> Population per sq. mile: 234.0

40. North Dakota
> 2001-2020 sightings per 100K: 44.0
> Total sightings: 335
> Population 2019: 762,062
> Population per sq. mile: 10.0
[in-text-ad]

39. North Carolina
> 2001-2020 sightings per 100K: 44.1
> Total sightings: 4,622
> Population 2019: 10,488,084
> Population per sq. mile: 208.1

38. Massachusetts
> 2001-2020 sightings per 100K: 44.1
> Total sightings: 3,040
> Population 2019: 6,892,503
> Population per sq. mile: 851.1
37. Tennessee
> 2001-2020 sightings per 100K: 44.2
> Total sightings: 3,017
> Population 2019: 6,829,174
> Population per sq. mile: 160.3
[in-text-ad-2]

36. Nebraska
> 2001-2020 sightings per 100K: 46.0
> Total sightings: 889
> Population 2019: 1,934,408
> Population per sq. mile: 24.4

35. Minnesota
> 2001-2020 sightings per 100K: 46.9
> Total sightings: 2,646
> Population 2019: 5,639,632
> Population per sq. mile: 68.5
[in-text-ad]
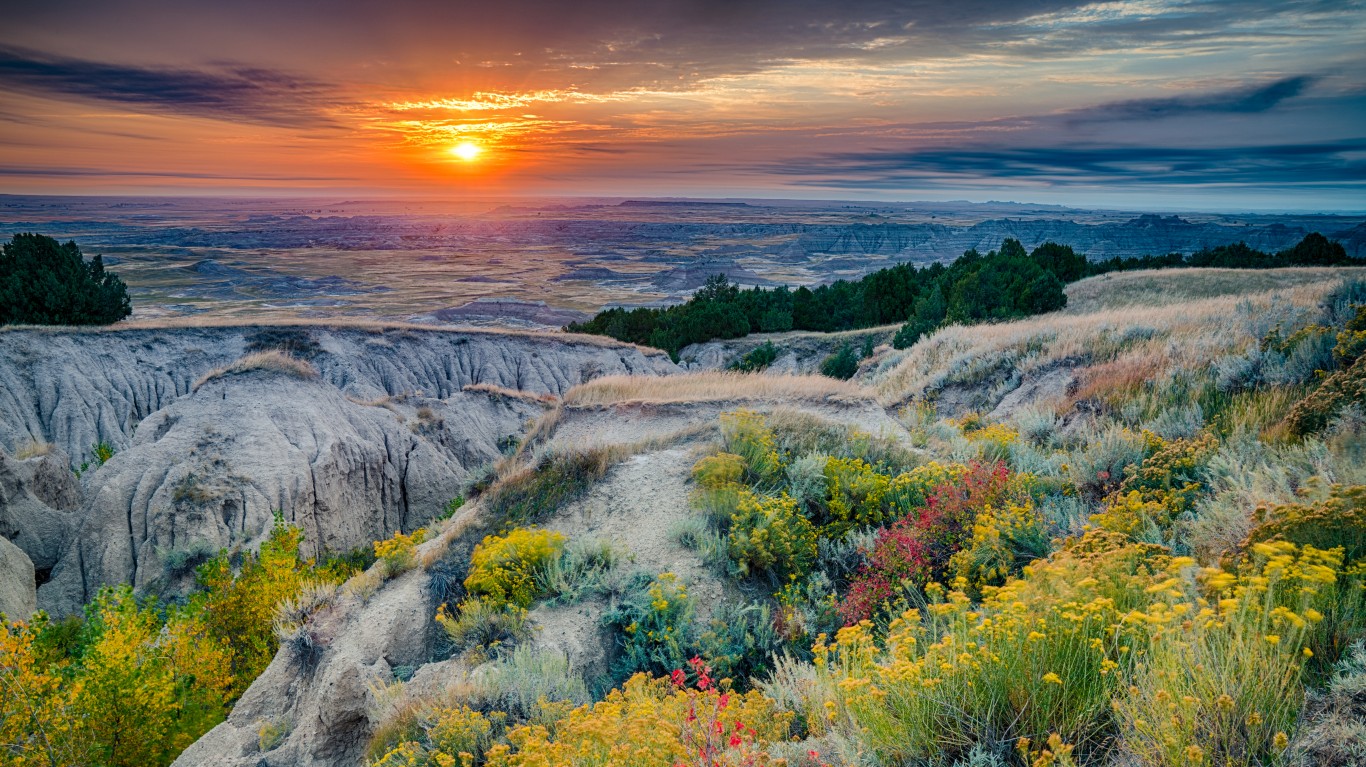
34. South Dakota
> 2001-2020 sightings per 100K: 47.2
> Total sightings: 418
> Population 2019: 884,659
> Population per sq. mile: 11.1

33. Delaware
> 2001-2020 sightings per 100K: 48.0
> Total sightings: 467
> Population 2019: 973,764
> Population per sq. mile: 483.3

32. Arkansas
> 2001-2020 sightings per 100K: 48.6
> Total sightings: 1,468
> Population 2019: 3,017,804
> Population per sq. mile: 57.9
[in-text-ad-2]
31. Ohio
> 2001-2020 sightings per 100K: 48.7
> Total sightings: 5,694
> Population 2019: 11,689,100
> Population per sq. mile: 283.9
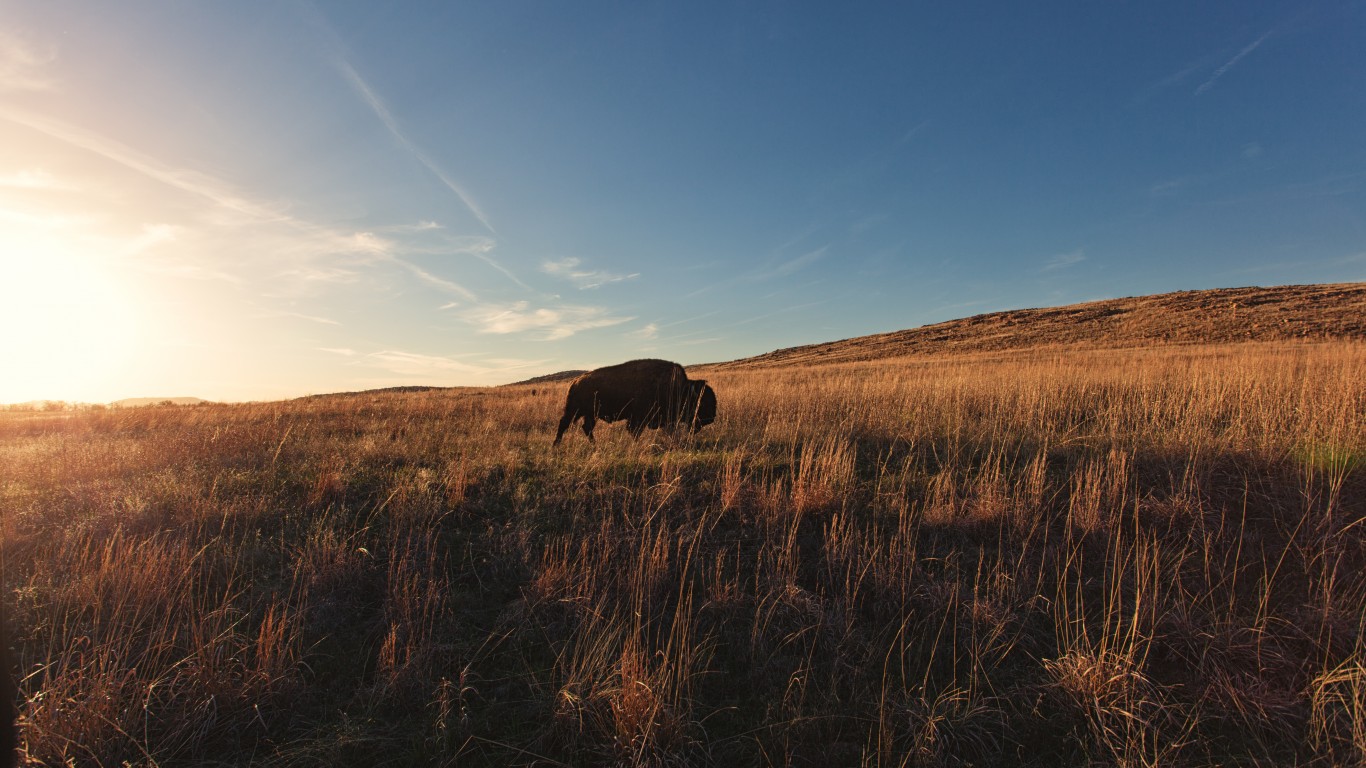
30. Oklahoma
> 2001-2020 sightings per 100K: 49.0
> Total sightings: 1,940
> Population 2019: 3,956,971
> Population per sq. mile: 56.6
[in-text-ad]

29. Wisconsin
> 2001-2020 sightings per 100K: 49.3
> Total sightings: 2,868
> Population 2019: 5,822,434
> Population per sq. mile: 107.3

28. Kentucky
> 2001-2020 sightings per 100K: 49.3
> Total sightings: 2,202
> Population 2019: 4,467,673
> Population per sq. mile: 113.0

27. Iowa
> 2001-2020 sightings per 100K: 49.6
> Total sightings: 1,564
> Population 2019: 3,155,070
> Population per sq. mile: 55.5
[in-text-ad-2]

26. South Carolina
> 2001-2020 sightings per 100K: 51.4
> Total sightings: 2,645
> Population 2019: 5,148,714
> Population per sq. mile: 162.0
25. Florida
> 2001-2020 sightings per 100K: 51.4
> Total sightings: 11,042
> Population 2019: 21,477,737
> Population per sq. mile: 371.0
[in-text-ad]
24. Kansas
> 2001-2020 sightings per 100K: 51.4
> Total sightings: 1,498
> Population 2019: 2,913,314
> Population per sq. mile: 35.8

23. California
> 2001-2020 sightings per 100K: 53.2
> Total sightings: 21,013
> Population 2019: 39,512,223
> Population per sq. mile: 248.2

22. Hawaii
> 2001-2020 sightings per 100K: 54.1
> Total sightings: 766
> Population 2019: 1,415,872
> Population per sq. mile: 221.2
[in-text-ad-2]

21. Pennsylvania
> 2001-2020 sightings per 100K: 55.0
> Total sightings: 7,043
> Population 2019: 12,801,989
> Population per sq. mile: 287.8

20. Michigan
> 2001-2020 sightings per 100K: 55.5
> Total sightings: 5,541
> Population 2019: 9,986,857
> Population per sq. mile: 174.1
[in-text-ad]

19. Utah
> 2001-2020 sightings per 100K: 56.4
> Total sightings: 1,807
> Population 2019: 3,205,958
> Population per sq. mile: 36.3

18. Indiana
> 2001-2020 sightings per 100K: 58.1
> Total sightings: 3,913
> Population 2019: 6,732,219
> Population per sq. mile: 185.4

17. Connecticut
> 2001-2020 sightings per 100K: 61.4
> Total sightings: 2,190
> Population 2019: 3,565,287
> Population per sq. mile: 749.9
[in-text-ad-2]

16. West Virginia
> 2001-2020 sightings per 100K: 62.8
> Total sightings: 1,126
> Population 2019: 1,792,147
> Population per sq. mile: 77.9

15. Missouri
> 2001-2020 sightings per 100K: 65.6
> Total sightings: 4,027
> Population 2019: 6,137,428
> Population per sq. mile: 89.3
[in-text-ad]

14. Rhode Island
> 2001-2020 sightings per 100K: 67.7
> Total sightings: 717
> Population 2019: 1,059,361
> Population per sq. mile: 1015.9

13. Nevada
> 2001-2020 sightings per 100K: 74.0
> Total sightings: 2,280
> Population 2019: 3,080,156
> Population per sq. mile: 26.8

12. Colorado
> 2001-2020 sightings per 100K: 80.8
> Total sightings: 4,654
> Population 2019: 5,758,736
> Population per sq. mile: 51.4
[in-text-ad-2]
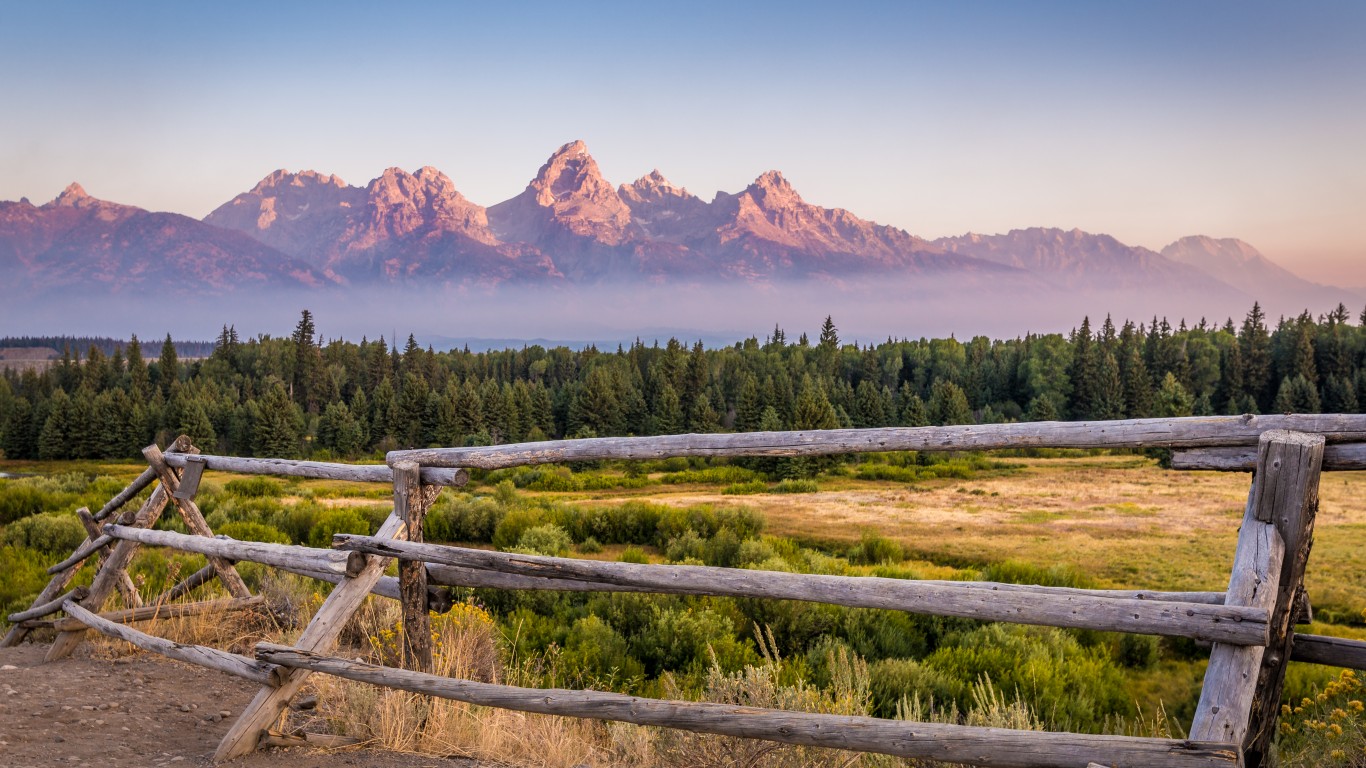
11. Wyoming
> 2001-2020 sightings per 100K: 84.7
> Total sightings: 490
> Population 2019: 578,759
> Population per sq. mile: 6.1

10. Idaho
> 2001-2020 sightings per 100K: 87.8
> Total sightings: 1,569
> Population 2019: 1,787,065
> Population per sq. mile: 20.2
[in-text-ad]

9. Arizona
> 2001-2020 sightings per 100K: 90.4
> Total sightings: 6,583
> Population 2019: 7,278,717
> Population per sq. mile: 60.4
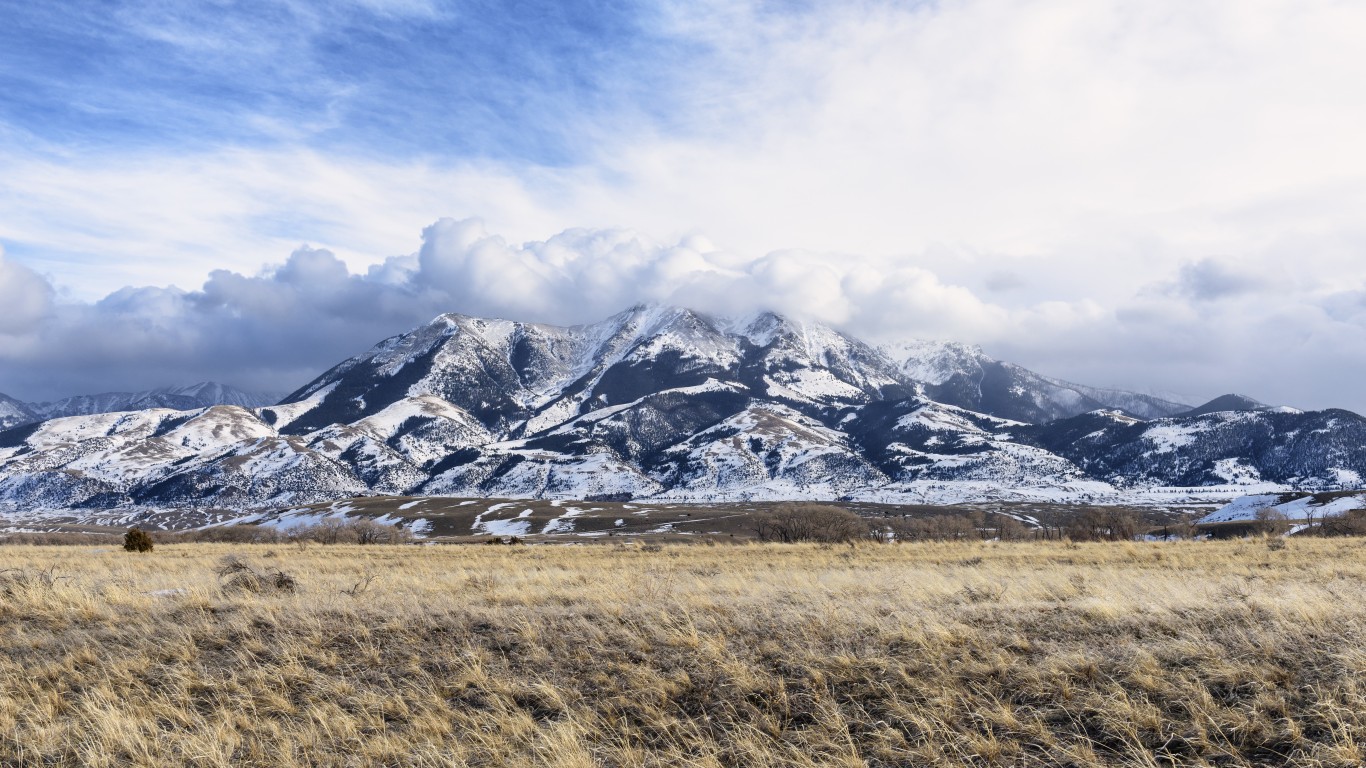
8. Montana
> 2001-2020 sightings per 100K: 93.1
> Total sightings: 995
> Population 2019: 1,068,778
> Population per sq. mile: 7.0

7. Alaska
> 2001-2020 sightings per 100K: 93.2
> Total sightings: 682
> Population 2019: 731,545
> Population per sq. mile: 1.3
[in-text-ad-2]

6. Washington
> 2001-2020 sightings per 100K: 94.0
> Total sightings: 7,159
> Population 2019: 7,614,893
> Population per sq. mile: 106.5

5. Oregon
> 2001-2020 sightings per 100K: 100.5
> Total sightings: 4,240
> Population 2019: 4,217,737
> Population per sq. mile: 41.6
[in-text-ad]
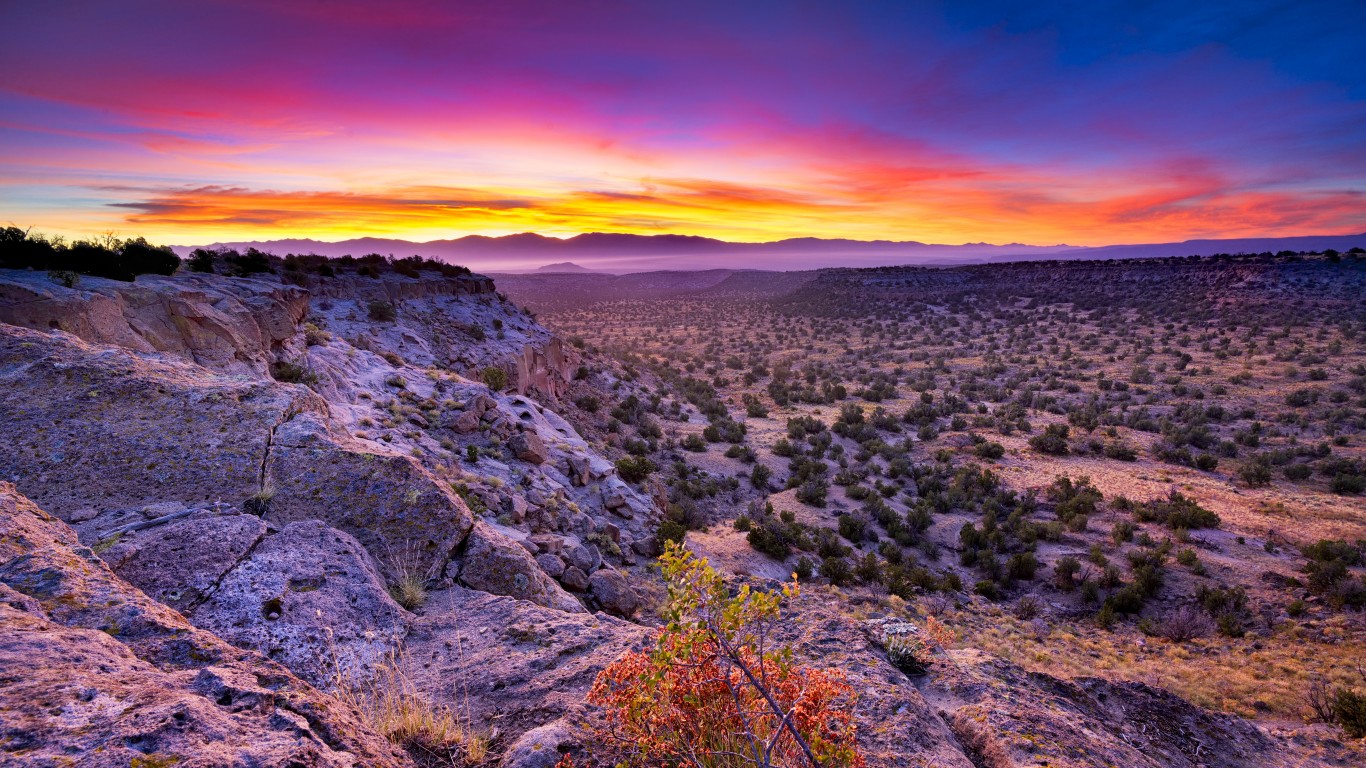
4. New Mexico
> 2001-2020 sightings per 100K: 100.7
> Total sightings: 2,112
> Population 2019: 2,096,829
> Population per sq. mile: 17.8

3. New Hampshire
> 2001-2020 sightings per 100K: 101.0
> Total sightings: 1,373
> Population 2019: 1,359,711
> Population per sq. mile: 149.8

2. Maine
> 2001-2020 sightings per 100K: 103.1
> Total sightings: 1,386
> Population 2019: 1,344,212
> Population per sq. mile: 43.6
[in-text-ad-2]

1. Vermont
> 2001-2020 sightings per 100K: 109.0
> Total sightings: 680
> Population 2019: 623,989
> Population per sq. mile: 68.5
Are You Still Paying With a Debit Card?
The average American spends $17,274 on debit cards a year, and it’s a HUGE mistake. First, debit cards don’t have the same fraud protections as credit cards. Once your money is gone, it’s gone. But more importantly you can actually get something back from this spending every time you swipe.
Issuers are handing out wild bonuses right now. With some you can earn up to 5% back on every purchase. That’s like getting a 5% discount on everything you buy!
Our top pick is kind of hard to imagine. Not only does it pay up to 5% back, it also includes a $200 cash back reward in the first six months, a 0% intro APR, and…. $0 annual fee. It’s quite literally free money for any one that uses a card regularly. Click here to learn more!
Flywheel Publishing has partnered with CardRatings to provide coverage of credit card products. Flywheel Publishing and CardRatings may receive a commission from card issuers.
Thank you for reading! Have some feedback for us?
Contact the 24/7 Wall St. editorial team.
 24/7 Wall St.

 24/7 Wall St.
