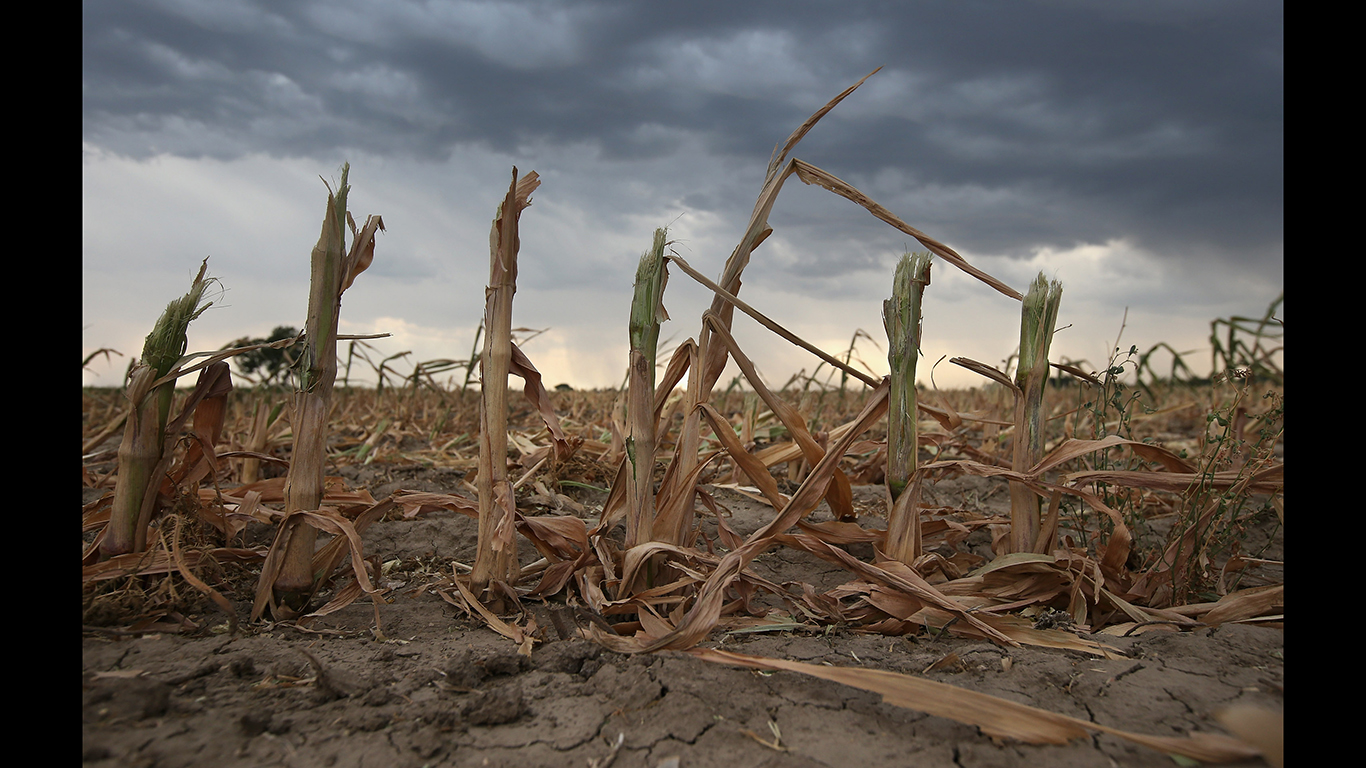
Drought levels across most of the southwest and California are at the worst level in decades. In some cases, the problem is the worst it has been in a century. There is no sign it will let up in the foreseeable future, leaving tens of thousands of square miles unable to support crops and livestock and scores of cities without enough water to support their populations.
One state, Utah, is worse off than the rest although states adjacent to it have problems nearly as severe.
The gold standard for measuring drought conditions is the U.S. Drought Monitor, which is a joint venture among the National Drought Mitigation Center at the University of Nebraska-Lincoln, the United States Department of Agriculture, and the National Oceanic and Atmospheric Administration.
The monitor ranks drought severity in states by combining five categories of drought D0 to D4, with D4 as the worst level. To identify the states hit hardest by drought, we compared every state’s Drought Severity and Coverage Index (DSCI).
For reference, the year-to-date average DSCI for the continental United States is about 169. The DSCI value for the latest week of data, starting June 8, is 170. The average DSCI value for the continental U.S. has not fallen below 164 during any week of 2021. At around this time last year, the week of June 16, 2020, the DSCI value was lower by nearly half, at 79. Only six states are completely drought-free. The value for Utah is 452.
D0 is described as places where “dryland crops are struggling” and “water for cattle is limited.” D1 drought levels are where “soil moisture is low and winter wheat germination is poor.” D2 is described as where “pasture and water is inadequate for cattle” and “streams and ponds are dry.” D3 is described as places where “fire danger increases” and “native vegetation is stressed.” And D4 is the designation for places where “fire restrictions increase” and “irrigation water allotments are cut.” D4 areas are also labeled places with “exceptional drought.”
A recent New York Times article that examined the issue attributes much of the trouble to climate change. “But at the root of the drought are warmer temperatures and changing precipitation patterns, which are linked to emissions of carbon dioxide and other greenhouse gases into the atmosphere, where they trap the sun’s heat.”
Click here to see the state hardest hit by drought

Rhode Island
> Drought Severity and Coverage Index week of June 8, 2021: 0
> Average DSCI over past 12 months: 125.4 — 16th highest
> Worst week of drought: 399, Oct 6, 2020
> Longest single stretch of severe drought, since last summer: 17 weeks
[in-text-ad]

Alabama
> Drought Severity and Coverage Index week of June 8, 2021: 0
> Average DSCI over past 12 months: 12.9 — 8th lowest
> Worst week of drought: 50, March 16, 2021
> Longest single stretch of severe drought, since last summer: 0 weeks
 24/7 Wall St.
Arkansas
> Drought Severity and Coverage Index week of June 8, 2021: 0
> Average DSCI over past 12 months: 13.1 — 9th lowest
> Worst week of drought: 90, Dec 29, 2020
> Longest single stretch of severe drought, since last summer: 0 weeks
Louisiana
> Drought Severity and Coverage Index week of June 8, 2021: 0
> Average DSCI over past 12 months: 16.3 — 11th lowest
> Worst week of drought: 70, Feb 9, 2021
> Longest single stretch of severe drought, since last summer: 0 weeks
[in-text-ad-2]

Mississippi
> Drought Severity and Coverage Index week of June 8, 2021: 0
> Average DSCI over past 12 months: 17.6 — 15th lowest
> Worst week of drought: 59, Feb 9, 2021
> Longest single stretch of severe drought, since last summer: 0 weeks

Connecticut
> Drought Severity and Coverage Index week of June 8, 2021: 0
> Average DSCI over past 12 months: 78.7 — 25th highest
> Worst week of drought: 265, Oct 6, 2020
> Longest single stretch of severe drought, since last summer: 11 weeks
[in-text-ad]

Delaware
> Drought Severity and Coverage Index week of June 8, 2021: 2
> Average DSCI over past 12 months: 3.8 — the lowest
> Worst week of drought: 95, May 25, 2021
> Longest single stretch of severe drought, since last summer: 0 weeks
 24/7 Wall St.
Kansas
> Drought Severity and Coverage Index week of June 8, 2021: 3
> Average DSCI over past 12 months: 99.3 — 20th highest
> Worst week of drought: 192, Nov 24, 2020
> Longest single stretch of severe drought, since last summer: 10 weeks

Massachusetts
> Drought Severity and Coverage Index week of June 8, 2021: 7
> Average DSCI over past 12 months: 105.5 — 19th highest
> Worst week of drought: 309, Oct 6, 2020
> Longest single stretch of severe drought, since last summer: 18 weeks
[in-text-ad-2]

Missouri
> Drought Severity and Coverage Index week of June 8, 2021: 10
> Average DSCI over past 12 months: 24.6 — 17th lowest
> Worst week of drought: 82, Oct 20, 2020
> Longest single stretch of severe drought, since last summer: 0 weeks

Maryland
> Drought Severity and Coverage Index week of June 8, 2021: 12
> Average DSCI over past 12 months: 8.1 — 4th lowest
> Worst week of drought: 58, May 25, 2021
> Longest single stretch of severe drought, since last summer: 0 weeks
[in-text-ad]

Georgia
> Drought Severity and Coverage Index week of June 8, 2021: 14
> Average DSCI over past 12 months: 15.4 — 10th lowest
> Worst week of drought: 58, Aug 4, 2020
> Longest single stretch of severe drought, since last summer: 0 weeks

Alaska
> Drought Severity and Coverage Index week of June 8, 2021: 14
> Average DSCI over past 12 months: 16.8 — 13th lowest
> Worst week of drought: 36, Sept 1, 2020
> Longest single stretch of severe drought, since last summer: 0 weeks

Tennessee
> Drought Severity and Coverage Index week of June 8, 2021: 16
> Average DSCI over past 12 months: 19.2 — 16th lowest
> Worst week of drought: 66, Jan 19, 2021
> Longest single stretch of severe drought, since last summer: 0 weeks
[in-text-ad-2]

Kentucky
> Drought Severity and Coverage Index week of June 8, 2021: 18
> Average DSCI over past 12 months: 5.8 — 3rd lowest
> Worst week of drought: 30, Jan 19, 2021
> Longest single stretch of severe drought, since last summer: 0 weeks

Pennsylvania
> Drought Severity and Coverage Index week of June 8, 2021: 19
> Average DSCI over past 12 months: 54.5 — 22nd lowest
> Worst week of drought: 147, Oct 27, 2020
> Longest single stretch of severe drought, since last summer: 0 weeks
[in-text-ad]

Ohio
> Drought Severity and Coverage Index week of June 8, 2021: 21
> Average DSCI over past 12 months: 34.4 — 18th lowest
> Worst week of drought: 122, July 28, 2020
> Longest single stretch of severe drought, since last summer: 0 weeks
 24/7 Wall St.
Indiana
> Drought Severity and Coverage Index week of June 8, 2021: 21
> Average DSCI over past 12 months: 57.7 — 23rd lowest
> Worst week of drought: 148, Oct 13, 2020
> Longest single stretch of severe drought, since last summer: 0 weeks
Oklahoma
> Drought Severity and Coverage Index week of June 8, 2021: 22
> Average DSCI over past 12 months: 72.8 — 24th lowest
> Worst week of drought: 143, July 7, 2020
> Longest single stretch of severe drought, since last summer: 0 weeks
[in-text-ad-2]

New Jersey
> Drought Severity and Coverage Index week of June 8, 2021: 25
> Average DSCI over past 12 months: 5.8 — 3rd lowest
> Worst week of drought: 100, May 25, 2021
> Longest single stretch of severe drought, since last summer: 0 weeks

Illinois
> Drought Severity and Coverage Index week of June 8, 2021: 34
> Average DSCI over past 12 months: 42.0 — 20th lowest
> Worst week of drought: 88, Sept 1, 2020
> Longest single stretch of severe drought, since last summer: 0 weeks
[in-text-ad]

Texas
> Drought Severity and Coverage Index week of June 8, 2021: 49
> Average DSCI over past 12 months: 166.1 — 10th highest
> Worst week of drought: 266, Dec 29, 2020
> Longest single stretch of severe drought, since last summer: 29 weeks
 24/7 Wall St.
New York
> Drought Severity and Coverage Index week of June 8, 2021: 52
> Average DSCI over past 12 months: 74.1 — 25th lowest
> Worst week of drought: 124, July 7, 2020
> Longest single stretch of severe drought, since last summer: 0 weeks
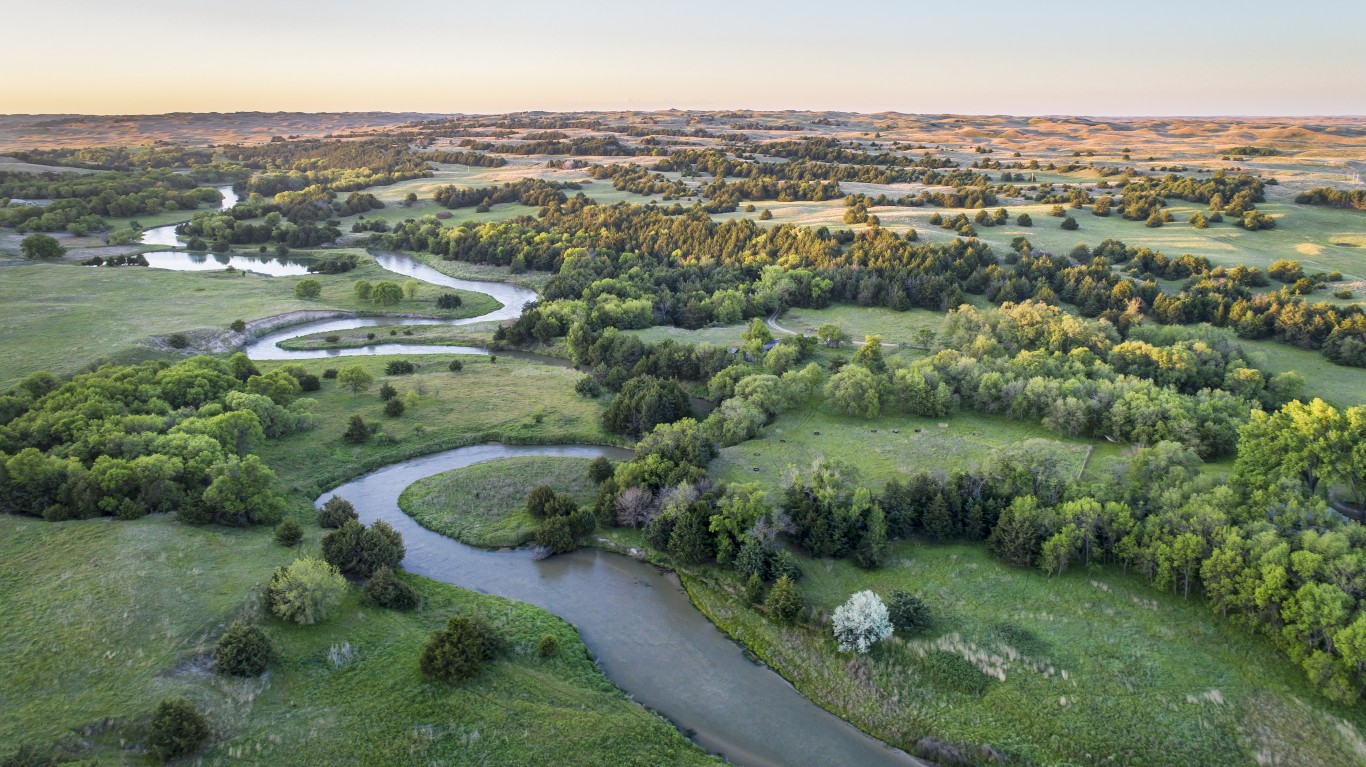
Nebraska
> Drought Severity and Coverage Index week of June 8, 2021: 55
> Average DSCI over past 12 months: 164.0 — 11th highest
> Worst week of drought: 275, Dec 15, 2020
> Longest single stretch of severe drought, since last summer: 27 weeks
[in-text-ad-2]

Florida
> Drought Severity and Coverage Index week of June 8, 2021: 62
> Average DSCI over past 12 months: 16.6 — 12th lowest
> Worst week of drought: 62, June 8, 2021
> Longest single stretch of severe drought, since last summer: 0 weeks

West Virginia
> Drought Severity and Coverage Index week of June 8, 2021: 69
> Average DSCI over past 12 months: 10.8 — 6th lowest
> Worst week of drought: 69, June 8, 2021
> Longest single stretch of severe drought, since last summer: 0 weeks
[in-text-ad]

South Carolina
> Drought Severity and Coverage Index week of June 8, 2021: 82
> Average DSCI over past 12 months: 16.8 — 14th lowest
> Worst week of drought: 128, June 1, 2021
> Longest single stretch of severe drought, since last summer: 0 weeks

Hawaii
> Drought Severity and Coverage Index week of June 8, 2021: 84
> Average DSCI over past 12 months: 85.6 — 23rd highest
> Worst week of drought: 205, Nov 10, 2020
> Longest single stretch of severe drought, since last summer: 6 weeks

Maine
> Drought Severity and Coverage Index week of June 8, 2021: 92
> Average DSCI over past 12 months: 108.8 — 18th highest
> Worst week of drought: 295, Oct 6, 2020
> Longest single stretch of severe drought, since last summer: 21 weeks
[in-text-ad-2]

North Carolina
> Drought Severity and Coverage Index week of June 8, 2021: 100
> Average DSCI over past 12 months: 12.5 — 7th lowest
> Worst week of drought: 144, June 1, 2021
> Longest single stretch of severe drought, since last summer: 0 weeks

Wisconsin
> Drought Severity and Coverage Index week of June 8, 2021: 121
> Average DSCI over past 12 months: 36.3 — 19th lowest
> Worst week of drought: 121, June 8, 2021
> Longest single stretch of severe drought, since last summer: 0 weeks
[in-text-ad]

Virginia
> Drought Severity and Coverage Index week of June 8, 2021: 124
> Average DSCI over past 12 months: 10.6 — 5th lowest
> Worst week of drought: 130, June 1, 2021
> Longest single stretch of severe drought, since last summer: 0 weeks

Vermont
> Drought Severity and Coverage Index week of June 8, 2021: 126
> Average DSCI over past 12 months: 141.1 — 14th highest
> Worst week of drought: 206, Sept 29, 2020
> Longest single stretch of severe drought, since last summer: 7 weeks

New Hampshire
> Drought Severity and Coverage Index week of June 8, 2021: 130
> Average DSCI over past 12 months: 145.4 — 13th highest
> Worst week of drought: 317, Oct 6, 2020
> Longest single stretch of severe drought, since last summer: 16 weeks
[in-text-ad-2]

Minnesota
> Drought Severity and Coverage Index week of June 8, 2021: 148
> Average DSCI over past 12 months: 81.7 — 24th highest
> Worst week of drought: 148, June 8, 2021
> Longest single stretch of severe drought, since last summer: 0 weeks

Iowa
> Drought Severity and Coverage Index week of June 8, 2021: 155
> Average DSCI over past 12 months: 113.2 — 17th highest
> Worst week of drought: 234, Sept 1, 2020
> Longest single stretch of severe drought, since last summer: 4 weeks
[in-text-ad]
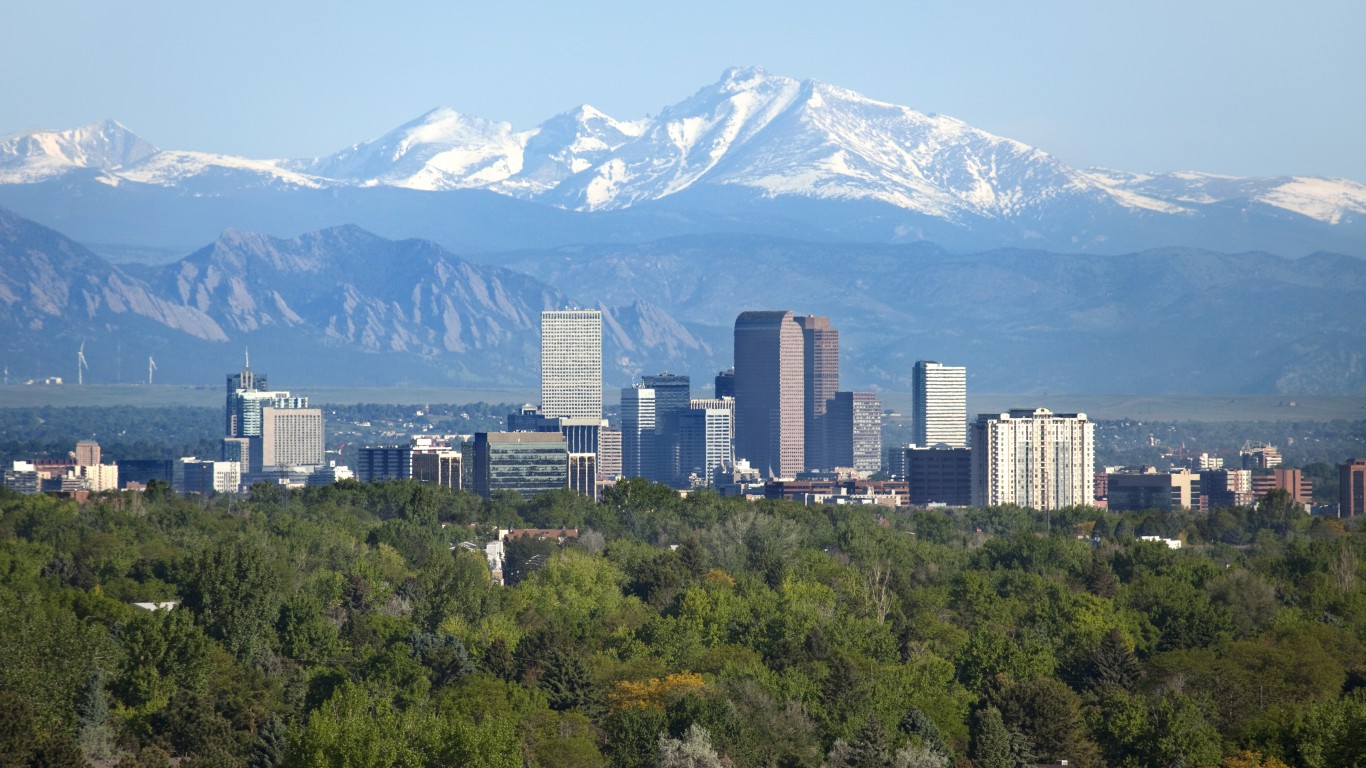
Colorado
> Drought Severity and Coverage Index week of June 8, 2021: 169
> Average DSCI over past 12 months: 324.9 — 5th highest
> Worst week of drought: 398, Dec 15, 2020
> Longest single stretch of severe drought, since last summer: 52 weeks
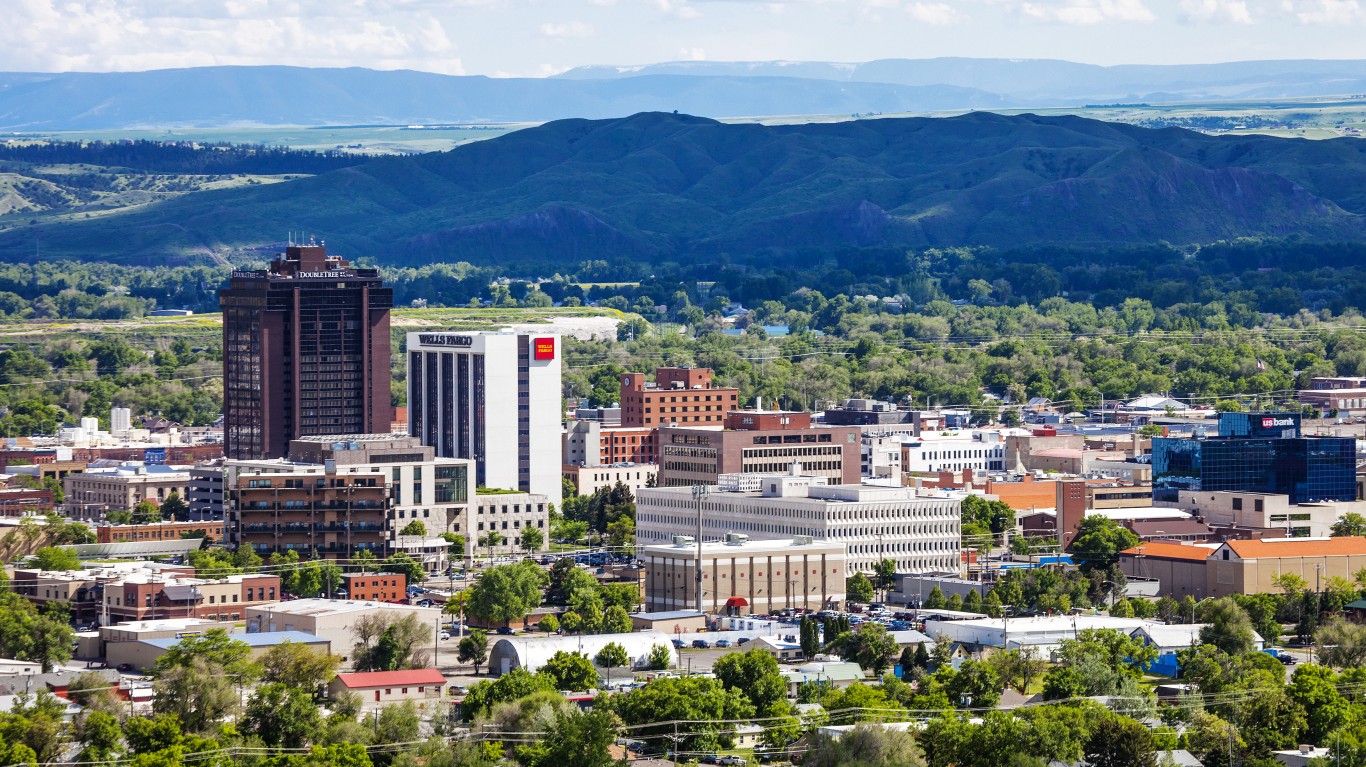
Montana
> Drought Severity and Coverage Index week of June 8, 2021: 188
> Average DSCI over past 12 months: 125.6 — 15th highest
> Worst week of drought: 204, May 11, 2021
> Longest single stretch of severe drought, since last summer: 10 weeks

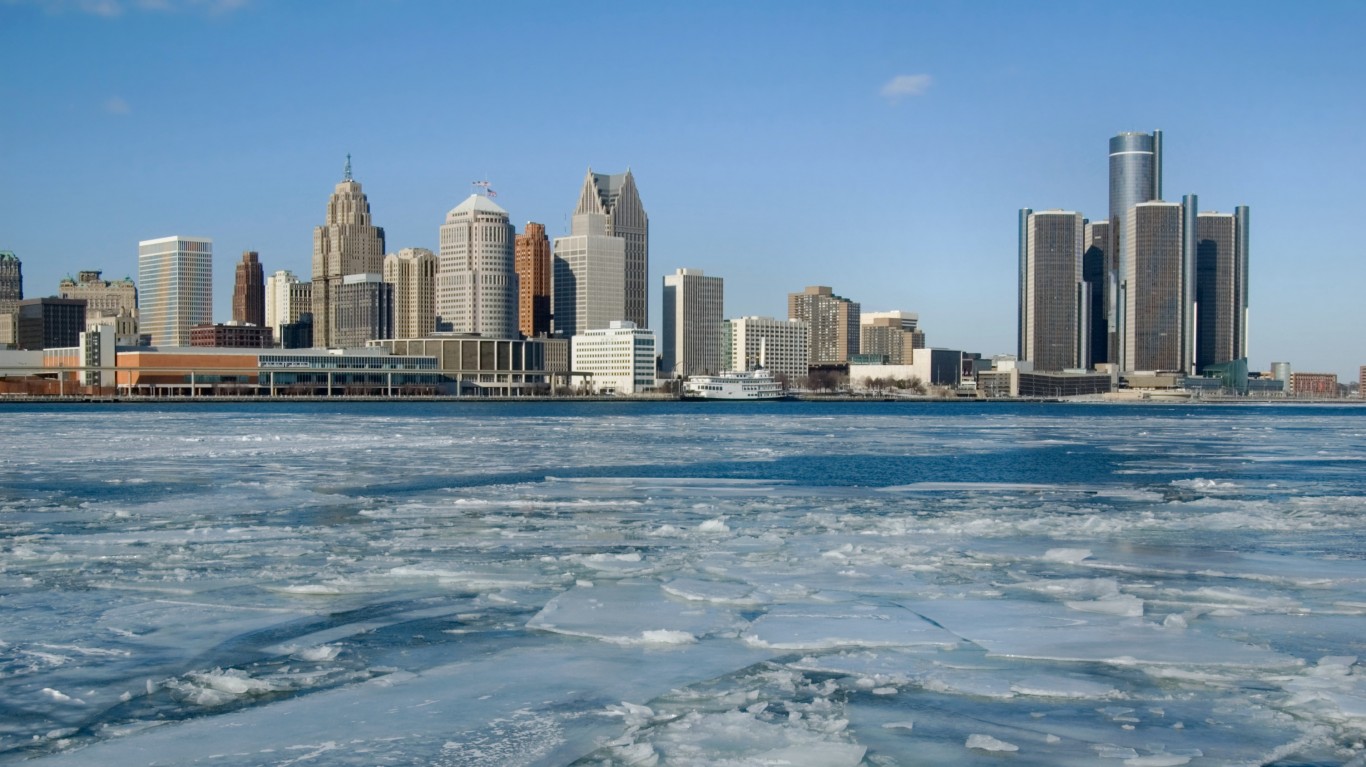
Michigan
> Drought Severity and Coverage Index week of June 8, 2021: 192
> Average DSCI over past 12 months: 53.4 — 21st lowest
> Worst week of drought: 192, June 8, 2021
> Longest single stretch of severe drought, since last summer: 5 weeks
[in-text-ad-2]
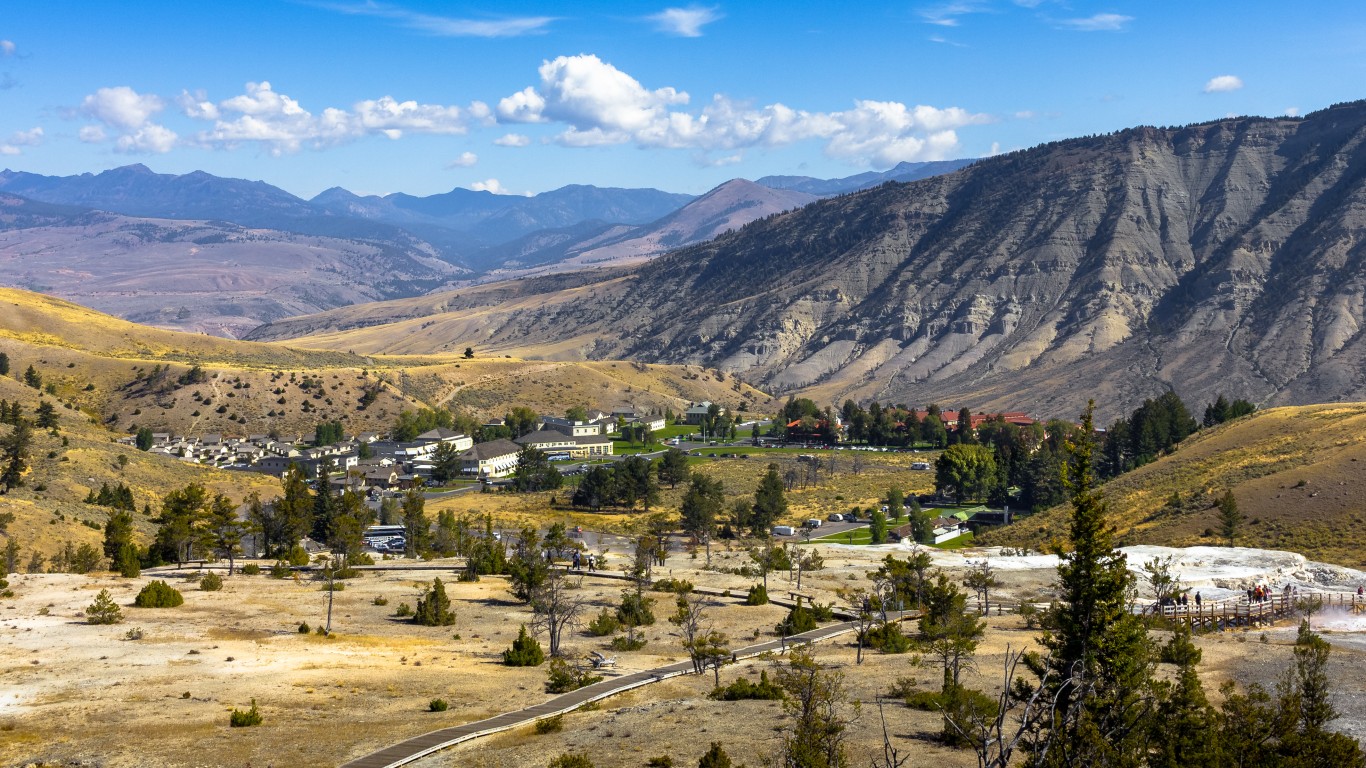
Wyoming
> Drought Severity and Coverage Index week of June 8, 2021: 196
> Average DSCI over past 12 months: 230.8 — 8th highest
> Worst week of drought: 289, Feb 2, 2021
> Longest single stretch of severe drought, since last summer: 47 weeks

Idaho
> Drought Severity and Coverage Index week of June 8, 2021: 217
> Average DSCI over past 12 months: 93.2 — 21st highest
> Worst week of drought: 217, June 8, 2021
> Longest single stretch of severe drought, since last summer: 4 weeks
[in-text-ad]

Washington
> Drought Severity and Coverage Index week of June 8, 2021: 228
> Average DSCI over past 12 months: 91.3 — 22nd highest
> Worst week of drought: 228, June 8, 2021
> Longest single stretch of severe drought, since last summer: 6 weeks

South Dakota
> Drought Severity and Coverage Index week of June 8, 2021: 236
> Average DSCI over past 12 months: 161.7 — 12th highest
> Worst week of drought: 246, March 9, 2021
> Longest single stretch of severe drought, since last summer: 28 weeks

Oregon
> Drought Severity and Coverage Index week of June 8, 2021: 320
> Average DSCI over past 12 months: 253.2 — 6th highest
> Worst week of drought: 320, June 8, 2021
> Longest single stretch of severe drought, since last summer: 52 weeks
[in-text-ad-2]

North Dakota
> Drought Severity and Coverage Index week of June 8, 2021: 376
> Average DSCI over past 12 months: 219.7 — 9th highest
> Worst week of drought: 393, May 18, 2021
> Longest single stretch of severe drought, since last summer: 37 weeks

New Mexico
> Drought Severity and Coverage Index week of June 8, 2021: 378
> Average DSCI over past 12 months: 366.3 — 2nd highest
> Worst week of drought: 436, Jan 19, 2021
> Longest single stretch of severe drought, since last summer: 52 weeks
[in-text-ad]

Nevada
> Drought Severity and Coverage Index week of June 8, 2021: 411
> Average DSCI over past 12 months: 343.4 — 4th highest
> Worst week of drought: 411, May 11, 2021
> Longest single stretch of severe drought, since last summer: 52 weeks

California
> Drought Severity and Coverage Index week of June 8, 2021: 413
> Average DSCI over past 12 months: 249.1 — 7th highest
> Worst week of drought: 413, June 8, 2021
> Longest single stretch of severe drought, since last summer: 43 weeks

Arizona
> Drought Severity and Coverage Index week of June 8, 2021: 438
> Average DSCI over past 12 months: 364.0 — 3rd highest
> Worst week of drought: 468, Dec 1, 2020
> Longest single stretch of severe drought, since last summer: 45 weeks
[in-text-ad-2]

Utah
> Drought Severity and Coverage Index week of June 8, 2021: 452
> Average DSCI over past 12 months: 395.4 — the highest
> Worst week of drought: 458, Jan 19, 2021
> Longest single stretch of severe drought, since last summer: 52 weeks
Are You Still Paying With a Debit Card?
The average American spends $17,274 on debit cards a year, and it’s a HUGE mistake. First, debit cards don’t have the same fraud protections as credit cards. Once your money is gone, it’s gone. But more importantly you can actually get something back from this spending every time you swipe.
Issuers are handing out wild bonuses right now. With some you can earn up to 5% back on every purchase. That’s like getting a 5% discount on everything you buy!
Our top pick is kind of hard to imagine. Not only does it pay up to 5% back, it also includes a $200 cash back reward in the first six months, a 0% intro APR, and…. $0 annual fee. It’s quite literally free money for any one that uses a card regularly. Click here to learn more!
Flywheel Publishing has partnered with CardRatings to provide coverage of credit card products. Flywheel Publishing and CardRatings may receive a commission from card issuers.
Thank you for reading! Have some feedback for us?
Contact the 24/7 Wall St. editorial team.
Latest from 24/7

Our expert who first called NVIDIA in 2009 is predicting 2025 will see a historic AI breakthrough.
You can follow him investing $500,000 of his own money on our top AI stocks for free.