
Exercise is one of the most effective ways for people to improve their overall health. Regular exercise has been shown to reduce the risk of depression, weight gain, and certain chronic diseases, while improving cognitive function, sleep quality, and physical balance — among many other benefits.
Though the importance of physical activity is well established, over 55 million American adults lead completely sedentary lifestyles. Physical inactivity accounts for about one in every 10 premature deaths in the U.S. and also has broader social costs — presenting an estimated $117 billion burden on the health care system annually, according to the Centers for Disease Control and Prevention.
While insufficient exercise is a major public health challenge in the United States, there are parts of the country where adults are far more likely than average to lead active lifestyles.
Using data from County Health Rankings & Roadmaps, a Robert Wood Johnson Foundation and University of Wisconsin Population Health Institute joint program, 24/7 Wall St. identified the 50 most physically active metropolitan areas in the United States.
In every metro area on this list, the share of adults who exercise is higher than 82%, compared to 77.3% of adults nationwide. The majority of these metros are located in Western states, including 10 in California, and seven in Washington.
Given the benefits associated with regular exercise, it is perhaps not surprising that overall health outcomes are often better in places where larger shares of the population are physically active. For example, in nearly every metro area on this list, both the obesity rate and the share of adults who report being in fair or poor health are lower than the respective national averages of 29.7% and 16.5%. Here is a look at the most obese states in America.
Click here to see America’s most active metros
Click here to see our detailed methodology

50. Minneapolis-St. Paul-Bloomington, MN-WI
> Adults who exercise: 82.4%
> Pop. with access to places for physical activity: 94.8% — 27th highest of 384 metros
> Adult obesity rate: 27.1% — 61st lowest of 384 metros
> Adults with diabetes: 7.8% — 31st lowest of 384 metros
> Adults reporting poor or fair health: 12.0% — 6th lowest of 384 metros
> Physically unhealthy days per month: 3.2 — 11th lowest of 384 metros
[in-text-ad]

49. Napa, CA
> Adults who exercise: 82.4%
> Pop. with access to places for physical activity: 89.8% — 71st highest of 384 metros
> Adult obesity rate: 24.1% — 25th lowest of 384 metros
> Adults with diabetes: 9.8% — 121st lowest of 384 metros
> Adults reporting poor or fair health: 15.9% — 85th lowest of 384 metros
> Physically unhealthy days per month: 3.7 — 70th lowest of 384 metros

48. Lincoln, NE
> Adults who exercise: 82.4%
> Pop. with access to places for physical activity: 94.8% — 28th highest of 384 metros
> Adult obesity rate: 30.0% — 123rd lowest of 384 metros
> Adults with diabetes: 8.2% — 43rd lowest of 384 metros
> Adults reporting poor or fair health: 12.5% — 10th lowest of 384 metros
> Physically unhealthy days per month: 3.1 — 9th lowest of 384 metros

47. Raleigh-Cary, NC
> Adults who exercise: 82.5%
> Pop. with access to places for physical activity: 85.5% — 126th highest of 384 metros
> Adult obesity rate: 29.3% — 108th lowest of 384 metros
> Adults with diabetes: 9.3% — 93rd lowest of 384 metros
> Adults reporting poor or fair health: 14.9% — 53rd lowest of 384 metros
> Physically unhealthy days per month: 3.4 — 22nd lowest of 384 metros
[in-text-ad-2]
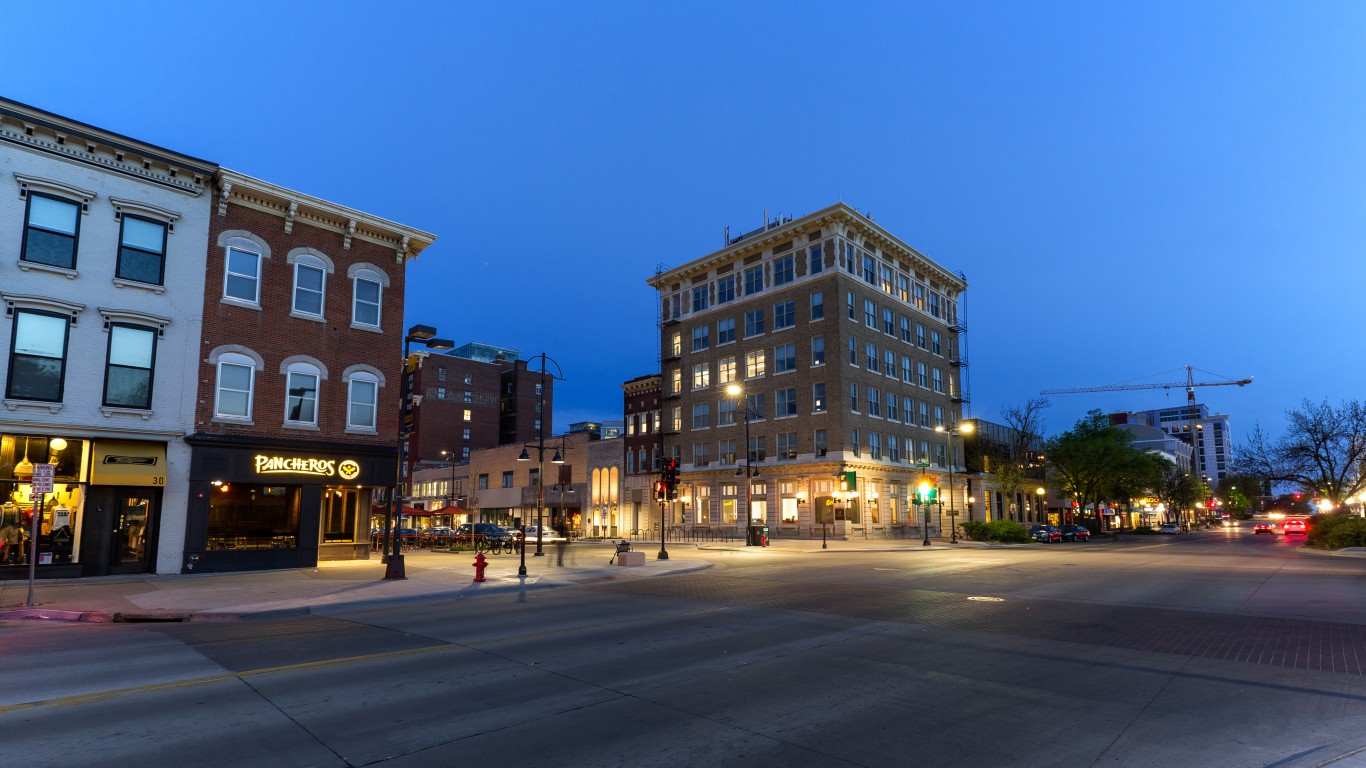
46. Iowa City, IA
> Adults who exercise: 82.6%
> Pop. with access to places for physical activity: 91.1% — 56th highest of 384 metros
> Adult obesity rate: 27.7% — 68th lowest of 384 metros
> Adults with diabetes: 7.0% — 16th lowest of 384 metros
> Adults reporting poor or fair health: 12.9% — 14th lowest of 384 metros
> Physically unhealthy days per month: 3.1 — 7th lowest of 384 metros

45. Portland-South Portland, ME
> Adults who exercise: 82.6%
> Pop. with access to places for physical activity: 81.4% — 185th highest of 384 metros
> Adult obesity rate: 25.9% — 43rd lowest of 384 metros
> Adults with diabetes: 8.9% — 70th lowest of 384 metros
> Adults reporting poor or fair health: 13.2% — 19th lowest of 384 metros
> Physically unhealthy days per month: 3.4 — 24th lowest of 384 metros
[in-text-ad]

44. St. George, UT
> Adults who exercise: 82.6%
> Pop. with access to places for physical activity: 81.4% — 186th highest of 384 metros
> Adult obesity rate: 24.0% — 23rd lowest of 384 metros (tied)
> Adults with diabetes: 8.6% — 54th lowest of 384 metros (tied)
> Adults reporting poor or fair health: 15.9% — 83rd lowest of 384 metros
> Physically unhealthy days per month: 4 — 121st lowest of 384 metros
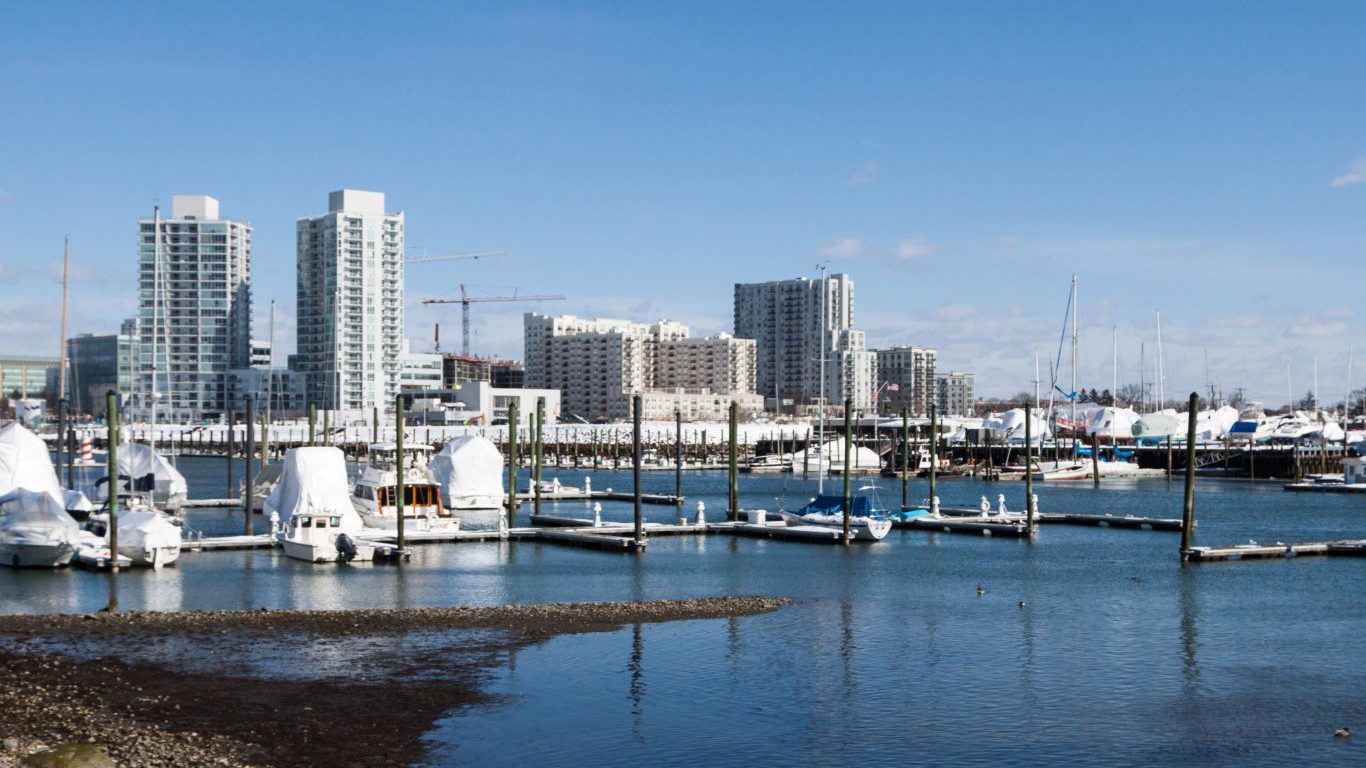
43. Bridgeport-Stamford-Norwalk, CT
> Adults who exercise: 82.7%
> Pop. with access to places for physical activity: 96.8% — 13th highest of 384 metros
> Adult obesity rate: 21.2% — 8th lowest of 384 metros
> Adults with diabetes: 7.3% — 23rd lowest of 384 metros
> Adults reporting poor or fair health: 11.9% — 5th lowest of 384 metros
> Physically unhealthy days per month: 3.2 — 14th lowest of 384 metros

42. Bremerton-Silverdale-Port Orchard, WA
> Adults who exercise: 82.7%
> Pop. with access to places for physical activity: 85.2% — 130th highest of 384 metros
> Adult obesity rate: 30.2% — 131st lowest of 384 metros
> Adults with diabetes: 8.9% — 69th lowest of 384 metros
> Adults reporting poor or fair health: 15.2% — 62nd lowest of 384 metros
> Physically unhealthy days per month: 4.1 — 174th lowest of 384 metros
[in-text-ad-2]
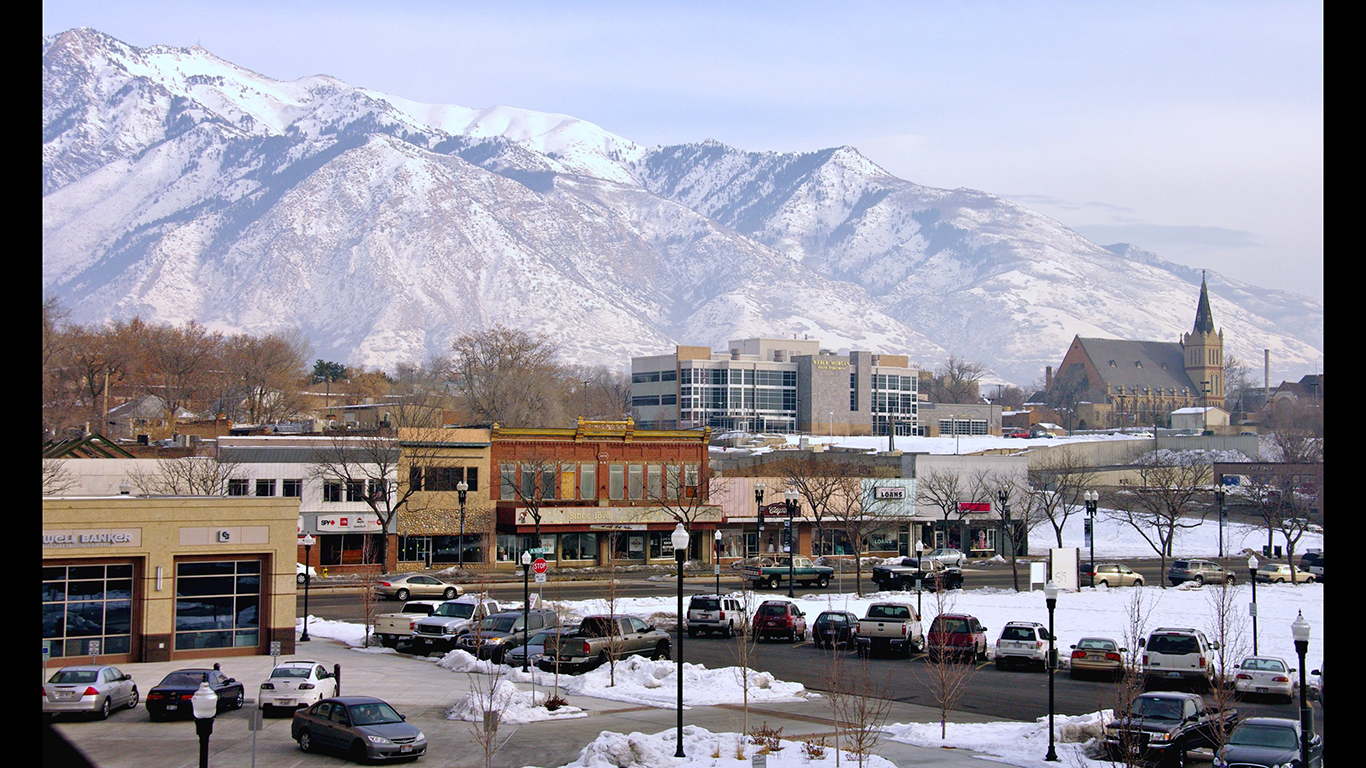
41. Ogden-Clearfield, UT
> Adults who exercise: 82.7%
> Pop. with access to places for physical activity: 89.4% — 75th highest of 384 metros
> Adult obesity rate: 29.2% — 101st lowest of 384 metros
> Adults with diabetes: 8.4% — 47th lowest of 384 metros
> Adults reporting poor or fair health: 14.1% — 36th lowest of 384 metros
> Physically unhealthy days per month: 3.7 — 72nd lowest of 384 metros

40. Barnstable Town, MA
> Adults who exercise: 82.8%
> Pop. with access to places for physical activity: 91.6% — 50th highest of 384 metros
> Adult obesity rate: 22.5% — 15th lowest of 384 metros
> Adults with diabetes: 10.1% — 146th lowest of 384 metros
> Adults reporting poor or fair health: 12.7% — 12th lowest of 384 metros
> Physically unhealthy days per month: 3.4 — 28th lowest of 384 metros
[in-text-ad]

39. Austin-Round Rock-Georgetown, TX
> Adults who exercise: 82.9%
> Pop. with access to places for physical activity: 87.1% — 102nd highest of 384 metros
> Adult obesity rate: 26.9% — 56th lowest of 384 metros
> Adults with diabetes: 7.9% — 33rd lowest of 384 metros
> Adults reporting poor or fair health: 16.3% — 100th lowest of 384 metros
> Physically unhealthy days per month: 3.5 — 39th lowest of 384 metros

38. Redding, CA
> Adults who exercise: 83.0%
> Pop. with access to places for physical activity: 77.9% — 157th lowest of 384 metros
> Adult obesity rate: 26.6% — 50th lowest of 384 metros
> Adults with diabetes: 12.4% — 110th highest of 384 metros (tied)
> Adults reporting poor or fair health: 17.2% — 140th lowest of 384 metros
> Physically unhealthy days per month: 4.6 — 79th highest of 384 metros

37. Salt Lake City, UT
> Adults who exercise: 83.1%
> Pop. with access to places for physical activity: 90.3% — 66th highest of 384 metros
> Adult obesity rate: 26.8% — 53rd lowest of 384 metros
> Adults with diabetes: 7.2% — 22nd lowest of 384 metros
> Adults reporting poor or fair health: 16.3% — 101st lowest of 384 metros
> Physically unhealthy days per month: 3.8 — 86th lowest of 384 metros
[in-text-ad-2]

36. Burlington-South Burlington, VT
> Adults who exercise: 83.4%
> Pop. with access to places for physical activity: 77.9% — 156th lowest of 384 metros
> Adult obesity rate: 25.4% — 36th lowest of 384 metros
> Adults with diabetes: 7.7% — 30th lowest of 384 metros
> Adults reporting poor or fair health: 11.8% — 3rd lowest of 384 metros
> Physically unhealthy days per month: 3.7 — 60th lowest of 384 metros
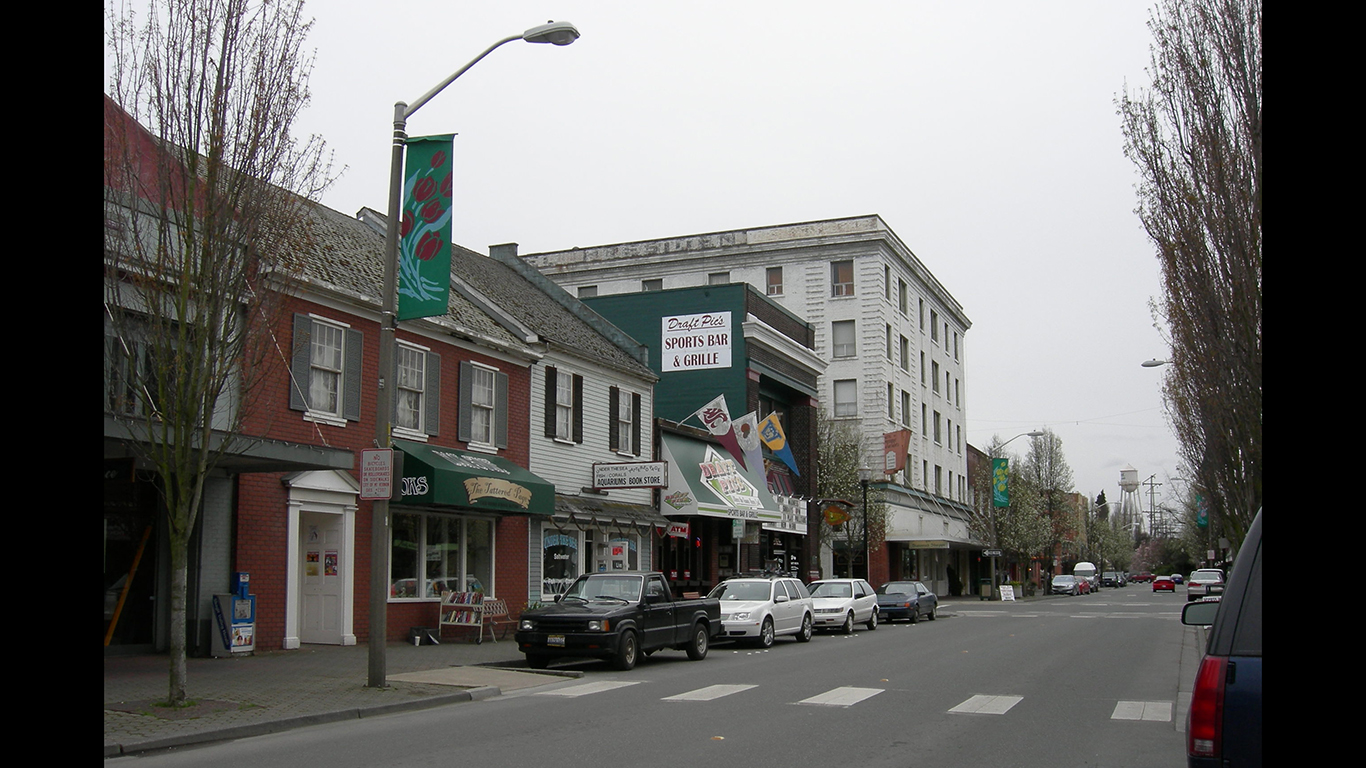
35. Mount Vernon-Anacortes, WA
> Adults who exercise: 83.4%
> Pop. with access to places for physical activity: 80.6% — 192nd lowest of 384 metros
> Adult obesity rate: 30.2% — 129th lowest of 384 metros
> Adults with diabetes: 9.8% — 120th lowest of 384 metros
> Adults reporting poor or fair health: 16.4% — 104th lowest of 384 metros
> Physically unhealthy days per month: 4.1 — 158th lowest of 384 metros
[in-text-ad]
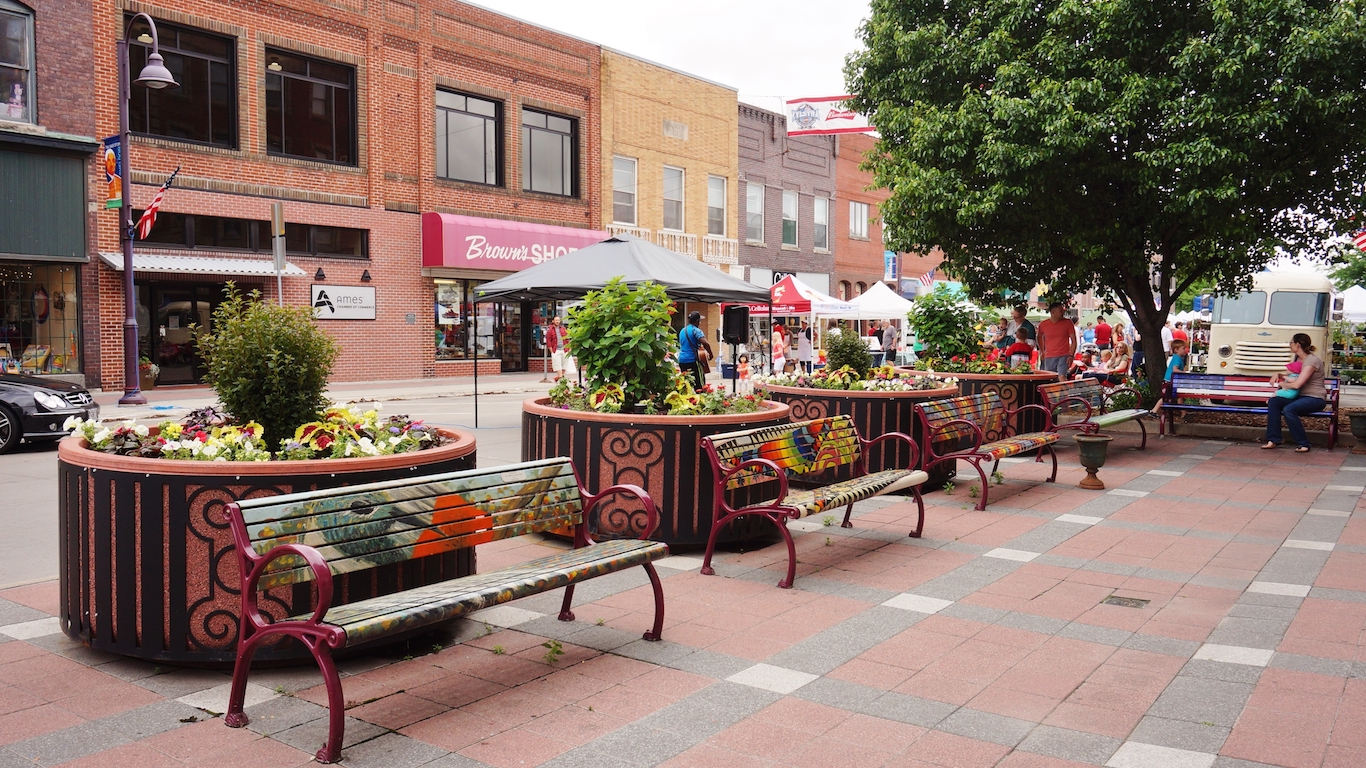
34. Ames, IA
> Adults who exercise: 83.5%
> Pop. with access to places for physical activity: 93.1% — 36th highest of 384 metros
> Adult obesity rate: 28.9% — 97th lowest of 384 metros
> Adults with diabetes: 7.9% — 34th lowest of 384 metros
> Adults reporting poor or fair health: 12.8% — 13th lowest of 384 metros
> Physically unhealthy days per month: 3.3 — 17th lowest of 384 metros

33. Flagstaff, AZ
> Adults who exercise: 83.5%
> Pop. with access to places for physical activity: 82.9% — 162nd highest of 384 metros
> Adult obesity rate: 24.5% — 30th lowest of 384 metros
> Adults with diabetes: 7.7% — 29th lowest of 384 metros
> Adults reporting poor or fair health: 17.9% — 166th lowest of 384 metros
> Physically unhealthy days per month: 4.3 — 139th highest of 384 metros
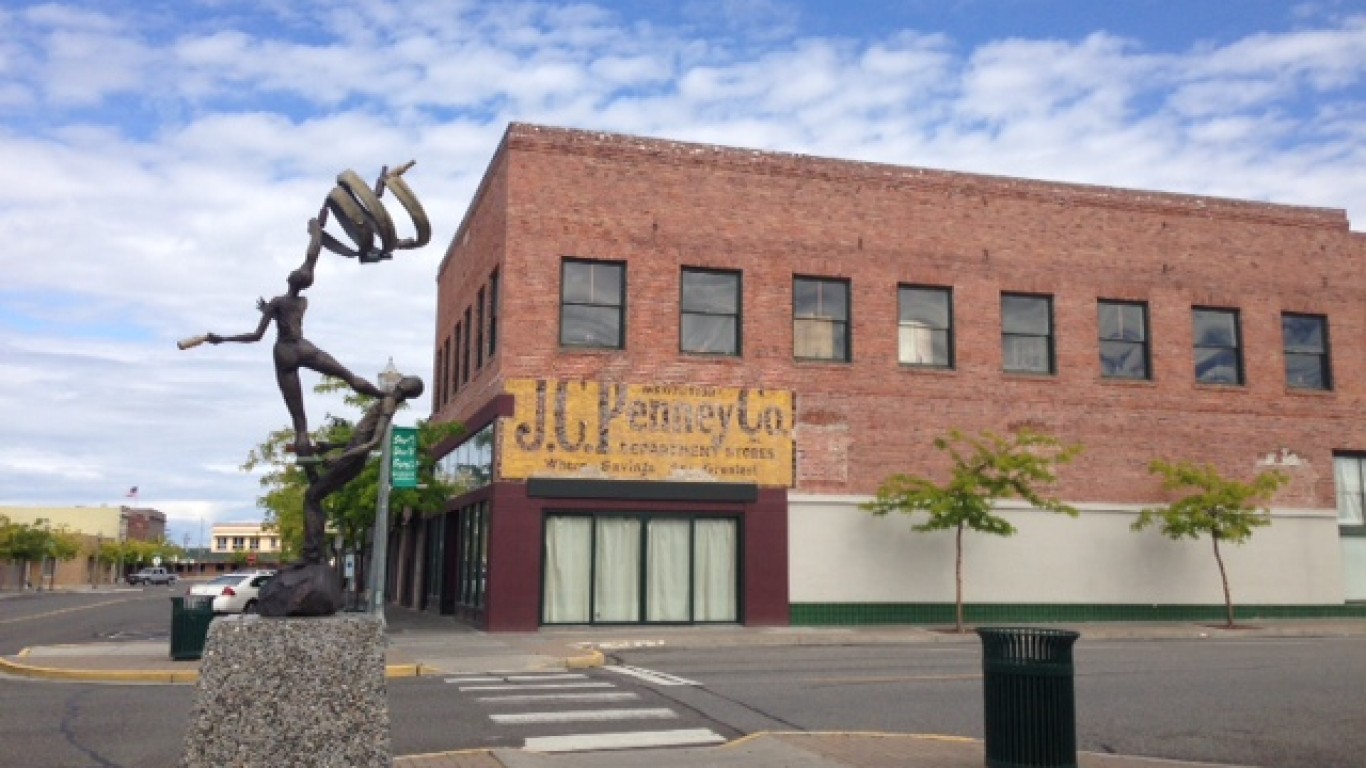
32. Kennewick-Richland, WA
> Adults who exercise: 83.6%
> Pop. with access to places for physical activity: 72.3% — 99th lowest of 384 metros
> Adult obesity rate: 33.5% — 143rd highest of 384 metros
> Adults with diabetes: 9.5% — 104th lowest of 384 metros
> Adults reporting poor or fair health: 19.3% — 162nd highest of 384 metros
> Physically unhealthy days per month: 4.4 — 131st highest of 384 metros
[in-text-ad-2]

31. Eugene-Springfield, OR
> Adults who exercise: 83.7%
> Pop. with access to places for physical activity: 88.5% — 81st highest of 384 metros
> Adult obesity rate: 28.6% — 88th lowest of 384 metros
> Adults with diabetes: 9.4% — 95th lowest of 384 metros
> Adults reporting poor or fair health: 18.4% — 185th lowest of 384 metros
> Physically unhealthy days per month: 4.8 — 59th highest of 384 metros
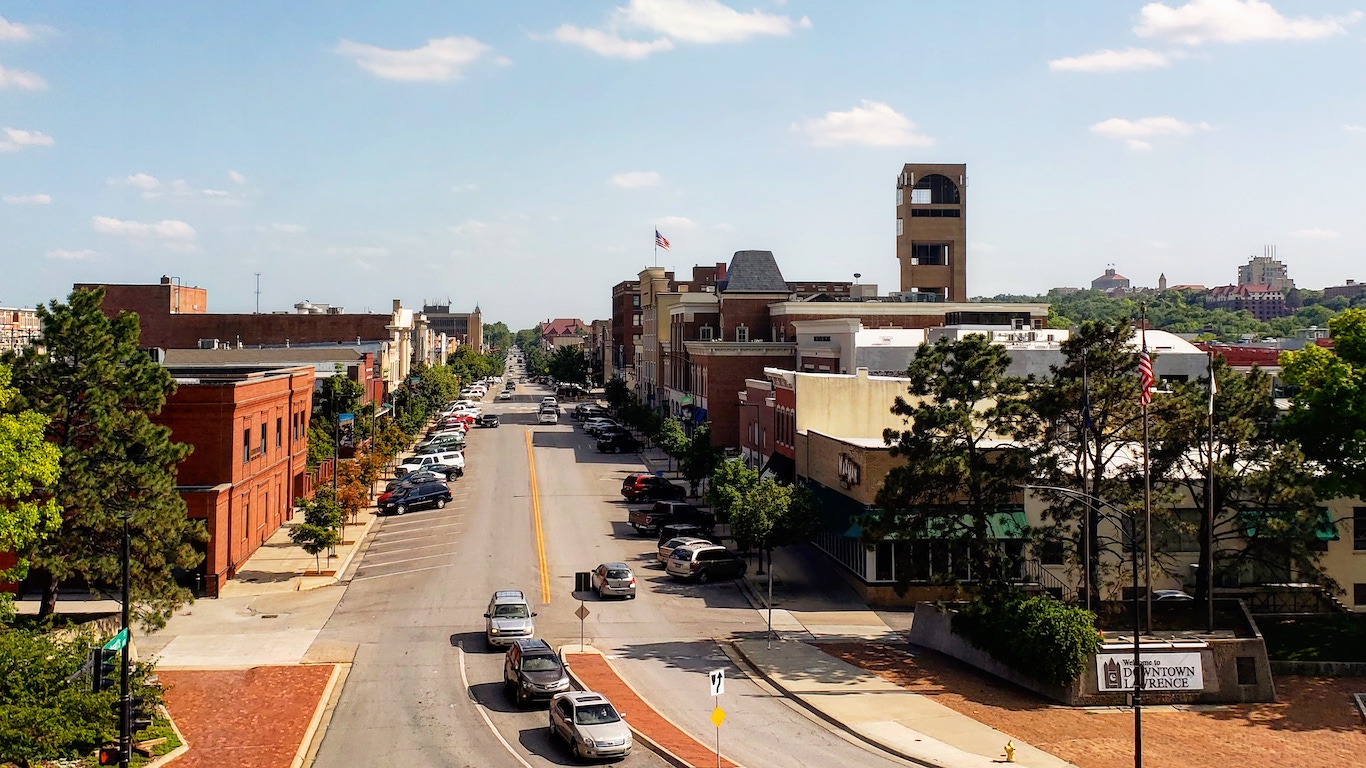
30. Lawrence, KS
> Adults who exercise: 83.7%
> Pop. with access to places for physical activity: 91.0% — 57th highest of 384 metros
> Adult obesity rate: 28.0% — 73rd lowest of 384 metros
> Adults with diabetes: 7.0% — 18th lowest of 384 metros
> Adults reporting poor or fair health: 14.8% — 52nd lowest of 384 metros
> Physically unhealthy days per month: 3.5 — 36th lowest of 384 metros
[in-text-ad]

29. Albuquerque, NM
> Adults who exercise: 83.8%
> Pop. with access to places for physical activity: 84.9% — 136th highest of 384 metros
> Adult obesity rate: 25.5% — 39th lowest of 384 metros
> Adults with diabetes: 7.9% — 32nd lowest of 384 metros
> Adults reporting poor or fair health: 19.2% — 167th highest of 384 metros
> Physically unhealthy days per month: 4.2 — 180th highest of 384 metros
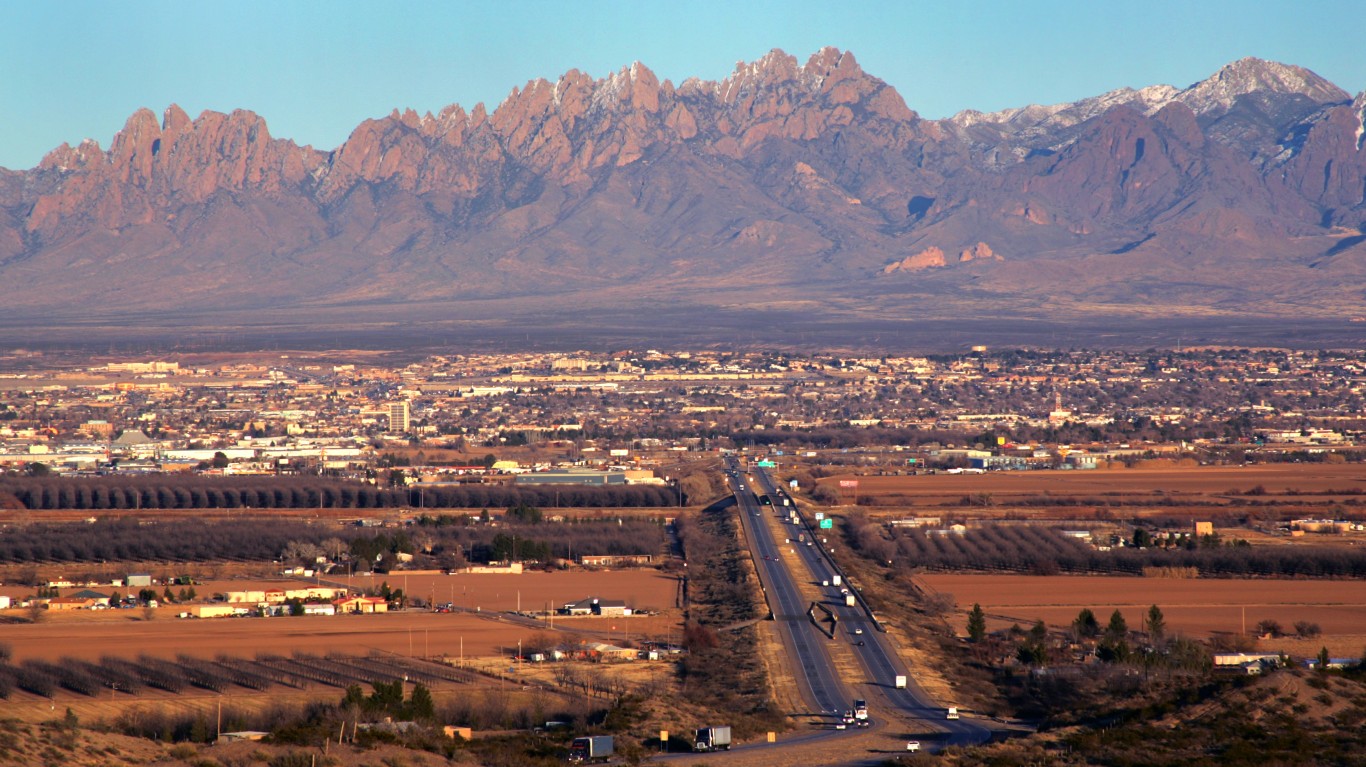
28. Las Cruces, NM
> Adults who exercise: 83.9%
> Pop. with access to places for physical activity: 78.0% — 159th lowest of 384 metros
> Adult obesity rate: 26.4% — 48th lowest of 384 metros
> Adults with diabetes: 9.6% — 107th lowest of 384 metros
> Adults reporting poor or fair health: 23.5% — 33rd highest of 384 metros
> Physically unhealthy days per month: 4.4 — 116th highest of 384 metros

27. San Jose-Sunnyvale-Santa Clara, CA
> Adults who exercise: 83.9%
> Pop. with access to places for physical activity: 98.1% — 7th highest of 384 metros
> Adult obesity rate: 20.4% — 6th lowest of 384 metros
> Adults with diabetes: 8.5% — 50th lowest of 384 metros
> Adults reporting poor or fair health: 14.5% — 46th lowest of 384 metros
> Physically unhealthy days per month: 3.7 — 65th lowest of 384 metros
[in-text-ad-2]

26. Walla Walla, WA
> Adults who exercise: 83.9%
> Pop. with access to places for physical activity: 80.5% — 190th lowest of 384 metros
> Adult obesity rate: 29.3% — 104th lowest of 384 metros
> Adults with diabetes: 12.1% — 124th highest of 384 metros
> Adults reporting poor or fair health: 17.8% — 158th lowest of 384 metros
> Physically unhealthy days per month: 4.2 — 178th lowest of 384 metros

25. Los Angeles-Long Beach-Anaheim, CA
> Adults who exercise: 84.0%
> Pop. with access to places for physical activity: 98.1% — 6th highest of 384 metros
> Adult obesity rate: 21.6% — 10th lowest of 384 metros
> Adults with diabetes: 8.8% — 66th lowest of 384 metros
> Adults reporting poor or fair health: 20.2% — 115th highest of 384 metros
> Physically unhealthy days per month: 4.3 — 166th highest of 384 metros
[in-text-ad]

24. Medford, OR
> Adults who exercise: 84.1%
> Pop. with access to places for physical activity: 82.6% — 169th highest of 384 metros
> Adult obesity rate: 26.8% — 55th lowest of 384 metros
> Adults with diabetes: 10.7% — 178th lowest of 384 metros
> Adults reporting poor or fair health: 19.4% — 155th highest of 384 metros
> Physically unhealthy days per month: 4.8 — 45th highest of 384 metros

23. Santa Rosa-Petaluma, CA
> Adults who exercise: 84.3%
> Pop. with access to places for physical activity: 93.7% — 34th highest of 384 metros
> Adult obesity rate: 23.9% — 21st lowest of 384 metros
> Adults with diabetes: 8.3% — 45th lowest of 384 metros
> Adults reporting poor or fair health: 15.1% — 60th lowest of 384 metros
> Physically unhealthy days per month: 4 — 129th lowest of 384 metros
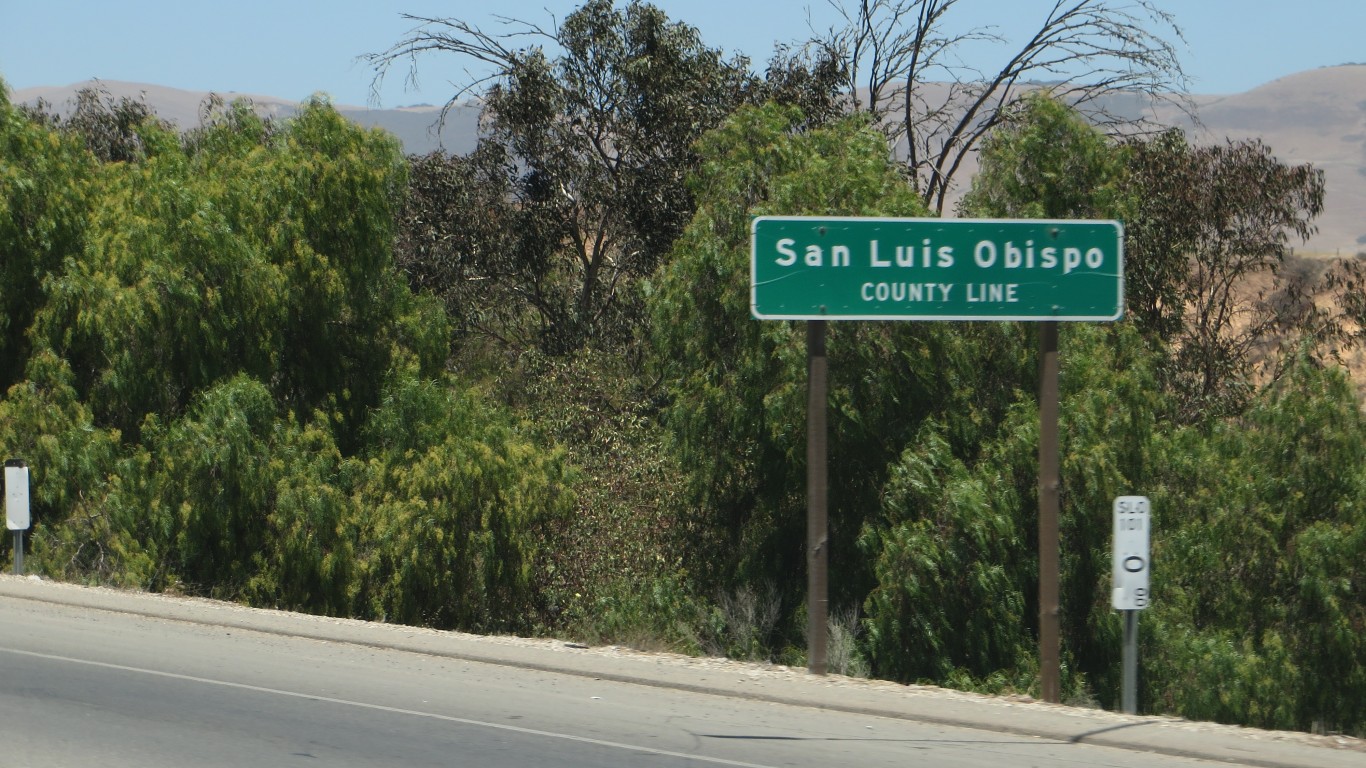
22. San Luis Obispo-Paso Robles, CA
> Adults who exercise: 84.4%
> Pop. with access to places for physical activity: 87.6% — 92nd highest of 384 metros
> Adult obesity rate: 28.6% — 87th lowest of 384 metros
> Adults with diabetes: 9.1% — 80th lowest of 384 metros (tied)
> Adults reporting poor or fair health: 15.2% — 64th lowest of 384 metros
> Physically unhealthy days per month: 4 — 137th lowest of 384 metros
[in-text-ad-2]

21. Colorado Springs, CO
> Adults who exercise: 84.4%
> Pop. with access to places for physical activity: 88.1% — 87th highest of 384 metros
> Adult obesity rate: 22.9% — 16th lowest of 384 metros
> Adults with diabetes: 6.6% — 15th lowest of 384 metros
> Adults reporting poor or fair health: 13.6% — 28th lowest of 384 metros
> Physically unhealthy days per month: 3.5 — 35th lowest of 384 metros

20. Madison, WI
> Adults who exercise: 84.5%
> Pop. with access to places for physical activity: 88.9% — 79th highest of 384 metros
> Adult obesity rate: 25.9% — 44th lowest of 384 metros
> Adults with diabetes: 6.6% — 14th lowest of 384 metros
> Adults reporting poor or fair health: 12.5% — 9th lowest of 384 metros
> Physically unhealthy days per month: 3.4 — 21st lowest of 384 metros
[in-text-ad]

19. Bend, OR
> Adults who exercise: 84.5%
> Pop. with access to places for physical activity: 90.4% — 65th highest of 384 metros
> Adult obesity rate: 25.5% — 37th lowest of 384 metros
> Adults with diabetes: 8.5% — 48th lowest of 384 metros
> Adults reporting poor or fair health: 15.1% — 58th lowest of 384 metros
> Physically unhealthy days per month: 4.1 — 161st lowest of 384 metros

18. Portland-Vancouver-Hillsboro, OR-WA
> Adults who exercise: 84.6%
> Pop. with access to places for physical activity: 94.3% — 30th highest of 384 metros
> Adult obesity rate: 28.0% — 75th lowest of 384 metros
> Adults with diabetes: 9.0% — 75th lowest of 384 metros
> Adults reporting poor or fair health: 15.8% — 80th lowest of 384 metros
> Physically unhealthy days per month: 4.2 — 182nd lowest of 384 metros

17. Seattle-Tacoma-Bellevue, WA
> Adults who exercise: 84.8%
> Pop. with access to places for physical activity: 91.7% — 48th highest of 384 metros
> Adult obesity rate: 26.1% — 47th lowest of 384 metros
> Adults with diabetes: 8.5% — 52nd lowest of 384 metros
> Adults reporting poor or fair health: 14.0% — 32nd lowest of 384 metros
> Physically unhealthy days per month: 3.6 — 49th lowest of 384 metros
[in-text-ad-2]
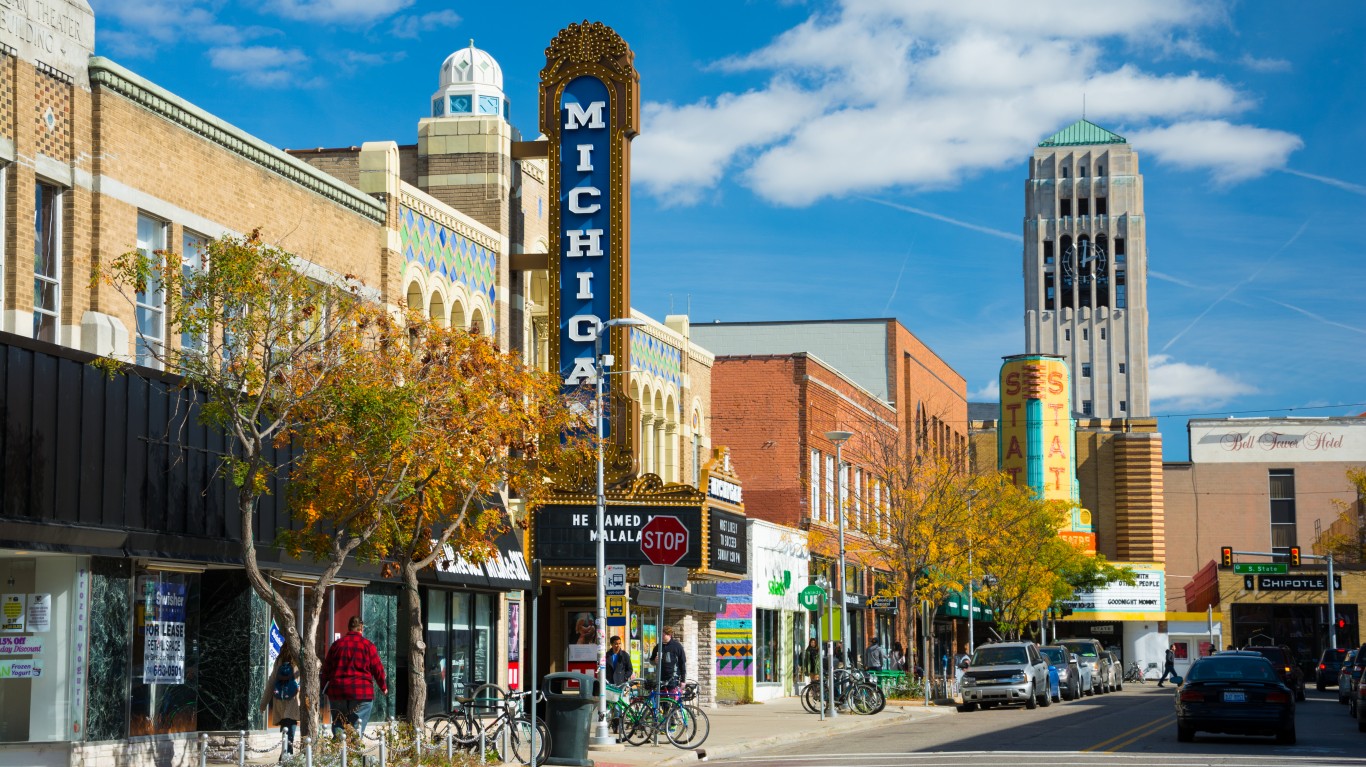
16. Ann Arbor, MI
> Adults who exercise: 84.9%
> Pop. with access to places for physical activity: 90.2% — 69th highest of 384 metros
> Adult obesity rate: 25.5% — 38th lowest of 384 metros
> Adults with diabetes: 7.5% — 26th lowest of 384 metros
> Adults reporting poor or fair health: 14.4% — 43rd lowest of 384 metros
> Physically unhealthy days per month: 3.8 — 74th lowest of 384 metros

15. San Francisco-Oakland-Berkeley, CA
> Adults who exercise: 85.0%
> Pop. with access to places for physical activity: 98.9% — 5th highest of 384 metros
> Adult obesity rate: 21.7% — 13th lowest of 384 metros
> Adults with diabetes: 7.4% — 24th lowest of 384 metros
> Adults reporting poor or fair health: 14.0% — 33rd lowest of 384 metros
> Physically unhealthy days per month: 3.6 — 53rd lowest of 384 metros
[in-text-ad]

14. Grand Junction, CO
> Adults who exercise: 85.0%
> Pop. with access to places for physical activity: 77.4% — 152nd lowest of 384 metros
> Adult obesity rate: 25.8% — 41st lowest of 384 metros
> Adults with diabetes: 8.6% — 53rd lowest of 384 metros
> Adults reporting poor or fair health: 15.6% — 71st lowest of 384 metros
> Physically unhealthy days per month: 3.9 — 101st lowest of 384 metros
13. Logan, UT-ID
> Adults who exercise: 85.1%
> Pop. with access to places for physical activity: 84.0% — 151st highest of 384 metros
> Adult obesity rate: 25.0% — 33rd lowest of 384 metros
> Adults with diabetes: 6.1% — 6th lowest of 384 metros
> Adults reporting poor or fair health: 15.2% — 63rd lowest of 384 metros
> Physically unhealthy days per month: 4 — 135th lowest of 384 metros

12. San Diego-Chula Vista-Carlsbad, CA
> Adults who exercise: 85.1%
> Pop. with access to places for physical activity: 97.0% — 12th highest of 384 metros
> Adult obesity rate: 20.3% — 5th lowest of 384 metros
> Adults with diabetes: 7.6% — 28th lowest of 384 metros
> Adults reporting poor or fair health: 15.8% — 81st lowest of 384 metros
> Physically unhealthy days per month: 3.9 — 115th lowest of 384 metros
[in-text-ad-2]

11. Provo-Orem, UT
> Adults who exercise: 85.1%
> Pop. with access to places for physical activity: 84.3% — 145th highest of 384 metros
> Adult obesity rate: 25.8% — 42nd lowest of 384 metros
> Adults with diabetes: 6.2% — 9th lowest of 384 metros
> Adults reporting poor or fair health: 13.3% — 21st lowest of 384 metros
> Physically unhealthy days per month: 3.8 — 81st lowest of 384 metros

10. Ithaca, NY
> Adults who exercise: 85.4%
> Pop. with access to places for physical activity: 86.2% — 116th highest of 384 metros
> Adult obesity rate: 23.0% — 17th lowest of 384 metros
> Adults with diabetes: 6.5% — 11th lowest of 384 metros
> Adults reporting poor or fair health: 13.5% — 23rd lowest of 384 metros
> Physically unhealthy days per month: 3.5 — 38th lowest of 384 metros
[in-text-ad]

9. Olympia-Lacey-Tumwater, WA
> Adults who exercise: 85.6%
> Pop. with access to places for physical activity: 74.6% — 116th lowest of 384 metros
> Adult obesity rate: 30.1% — 126th lowest of 384 metros
> Adults with diabetes: 10.2% — 152nd lowest of 384 metros (tied)
> Adults reporting poor or fair health: 15.4% — 68th lowest of 384 metros
> Physically unhealthy days per month: 3.8 — 92nd lowest of 384 metros

8. Denver-Aurora-Lakewood, CO
> Adults who exercise: 85.8%
> Pop. with access to places for physical activity: 96.6% — 16th highest of 384 metros
> Adult obesity rate: 21.6% — 12th lowest of 384 metros
> Adults with diabetes: 6.3% — 10th lowest of 384 metros
> Adults reporting poor or fair health: 13.7% — 29th lowest of 384 metros
> Physically unhealthy days per month: 3.3 — 18th lowest of 384 metros

7. Santa Maria-Santa Barbara, CA
> Adults who exercise: 86.0%
> Pop. with access to places for physical activity: 92.2% — 44th highest of 384 metros
> Adult obesity rate: 24.2% — 26th lowest of 384 metros
> Adults with diabetes: 8.0% — 38th lowest of 384 metros
> Adults reporting poor or fair health: 19.3% — 159th highest of 384 metros
> Physically unhealthy days per month: 4.2 — 191st highest of 384 metros
[in-text-ad-2]

6. Corvallis, OR
> Adults who exercise: 86.1%
> Pop. with access to places for physical activity: 90.3% — 68th highest of 384 metros
> Adult obesity rate: 21.6% — 11th lowest of 384 metros
> Adults with diabetes: 5.7% — 3rd lowest of 384 metros
> Adults reporting poor or fair health: 16.1% — 93rd lowest of 384 metros
> Physically unhealthy days per month: 4.1 — 146th lowest of 384 metros

5. Bellingham, WA
> Adults who exercise: 87.3%
> Pop. with access to places for physical activity: 85.1% — 133rd highest of 384 metros
> Adult obesity rate: 28.0% — 74th lowest of 384 metros
> Adults with diabetes: 7.9% — 36th lowest of 384 metros
> Adults reporting poor or fair health: 15.0% — 56th lowest of 384 metros
> Physically unhealthy days per month: 4.2 — 176th highest of 384 metros
[in-text-ad]

4. Santa Fe, NM
> Adults who exercise: 87.3%
> Pop. with access to places for physical activity: 78.7% — 167th lowest of 384 metros
> Adult obesity rate: 16.1% — 2nd lowest of 384 metros
> Adults with diabetes: 6.1% — 7th lowest of 384 metros
> Adults reporting poor or fair health: 17.8% — 165th lowest of 384 metros
> Physically unhealthy days per month: 4 — 132nd lowest of 384 metros
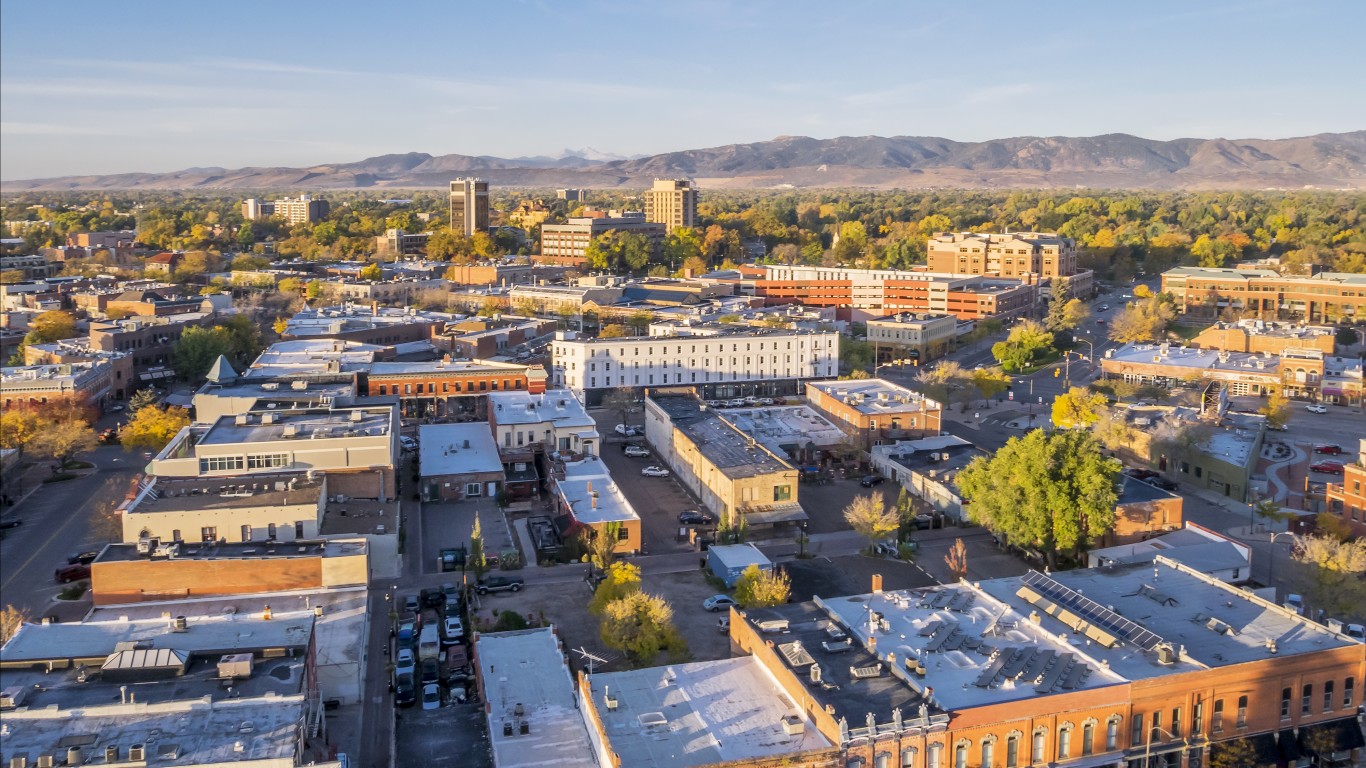
3. Fort Collins, CO
> Adults who exercise: 88.4%
> Pop. with access to places for physical activity: 92.8% — 39th highest of 384 metros
> Adult obesity rate: 20.9% — 7th lowest of 384 metros
> Adults with diabetes: 5.4% — the lowest of 384 metros
> Adults reporting poor or fair health: 11.2% — 2nd lowest of 384 metros
> Physically unhealthy days per month: 3.2 — 12th lowest of 384 metros

2. Santa Cruz-Watsonville, CA
> Adults who exercise: 88.9%
> Pop. with access to places for physical activity: 94.0% — 32nd highest of 384 metros
> Adult obesity rate: 19.3% — 3rd lowest of 384 metros
> Adults with diabetes: 6.2% — 8th lowest of 384 metros
> Adults reporting poor or fair health: 16.3% — 99th lowest of 384 metros
> Physically unhealthy days per month: 4 — 119th lowest of 384 metros
[in-text-ad-2]

1. Boulder, CO
> Adults who exercise: 91.1%
> Pop. with access to places for physical activity: 96.2% — 18th highest of 384 metros
> Adult obesity rate: 14.3% — the lowest of 384 metros
> Adults with diabetes: 5.5% — 2nd lowest of 384 metros
> Adults reporting poor or fair health: 11.2% — the lowest of 384 metros
> Physically unhealthy days per month: 3 — 5th lowest of 384 metros
Methodology
To determine America’s most active metros, 24/7 Wall St. reviewed adult physical inactivity rates from the Robert Wood Johnson Foundation and the University of Wisconsin Population Health Institute joint program’s 2021 County Health Rankings & Roadmaps report.
The physical inactivity rate is defined as the share of adults 20 years and older who report no leisure-time physical activity. While the CHR report is from 2021, physical inactivity figures published in the report are from 2017.
We used the 384 metropolitan statistical areas as delineated by the United States Office of Management and Budget and used by the Census Bureau as our definition of metros.
Metros were ranked based on the adult physical inactivity rate. Additional information on the share of the population with adequate access to locations for physical activity, the share of adults 20 years and older who report a body mass index of 30 kg/m2 or higher (considered obese), the share of adults 20 years and older with diagnosed diabetes, the share of adults reporting poor or fair health, and the average number of physically unhealthy days reported in the past 30 days also came from the 2021 CHR.
The Average American Is Losing Their Savings Every Day (Sponsor)
If you’re like many Americans and keep your money ‘safe’ in a checking or savings account, think again. The average yield on a savings account is a paltry .4% today, and inflation is much higher. Checking accounts are even worse.
Every day you don’t move to a high-yield savings account that beats inflation, you lose more and more value.
But there is good news. To win qualified customers, some accounts are paying 9-10x this national average. That’s an incredible way to keep your money safe, and get paid at the same time. Our top pick for high yield savings accounts includes other one time cash bonuses, and is FDIC insured.
Click here to see how much more you could be earning on your savings today. It takes just a few minutes and your money could be working for you.
Thank you for reading! Have some feedback for us?
Contact the 24/7 Wall St. editorial team.
 24/7 Wall St.
 24/7 Wall St.
 24/7 Wall St.
 24/7 Wall St.
 24/7 Wall St.
