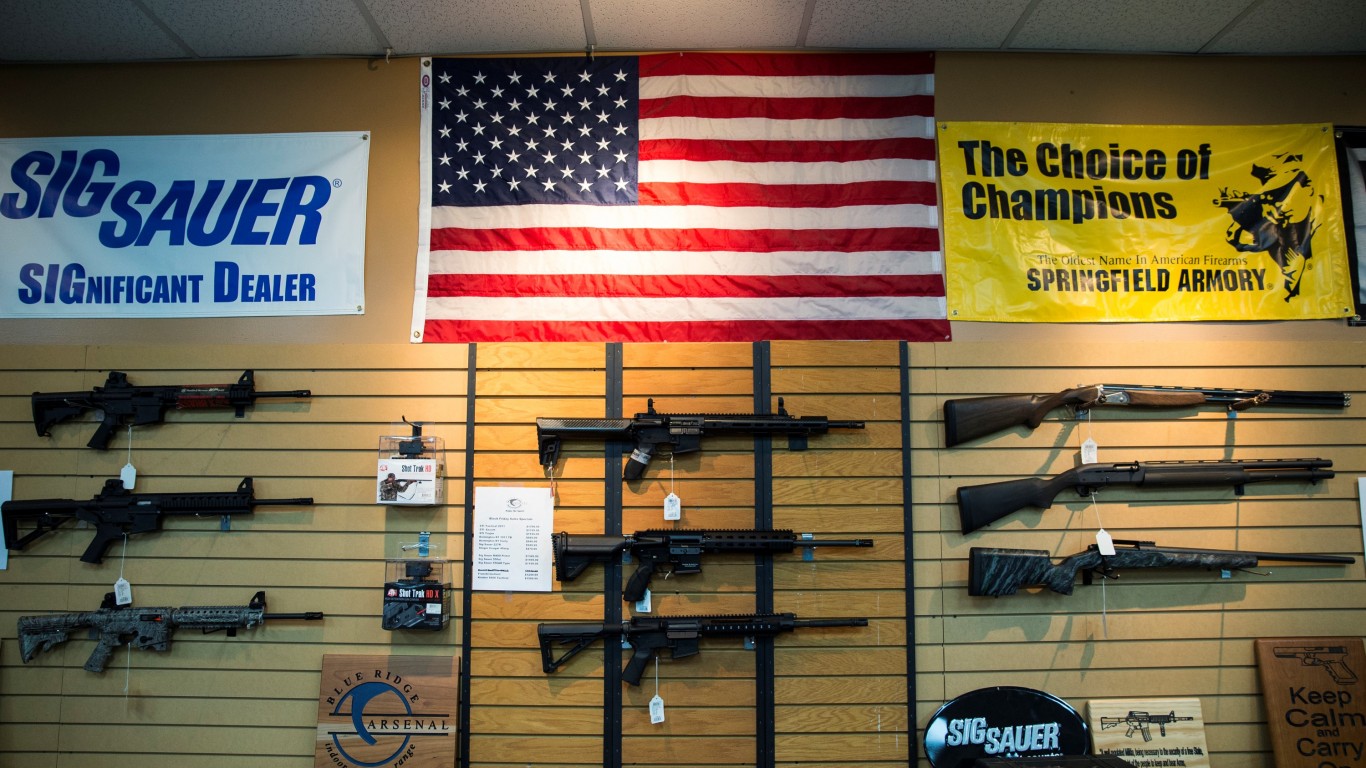
After several years during which U.S. gun sales rose, capped by a 2020 surge blamed mostly on the COVID-19 pandemic and civil unrest, figures started to level in 2021. They are currently dropping sharply, according to FBI data. Gun sales, estimated by background checks, declined over 10% year over year in September to 2,226,389. Total 2021 sales may drop below the 2020 annual figure.
For the first three quarters of 2021, gun sales reached 30,467,508. That compared to 28,626,509 for the same period last year. However, fourth quarter 2020 gun sales were strong and, based on current trends, are unlikely to be matched this October, November and December. These are the states with the best and worst gun laws.
The Federal Bureau of Investigation tracks background checks and publishes a list of how many are handled as part of its National Instant Criminal Background Check System. Each month, the figures are reported by state. Nearly everyone put through this system qualifies as a buyer. People who are excluded usually have criminal records. Of the more than 350 million checks that have been processed since 1998, there have only been 2 million denials. Therefore, the data is the best proxy for U.S. gun sales available.
Despite what could be a drop this year, gun sales have increased most years since 1999. Annual sales first topped 25 million in 2016, 20 million in 2013, 15 million in 2011, and 10 million in 2006. In 1999, the first full year the FBI kept data, sales totaled 9,138,123.
24/7 Wall St. reviewed firearm registrations in every state for the first nine months of 2021 from the FBI’s NICS. Though background checks and sales are not equal, the data is widely used as the best available proxy for gun sales. The state with the most gun sales in September was Kentucky at 370,706. The state accounted for 17% of national sales, though it has only 1.3% of the population. These are the states with the most gun violence.
Here are total sales by state or territory for the first nine months of this year

Alabama
> 2021 gun sales: 713,423
> Per capita gun sales: 14,550 per 100,000 residents (5th highest)
[in-text-ad]

Alaska
> Total gun sales: 68,653
> Per capita gun sales: 9,385 per 100,000 residents (12th highest)

Arizona
> Total gun sales: 438,322
> Per capita gun sales: 6,022 per 100,000 residents (17th lowest)

Arkansas
> Total gun sales: 214,197
> Per capita gun sales: 7,098 per 100,000 residents (25th lowest)
[in-text-ad-2]

California
> Total gun sales: 1,123,955
> Per capita gun sales: 2,845 per 100,000 residents (5th lowest)

Colorado
> Total gun sales: 478,331
> Per capita gun sales: 8,306 per 100,000 residents (17th highest)
[in-text-ad]

Connecticut
> Total gun sales: 216,146
> Per capita gun sales: 6,063 per 100,000 residents (18th lowest)

Delaware
> Total gun sales: 52,352
> Per capita gun sales: 5,376 per 100,000 residents (11th lowest)

Florida
> Total gun sales: 1,305,111
> Per capita gun sales: 6,077 per 100,000 residents (19th lowest)
[in-text-ad-2]

Georgia
> Total gun sales: 627,128
> Per capita gun sales: 5,907 per 100,000 residents (16th lowest)

Hawaii
> Total gun sales: 13,107
> Per capita gun sales: 926 per 100,000 residents (the lowest)
[in-text-ad]

Idaho
> Total gun sales: 205,910
> Per capita gun sales: 11,522 per 100,000 residents (7th highest)

Illinois
> Total gun sales: 7,481,507
> Per capita gun sales: 59,041 per 100,000 residents (2nd highest)

Indiana
> Total gun sales: 1,468,192
> Per capita gun sales: 21,808 per 100,000 residents (4th highest)
[in-text-ad-2]

Iowa
> Total gun sales: 209,181
> Per capita gun sales: 6,630 per 100,000 residents (22nd lowest)

Kansas
> Total gun sales: 170,476
> Per capita gun sales: 5,852 per 100,000 residents (15th lowest)
[in-text-ad]

Kentucky
> Total gun sales: 2,730,364
> Per capita gun sales: 61,114 per 100,000 residents (the highest)

Louisiana
> Total gun sales: 294,273
> Per capita gun sales: 6,330 per 100,000 residents (21st lowest)

Maine
> Total gun sales: 94,671
> Per capita gun sales: 7,043 per 100,000 residents (23rd lowest)
[in-text-ad-2]

Maryland
> Total gun sales: 206,959
> Per capita gun sales: 3,423 per 100,000 residents (7th lowest)

Massachusetts
> Total gun sales: 203,042
> Per capita gun sales: 2,946 per 100,000 residents (6th lowest)
[in-text-ad]

Michigan
> Total gun sales: 748,584
> Per capita gun sales: 7,496 per 100,000 residents (23rd highest)

Minnesota
> Total gun sales: 719,163
> Per capita gun sales: 12,752 per 100,000 residents (6th highest)

Mississippi
> Total gun sales: 233,742
> Per capita gun sales: 7,854 per 100,000 residents (20th highest)
[in-text-ad-2]

Missouri
> Total gun sales: 473,180
> Per capita gun sales: 7,710 per 100,000 residents (22nd highest)

Montana
> Total gun sales: 119,161
> Per capita gun sales: 11,149 per 100,000 residents (8th highest)
[in-text-ad]

Nebraska
> Total gun sales: 68,593
> Per capita gun sales: 3,546 per 100,000 residents (8th lowest)

Nevada
> Total gun sales: 146,628
> Per capita gun sales: 4,760 per 100,000 residents (9th lowest)

New Hampshire
> Total gun sales: 116,526
> Per capita gun sales: 8,570 per 100,000 residents (15th highest)
[in-text-ad-2]

New Jersey
> Total gun sales: 181,478
> Per capita gun sales: 2,043 per 100,000 residents (3rd lowest)

New Mexico
> Total gun sales: 148,540
> Per capita gun sales: 7,084 per 100,000 residents (24th lowest)
[in-text-ad]

New York
> Total gun sales: 351,254
> Per capita gun sales: 1,806 per 100,000 residents (2nd lowest)

North Carolina
> Total gun sales: 603,914
> Per capita gun sales: 5,758 per 100,000 residents (14th lowest)

North Dakota
> Total gun sales: 60,362
> Per capita gun sales: 7,921 per 100,000 residents (19th highest)
[in-text-ad-2]

Ohio
> Total gun sales: 644,917
> Per capita gun sales: 5,517 per 100,000 residents (12th lowest)

Oklahoma
> Total gun sales: 305,898
> Per capita gun sales: 7,731 per 100,000 residents (21st highest)
[in-text-ad]

Oregon
> Total gun sales: 343,606
> Per capita gun sales: 8,147 per 100,000 residents (18th highest)

Pennsylvania
> Total gun sales: 1,068,542
> Per capita gun sales: 8,347 per 100,000 residents (16th highest)

Rhode Island
> Total gun sales: 30,020
> Per capita gun sales: 2,834 per 100,000 residents (4th lowest)
[in-text-ad-2]

South Carolina
> Total gun sales: 370,614
> Per capita gun sales: 7,198 per 100,000 residents (25th highest)

South Dakota
> Total gun sales: 79,081
> Per capita gun sales: 8,939 per 100,000 residents (14th highest)
[in-text-ad]

Tennessee
> Total gun sales: 723,700
> Per capita gun sales: 10,597 per 100,000 residents (10th highest)

Texas
> Total gun sales: 1,496,999
> Per capita gun sales: 5,163 per 100,000 residents (10th lowest)

Utah
> Total gun sales: 916,042
> Per capita gun sales: 28,573 per 100,000 residents (3rd highest)
[in-text-ad-2]

Vermont
> Total gun sales: 38,983
> Per capita gun sales: 6,247 per 100,000 residents (20th lowest)

Virginia
> Total gun sales: 488,208
> Per capita gun sales: 5,720 per 100,000 residents (13th lowest)
[in-text-ad]
Washington
> Total gun sales: 550,260
> Per capita gun sales: 7,226 per 100,000 residents (24th highest)

West Virginia
> Total gun sales: 163,937
> Per capita gun sales: 9,148 per 100,000 residents (13th highest)

Wisconsin
> Total gun sales: 584,957
> Per capita gun sales: 10,047 per 100,000 residents (11th highest)
[in-text-ad-2]

Wyoming
> Total gun sales: 62,914
> Per capita gun sales: 10,871 per 100,000 residents (9th highest)
Thank you for reading! Have some feedback for us?
Contact the 24/7 Wall St. editorial team.
 24/7 Wall St.
 24/7 Wall St.
 24/7 Wall St.
 24/7 Wall St.
 24/7 Wall St.


