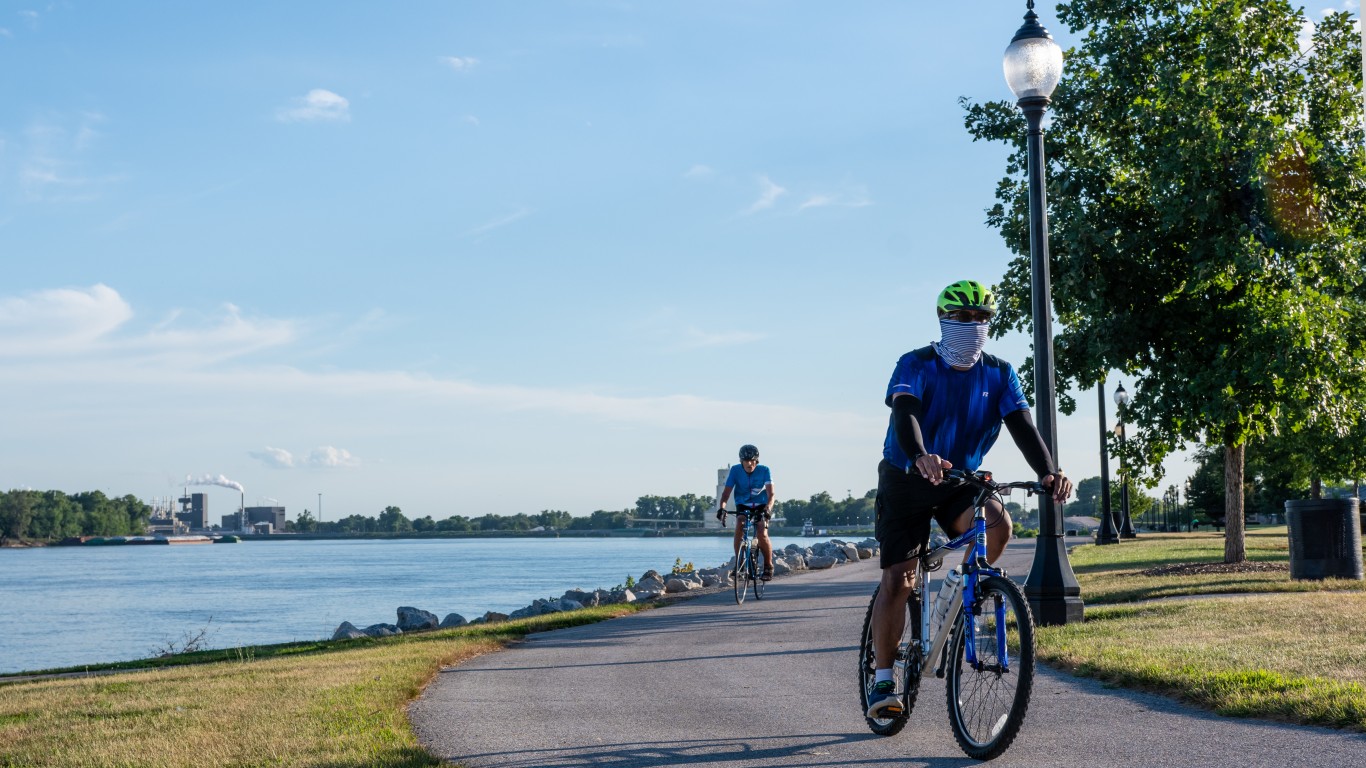
Exercise is one of the most effective ways for people to improve their overall health. Regular exercise has been shown to reduce the risk of depression, weight gain, and certain chronic diseases, while improving cognitive function, sleep quality, and physical balance — among many other benefits.
Though the importance of physical activity is well established, over 55 million American adults lead completely sedentary lifestyles. Physical inactivity accounts for about one in every 10 premature deaths in the U.S. and also has broader social costs — presenting an estimated $117 billion burden on the health care system annually, according to the Centers for Disease Control and Prevention.
While insufficient exercise is a major public health challenge in the United States, there are parts of the country where adults are far more likely than average to lead active lifestyles.
Using data from County Health Rankings & Roadmaps, a Robert Wood Johnson Foundation and University of Wisconsin Population Health Institute joint program, 24/7 Tempo identified the most physically active county in each state. County and county equivalents are ranked by the share of adults 20 or older who report some leisure time physical activity.
Though each county or county equivalent on this list ranks as the most physically active in its state, the share of adults who exercise with some regularity varies considerably in these places — from about 75% to over 90%. Nationwide, 77.3% of adults exercise in their leisure time.
Given the benefits associated with regular exercise, it is perhaps not surprising that overall health outcomes are often better in places where larger shares of the population are physically active. For example, in the vast majority of counties on this list, both the obesity rate and the share of adults who report being in fair or poor health are lower than the respective statewide averages. Here is a look at the most obese states in America.
Click here to see the most active county in every state.
Click here to see our detailed methodology.

Alabama: Lee County
> Adults who exercise: 80.1% (Alabama: 70.7%)
> Pop. with access to places for physical activity: 67.7% (Alabama: 61.1%)
> Adult obesity rate: 30.8% (Alabama: 36.1%)
> Adults with diabetes: 10.3% (Alabama: 14.5%)
> Adults reporting poor or fair health: 20.0% (Alabama: 21.4%)
> Physically unhealthy days per month: 4.6 (Alabama: 4.4)
[in-text-ad]

Alaska: Hoonah-Angoon Census Area
> Adults who exercise: 83.4% (Alaska: 80.7%)
> Pop. with access to places for physical activity: N/A (Alaska: 100.0%)
> Adult obesity rate: 30.4% (Alaska: 31.9%)
> Adults with diabetes: 15.1% (Alaska: 8.3%)
> Adults reporting poor or fair health: 19.0% (Alaska: 15.6%)
> Physically unhealthy days per month: 4.6 (Alaska: 4.1)

Arizona: Coconino County
> Adults who exercise: 83.5% (Arizona: 78.8%)
> Pop. with access to places for physical activity: 82.9% (Arizona: 85.1%)
> Adult obesity rate: 24.5% (Arizona: 27.9%)
> Adults with diabetes: 7.7% (Arizona: 9.6%)
> Adults reporting poor or fair health: 17.9% (Arizona: 18.6%)
> Physically unhealthy days per month: 4.3 (Arizona: 4.2)

Arkansas: Benton County
> Adults who exercise: 77.4% (Arkansas: 69.6%)
> Pop. with access to places for physical activity: 77.3% (Arkansas: 63.5%)
> Adult obesity rate: 31.1% (Arkansas: 35.0%)
> Adults with diabetes: 9.6% (Arkansas: 13.5%)
> Adults reporting poor or fair health: 19.9% (Arkansas: 23.3%)
> Physically unhealthy days per month: 4.3 (Arkansas: 4.8)
[in-text-ad-2]

California: Santa Cruz County
> Adults who exercise: 88.9% (California: 82.3%)
> Pop. with access to places for physical activity: 94.0% (California: 93.1%)
> Adult obesity rate: 19.3% (California: 24.3%)
> Adults with diabetes: 6.2% (California: 8.8%)
> Adults reporting poor or fair health: 16.3% (California: 17.6%)
> Physically unhealthy days per month: 4 (California: 3.9)
Colorado: Boulder County
> Adults who exercise: 91.1% (Colorado: 85.2%)
> Pop. with access to places for physical activity: 96.2% (Colorado: 90.5%)
> Adult obesity rate: 14.3% (Colorado: 22.4%)
> Adults with diabetes: 5.5% (Colorado: 6.6%)
> Adults reporting poor or fair health: 11.2% (Colorado: 13.8%)
> Physically unhealthy days per month: 3 (Colorado: 3.3)
[in-text-ad]

Connecticut: Fairfield County
> Adults who exercise: 82.7% (Connecticut: 80.1%)
> Pop. with access to places for physical activity: 96.8% (Connecticut: 94.0%)
> Adult obesity rate: 21.2% (Connecticut: 26.3%)
> Adults with diabetes: 7.3% (Connecticut: 9.2%)
> Adults reporting poor or fair health: 11.9% (Connecticut: 13.0%)
> Physically unhealthy days per month: 3.2 (Connecticut: 3.3)
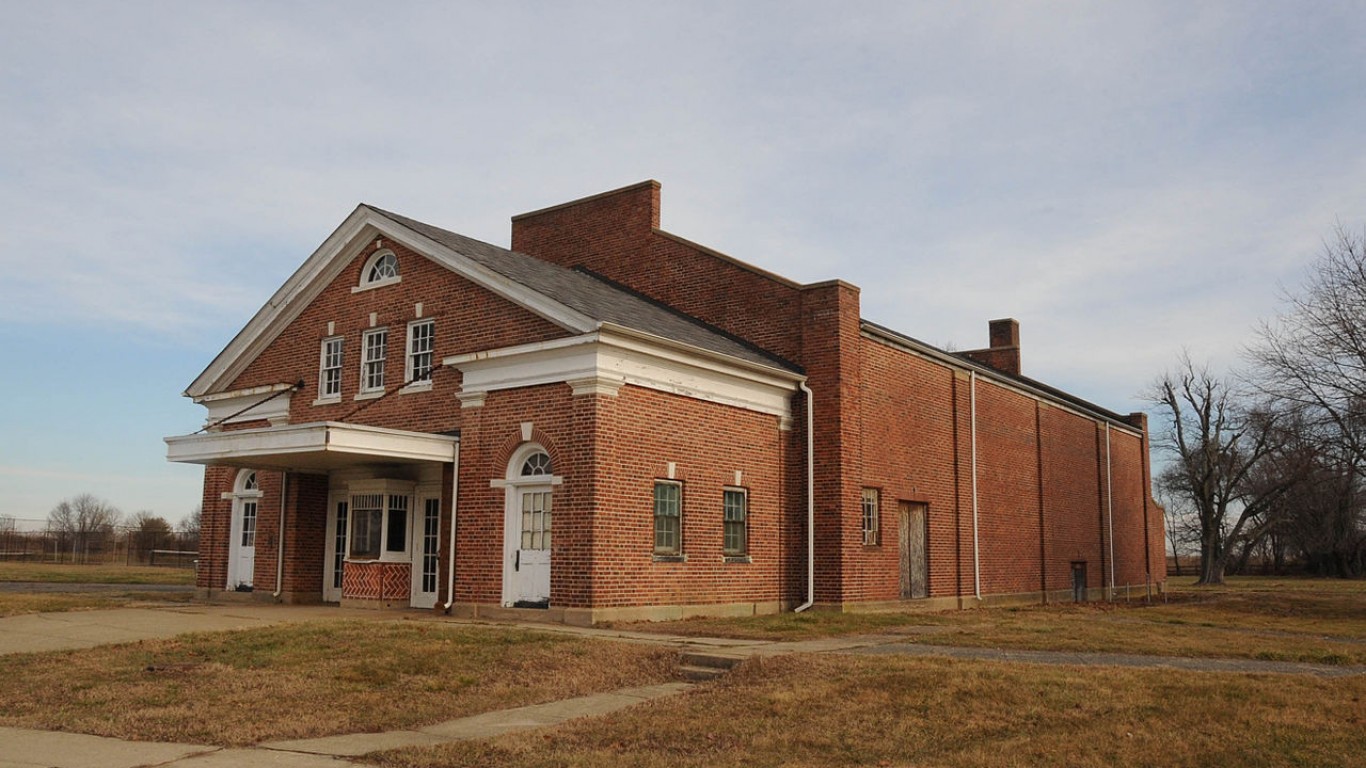
Delaware: New Castle County
> Adults who exercise: 75.3% (Delaware: 72.7%)
> Pop. with access to places for physical activity: 96.9% (Delaware: 86.5%)
> Adult obesity rate: 30.2% (Delaware: 32.4%)
> Adults with diabetes: 10.6% (Delaware: 11.8%)
> Adults reporting poor or fair health: 16.6% (Delaware: 16.3%)
> Physically unhealthy days per month: 3.7 (Delaware: 3.7)

Florida: St. Johns County
> Adults who exercise: 78.4% (Florida: 74.2%)
> Pop. with access to places for physical activity: 93.7% (Florida: 88.7%)
> Adult obesity rate: 23.1% (Florida: 27.2%)
> Adults with diabetes: 8.2% (Florida: 10.8%)
> Adults reporting poor or fair health: 13.7% (Florida: 19.5%)
> Physically unhealthy days per month: 3.5 (Florida: 4)
[in-text-ad-2]

Georgia: Forsyth County
> Adults who exercise: 82.9% (Georgia: 73.6%)
> Pop. with access to places for physical activity: 85.7% (Georgia: 75.5%)
> Adult obesity rate: 26.5% (Georgia: 32.3%)
> Adults with diabetes: 7.6% (Georgia: 12.0%)
> Adults reporting poor or fair health: 12.0% (Georgia: 18.4%)
> Physically unhealthy days per month: 3 (Georgia: 3.9)

Hawaii: Maui County
> Adults who exercise: 82.3% (Hawaii: 80.4%)
> Pop. with access to places for physical activity: 92.5% (Hawaii: 92.5%)
> Adult obesity rate: 24.6% (Hawaii: 24.6%)
> Adults with diabetes: 10.3% (Hawaii: 11.1%)
> Adults reporting poor or fair health: 14.7% (Hawaii: 15.4%)
> Physically unhealthy days per month: 3.5 (Hawaii: 3.2)
[in-text-ad]

Idaho: Blaine County
> Adults who exercise: 85.8% (Idaho: 79.6%)
> Pop. with access to places for physical activity: 78.4% (Idaho: 78.9%)
> Adult obesity rate: 16.5% (Idaho: 29.0%)
> Adults with diabetes: 5.9% (Idaho: 9.3%)
> Adults reporting poor or fair health: 16.1% (Idaho: 15.1%)
> Physically unhealthy days per month: 3.8 (Idaho: 3.7)

Illinois: Kane County
> Adults who exercise: 85.7% (Illinois: 78.4%)
> Pop. with access to places for physical activity: 96.4% (Illinois: 90.8%)
> Adult obesity rate: 28.3% (Illinois: 29.7%)
> Adults with diabetes: 10.1% (Illinois: 9.9%)
> Adults reporting poor or fair health: 16.3% (Illinois: 15.9%)
> Physically unhealthy days per month: 3.7 (Illinois: 3.6)

Indiana: Hamilton County
> Adults who exercise: 82.6% (Indiana: 73.3%)
> Pop. with access to places for physical activity: 91.3% (Indiana: 75.2%)
> Adult obesity rate: 25.7% (Indiana: 33.9%)
> Adults with diabetes: 8.4% (Indiana: 12.1%)
> Adults reporting poor or fair health: 12.0% (Indiana: 18.2%)
> Physically unhealthy days per month: 3 (Indiana: 4)
[in-text-ad-2]
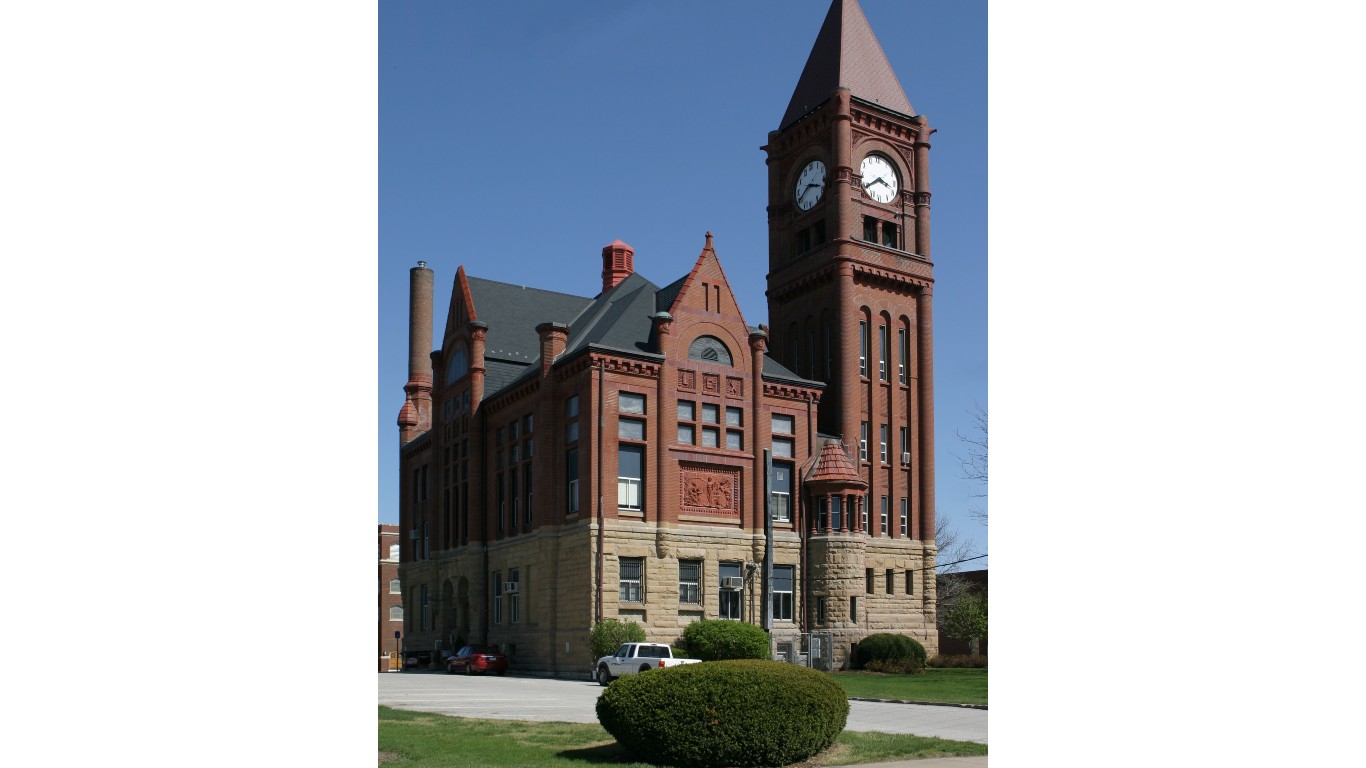
Iowa: Jefferson County
> Adults who exercise: 86.6% (Iowa: 77.4%)
> Pop. with access to places for physical activity: 66.6% (Iowa: 82.9%)
> Adult obesity rate: 30.3% (Iowa: 34.3%)
> Adults with diabetes: 8.9% (Iowa: 9.9%)
> Adults reporting poor or fair health: 14.1% (Iowa: 13.5%)
> Physically unhealthy days per month: 3.2 (Iowa: 3.1)
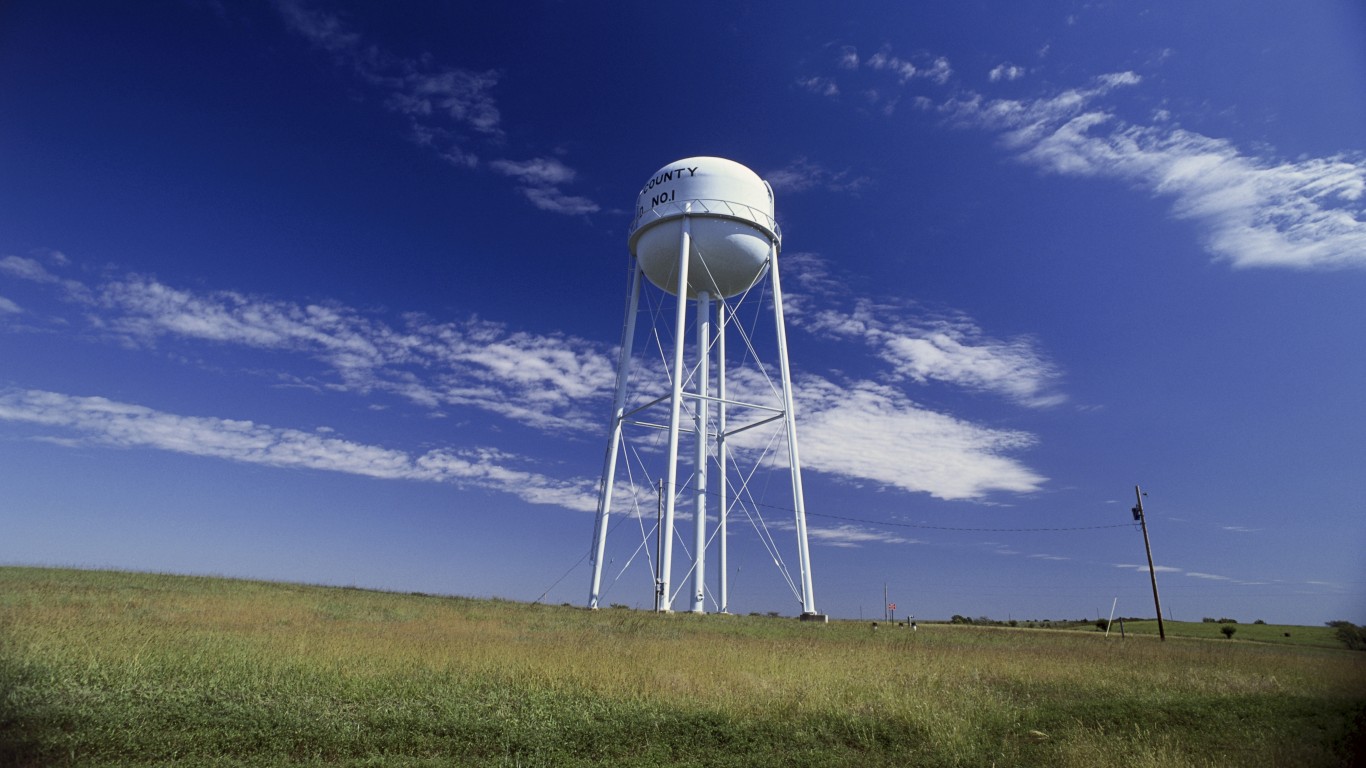
Kansas: Riley County
> Adults who exercise: 84.2% (Kansas: 76.1%)
> Pop. with access to places for physical activity: 90.1% (Kansas: 80.1%)
> Adult obesity rate: 25.9% (Kansas: 33.0%)
> Adults with diabetes: 5.3% (Kansas: 10.5%)
> Adults reporting poor or fair health: 16.1% (Kansas: 16.3%)
> Physically unhealthy days per month: 3.6 (Kansas: 3.6)
[in-text-ad]

Kentucky: Oldham County
> Adults who exercise: 80.7% (Kentucky: 71.3%)
> Pop. with access to places for physical activity: 94.0% (Kentucky: 71.1%)
> Adult obesity rate: 22.7% (Kentucky: 34.6%)
> Adults with diabetes: 7.8% (Kentucky: 12.7%)
> Adults reporting poor or fair health: 14.8% (Kentucky: 21.8%)
> Physically unhealthy days per month: 3.7 (Kentucky: 4.6)
Louisiana: East Carroll Parish
> Adults who exercise: 80.2% (Louisiana: 72.0%)
> Pop. with access to places for physical activity: 60.3% (Louisiana: 75.0%)
> Adult obesity rate: 47.1% (Louisiana: 36.3%)
> Adults with diabetes: 22.1% (Louisiana: 13.0%)
> Adults reporting poor or fair health: 40.5% (Louisiana: 21.4%)
> Physically unhealthy days per month: 6.7 (Louisiana: 4.3)

Maine: Cumberland County
> Adults who exercise: 84.9% (Maine: 79.2%)
> Pop. with access to places for physical activity: 83.8% (Maine: 70.0%)
> Adult obesity rate: 23.3% (Maine: 29.8%)
> Adults with diabetes: 8.3% (Maine: 10.4%)
> Adults reporting poor or fair health: 11.7% (Maine: 17.1%)
> Physically unhealthy days per month: 3.2 (Maine: 4.2)
[in-text-ad-2]

Maryland: Howard County
> Adults who exercise: 84.5% (Maryland: 78.1%)
> Pop. with access to places for physical activity: 96.5% (Maryland: 92.6%)
> Adult obesity rate: 26.0% (Maryland: 31.6%)
> Adults with diabetes: 7.7% (Maryland: 11.1%)
> Adults reporting poor or fair health: 11.1% (Maryland: 15.2%)
> Physically unhealthy days per month: 2.6 (Maryland: 3.4)
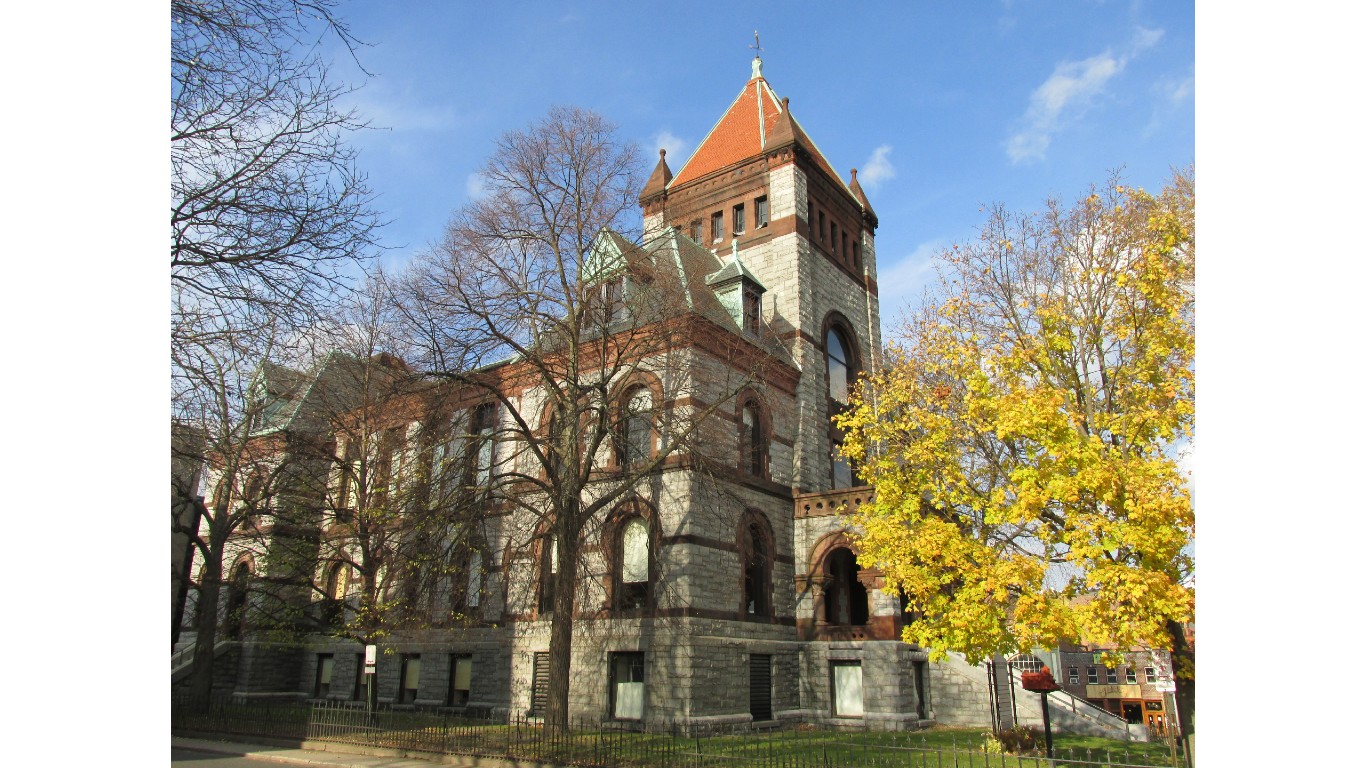
Massachusetts: Hampshire County
> Adults who exercise: 83.4% (Massachusetts: 80.0%)
> Pop. with access to places for physical activity: 85.1% (Massachusetts: 94.5%)
> Adult obesity rate: 21.4% (Massachusetts: 25.0%)
> Adults with diabetes: 6.9% (Massachusetts: 8.7%)
> Adults reporting poor or fair health: 13.6% (Massachusetts: 13.5%)
> Physically unhealthy days per month: 3.8 (Massachusetts: 3.5)
[in-text-ad]

Michigan: Washtenaw County
> Adults who exercise: 84.9% (Michigan: 76.9%)
> Pop. with access to places for physical activity: 90.2% (Michigan: 85.5%)
> Adult obesity rate: 25.5% (Michigan: 32.4%)
> Adults with diabetes: 7.5% (Michigan: 11.0%)
> Adults reporting poor or fair health: 14.4% (Michigan: 18.3%)
> Physically unhealthy days per month: 3.8 (Michigan: 4.3)

Minnesota: Carver County
> Adults who exercise: 84.2% (Minnesota: 80.4%)
> Pop. with access to places for physical activity: 96.4% (Minnesota: 86.9%)
> Adult obesity rate: 26.2% (Minnesota: 29.0%)
> Adults with diabetes: 8.2% (Minnesota: 8.5%)
> Adults reporting poor or fair health: 9.9% (Minnesota: 12.9%)
> Physically unhealthy days per month: 2.5 (Minnesota: 3.1)

Mississippi: Issaquena County
> Adults who exercise: 80.8% (Mississippi: 69.6%)
> Pop. with access to places for physical activity: 18.1% (Mississippi: 54.5%)
> Adult obesity rate: 21.7% (Mississippi: 39.1%)
> Adults with diabetes: 12.0% (Mississippi: 14.6%)
> Adults reporting poor or fair health: 37.4% (Mississippi: 22.1%)
> Physically unhealthy days per month: 6.3 (Mississippi: 4.5)
[in-text-ad-2]

Missouri: Atchison County
> Adults who exercise: 82.5% (Missouri: 74.5%)
> Pop. with access to places for physical activity: 76.5% (Missouri: 76.7%)
> Adult obesity rate: 37.0% (Missouri: 32.5%)
> Adults with diabetes: 15.7% (Missouri: 11.4%)
> Adults reporting poor or fair health: 18.2% (Missouri: 19.5%)
> Physically unhealthy days per month: 4.2 (Missouri: 4.2)
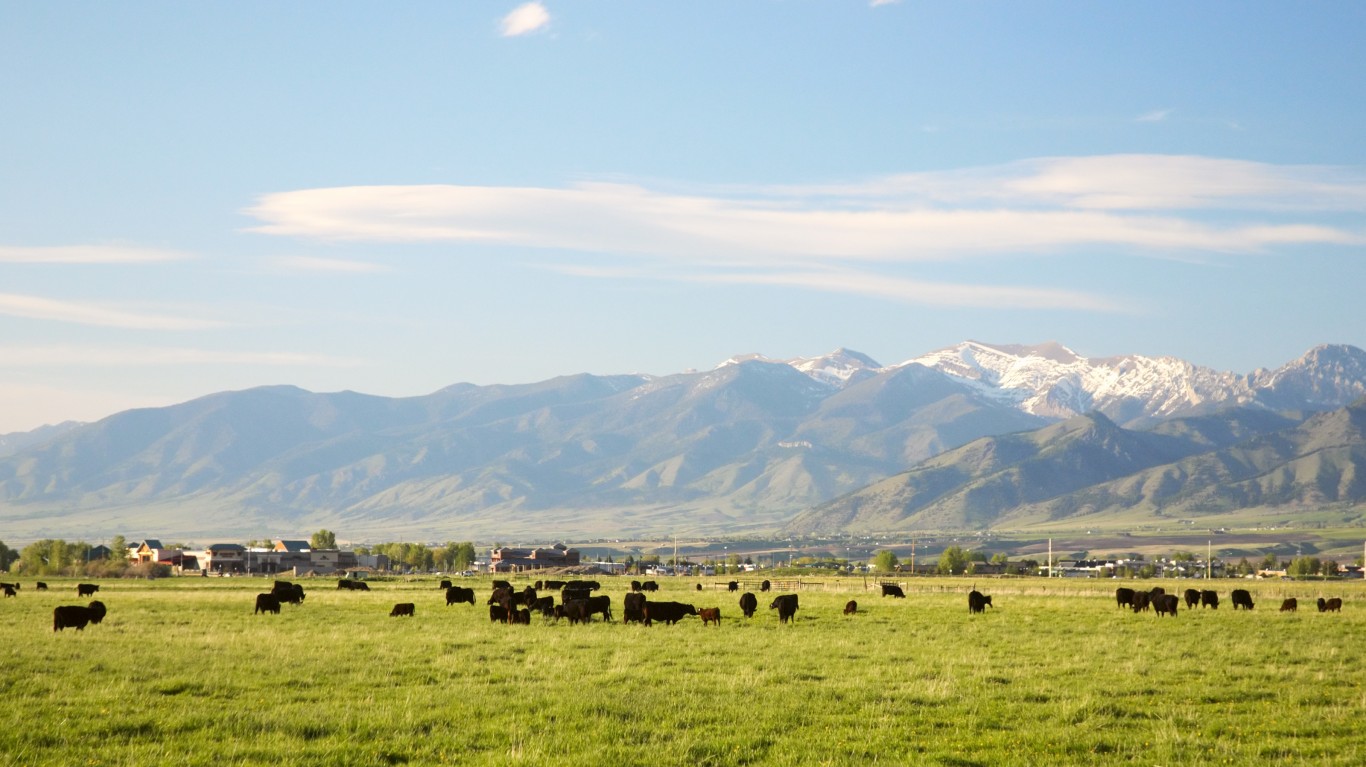
Montana: Gallatin County
> Adults who exercise: 87.2% (Montana: 78.3%)
> Pop. with access to places for physical activity: 81.8% (Montana: 75.2%)
> Adult obesity rate: 19.1% (Montana: 27.1%)
> Adults with diabetes: 5.1% (Montana: 8.9%)
> Adults reporting poor or fair health: 11.3% (Montana: 14.1%)
> Physically unhealthy days per month: 3.3 (Montana: 3.6)
[in-text-ad]
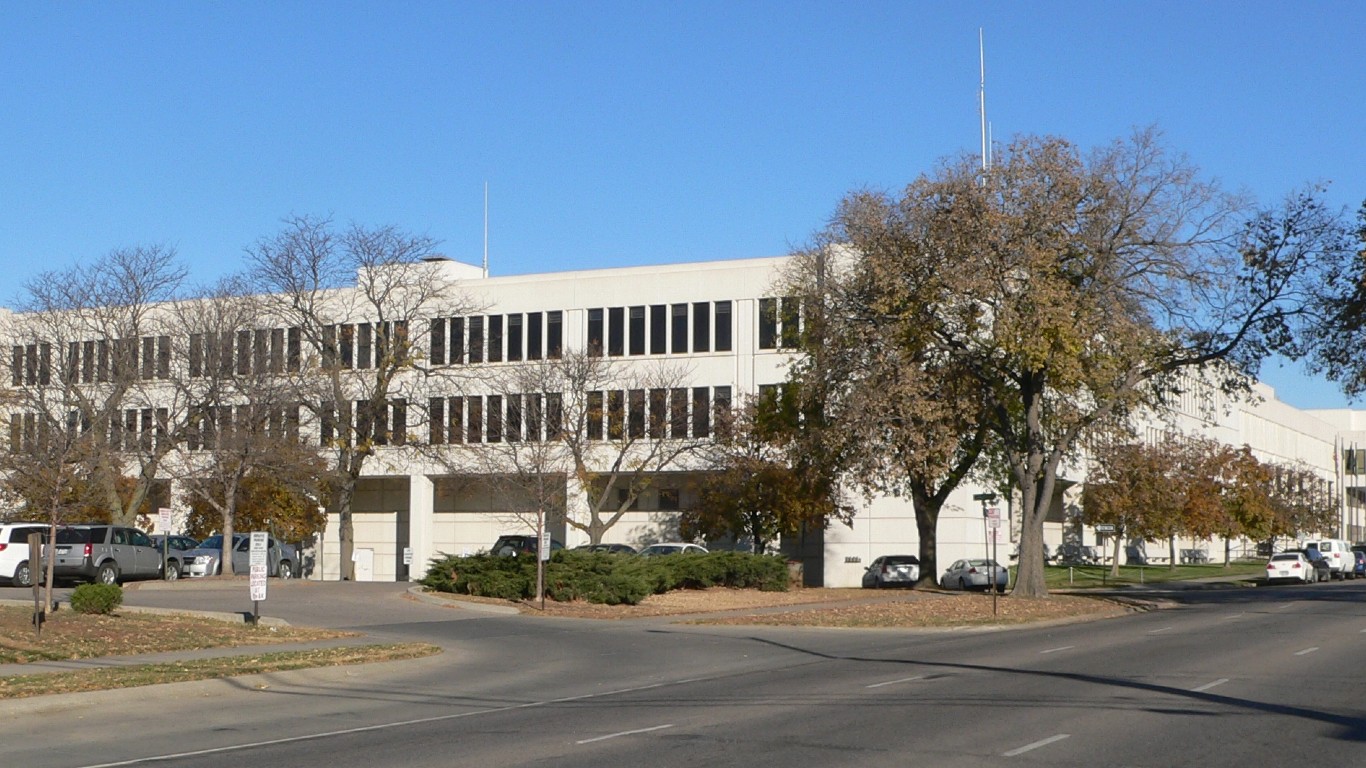
Nebraska: Lancaster County
> Adults who exercise: 82.7% (Nebraska: 77.3%)
> Pop. with access to places for physical activity: 96.9% (Nebraska: 83.5%)
> Adult obesity rate: 29.8% (Nebraska: 33.4%)
> Adults with diabetes: 8.2% (Nebraska: 10.0%)
> Adults reporting poor or fair health: 12.5% (Nebraska: 13.8%)
> Physically unhealthy days per month: 3.2 (Nebraska: 3.2)
Nevada: Washoe County
> Adults who exercise: 82.2% (Nevada: 77.5%)
> Pop. with access to places for physical activity: 91.6% (Nevada: 93.0%)
> Adult obesity rate: 23.7% (Nevada: 27.1%)
> Adults with diabetes: 7.9% (Nevada: 10.5%)
> Adults reporting poor or fair health: 18.1% (Nevada: 19.1%)
> Physically unhealthy days per month: 4.3 (Nevada: 4.2)

New Hampshire: Rockingham County
> Adults who exercise: 81.8% (New Hampshire: 79.2%)
> Pop. with access to places for physical activity: 88.4% (New Hampshire: 88.2%)
> Adult obesity rate: 27.2% (New Hampshire: 28.6%)
> Adults with diabetes: 8.9% (New Hampshire: 9.6%)
> Adults reporting poor or fair health: 11.5% (New Hampshire: 12.8%)
> Physically unhealthy days per month: 3.5 (New Hampshire: 3.5)
[in-text-ad-2]

New Jersey: Hunterdon County
> Adults who exercise: 81.7% (New Jersey: 73.4%)
> Pop. with access to places for physical activity: 89.0% (New Jersey: 94.7%)
> Adult obesity rate: 22.3% (New Jersey: 27.0%)
> Adults with diabetes: 7.4% (New Jersey: 9.9%)
> Adults reporting poor or fair health: 12.3% (New Jersey: 15.5%)
> Physically unhealthy days per month: 3.4 (New Jersey: 3.7)

New Mexico: Los Alamos County
> Adults who exercise: 88.9% (New Mexico: 81.0%)
> Pop. with access to places for physical activity: 99.2% (New Mexico: 76.9%)
> Adult obesity rate: 23.4% (New Mexico: 27.3%)
> Adults with diabetes: 6.8% (New Mexico: 9.5%)
> Adults reporting poor or fair health: 9.4% (New Mexico: 20.3%)
> Physically unhealthy days per month: 2.7 (New Mexico: 4.3)
[in-text-ad]
New York: Tompkins County
> Adults who exercise: 85.4% (New York: 76.6%)
> Pop. with access to places for physical activity: 86.2% (New York: 93.2%)
> Adult obesity rate: 23.0% (New York: 26.4%)
> Adults with diabetes: 6.5% (New York: 10.1%)
> Adults reporting poor or fair health: 13.5% (New York: 16.3%)
> Physically unhealthy days per month: 3.5 (New York: 3.6)
North Carolina: Wake County
> Adults who exercise: 84.6% (North Carolina: 76.7%)
> Pop. with access to places for physical activity: 90.1% (North Carolina: 73.5%)
> Adult obesity rate: 27.6% (North Carolina: 32.3%)
> Adults with diabetes: 8.6% (North Carolina: 11.5%)
> Adults reporting poor or fair health: 13.6% (North Carolina: 18.0%)
> Physically unhealthy days per month: 3.2 (North Carolina: 3.6)
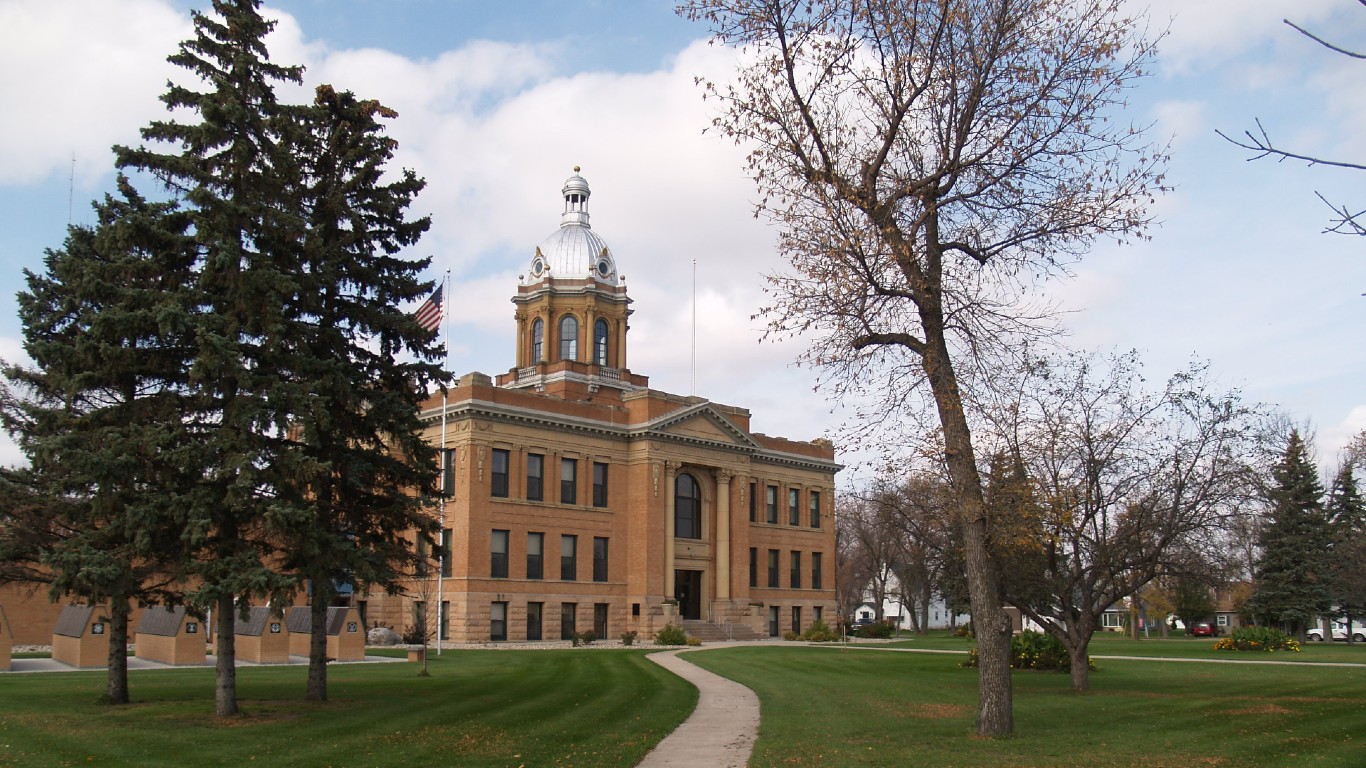
North Dakota: Traill County
> Adults who exercise: 81.4% (North Dakota: 76.9%)
> Pop. with access to places for physical activity: 65.3% (North Dakota: 74.0%)
> Adult obesity rate: 39.2% (North Dakota: 33.9%)
> Adults with diabetes: 13.5% (North Dakota: 9.4%)
> Adults reporting poor or fair health: 13.7% (North Dakota: 13.6%)
> Physically unhealthy days per month: 3 (North Dakota: 3.2)
[in-text-ad-2]
Ohio: Geauga County
> Adults who exercise: 82.9% (Ohio: 73.9%)
> Pop. with access to places for physical activity: 81.3% (Ohio: 83.9%)
> Adult obesity rate: 25.7% (Ohio: 33.5%)
> Adults with diabetes: 10.1% (Ohio: 12.2%)
> Adults reporting poor or fair health: 14.7% (Ohio: 17.8%)
> Physically unhealthy days per month: 3.7 (Ohio: 4.1)
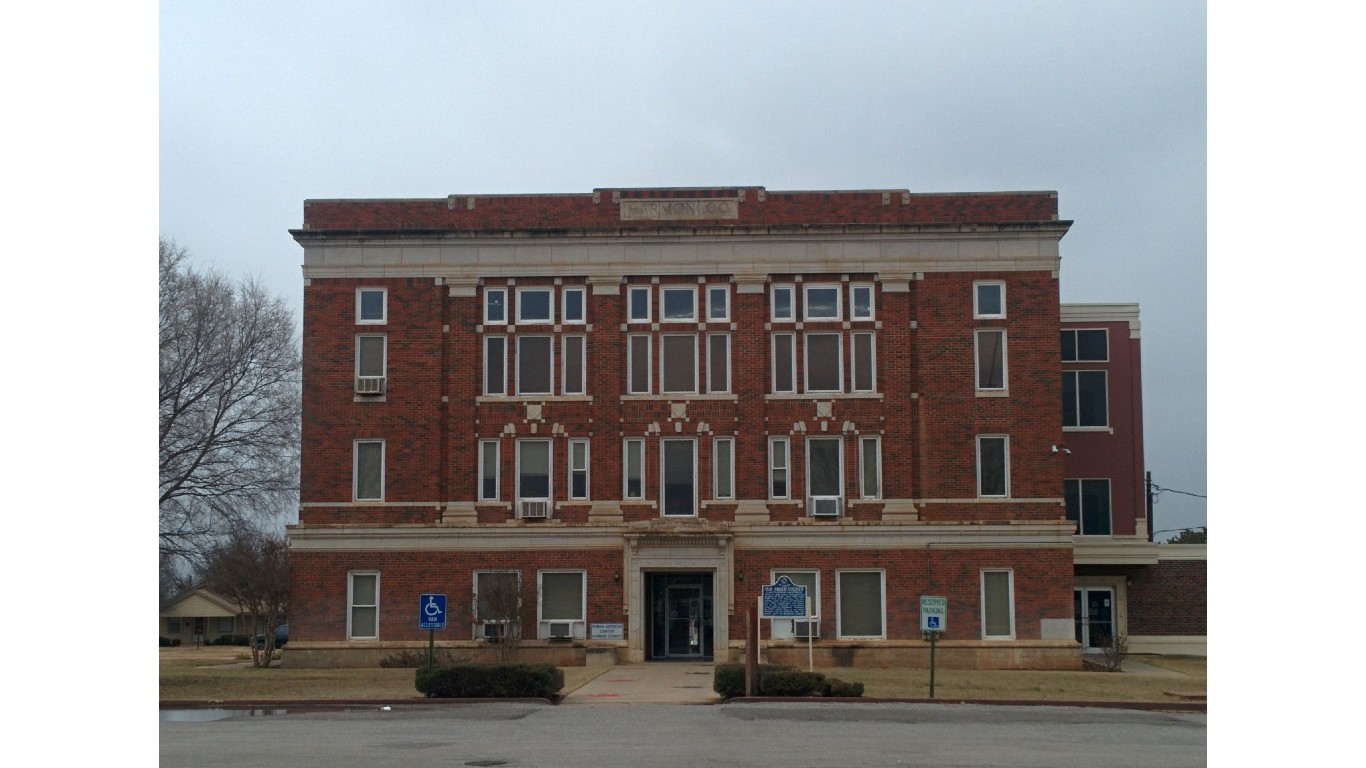
Oklahoma: Harmon County
> Adults who exercise: 81.8% (Oklahoma: 72.2%)
> Pop. with access to places for physical activity: 79.2% (Oklahoma: 71.3%)
> Adult obesity rate: 26.6% (Oklahoma: 34.5%)
> Adults with diabetes: 13.5% (Oklahoma: 12.3%)
> Adults reporting poor or fair health: 24.5% (Oklahoma: 20.9%)
> Physically unhealthy days per month: 4.9 (Oklahoma: 4.5)
[in-text-ad]

Oregon: Benton County
> Adults who exercise: 86.1% (Oregon: 82.7%)
> Pop. with access to places for physical activity: 90.3% (Oregon: 87.9%)
> Adult obesity rate: 21.6% (Oregon: 29.3%)
> Adults with diabetes: 5.7% (Oregon: 9.7%)
> Adults reporting poor or fair health: 16.1% (Oregon: 18.2%)
> Physically unhealthy days per month: 4.1 (Oregon: 4.7)

Pennsylvania: Chester County
> Adults who exercise: 85.9% (Pennsylvania: 78.0%)
> Pop. with access to places for physical activity: 85.5% (Pennsylvania: 84.4%)
> Adult obesity rate: 22.1% (Pennsylvania: 30.8%)
> Adults with diabetes: 8.9% (Pennsylvania: 11.0%)
> Adults reporting poor or fair health: 12.9% (Pennsylvania: 17.6%)
> Physically unhealthy days per month: 3.1 (Pennsylvania: 4)

Rhode Island: Washington County
> Adults who exercise: 81.3% (Rhode Island: 76.5%)
> Pop. with access to places for physical activity: 92.2% (Rhode Island: 94.9%)
> Adult obesity rate: 25.5% (Rhode Island: 28.5%)
> Adults with diabetes: 8.7% (Rhode Island: 10.1%)
> Adults reporting poor or fair health: 13.2% (Rhode Island: 16.5%)
> Physically unhealthy days per month: 3.8 (Rhode Island: 3.9)
[in-text-ad-2]

South Carolina: Beaufort County
> Adults who exercise: 83.0% (South Carolina: 74.0%)
> Pop. with access to places for physical activity: 83.1% (South Carolina: 68.3%)
> Adult obesity rate: 25.0% (South Carolina: 34.0%)
> Adults with diabetes: 8.3% (South Carolina: 13.3%)
> Adults reporting poor or fair health: 14.4% (South Carolina: 17.8%)
> Physically unhealthy days per month: 3.6 (South Carolina: 4)

South Dakota: Brookings County
> Adults who exercise: 83.9% (South Dakota: 78.0%)
> Pop. with access to places for physical activity: 83.8% (South Dakota: 73.5%)
> Adult obesity rate: 29.9% (South Dakota: 32.4%)
> Adults with diabetes: 7.5% (South Dakota: 10.1%)
> Adults reporting poor or fair health: 12.0% (South Dakota: 13.4%)
> Physically unhealthy days per month: 2.9 (South Dakota: 3)
[in-text-ad]
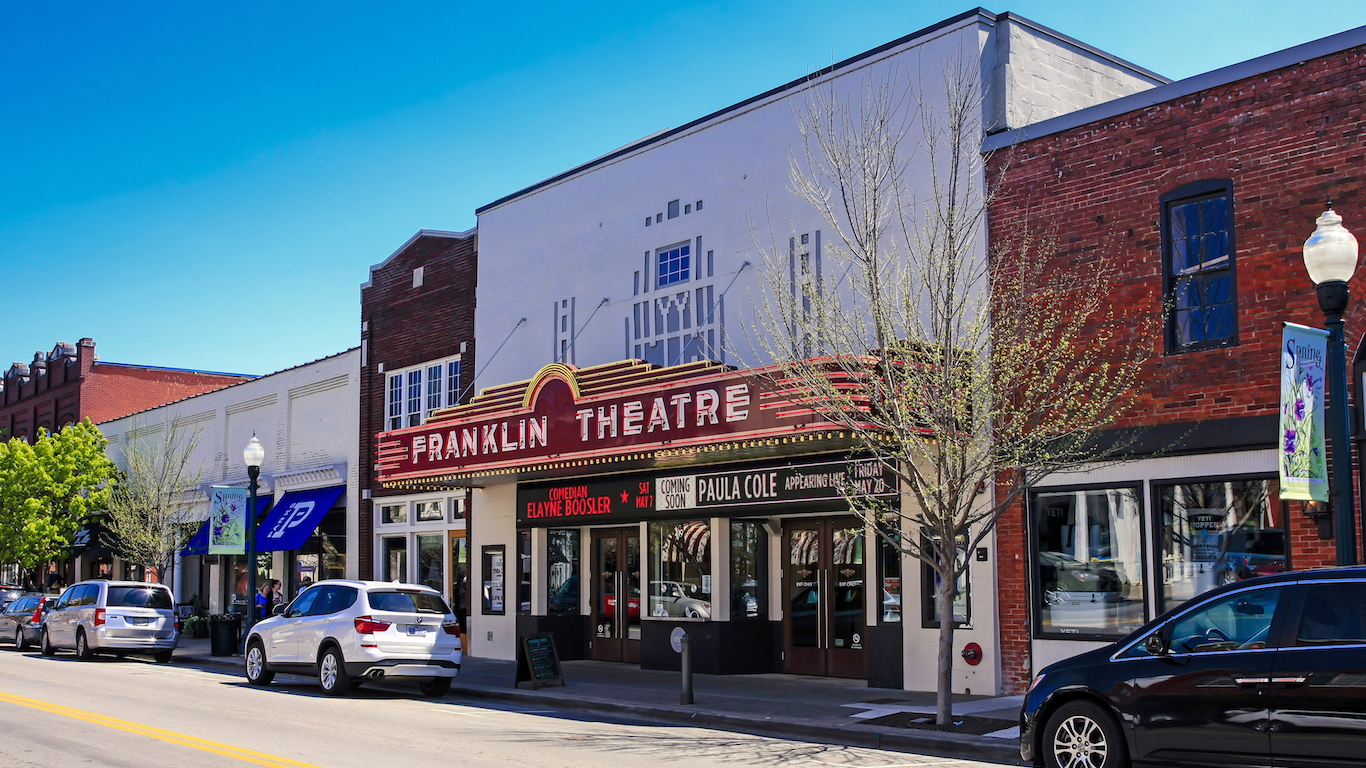
Tennessee: Williamson County
> Adults who exercise: 82.4% (Tennessee: 72.8%)
> Pop. with access to places for physical activity: 80.4% (Tennessee: 70.2%)
> Adult obesity rate: 22.5% (Tennessee: 33.3%)
> Adults with diabetes: 7.8% (Tennessee: 12.5%)
> Adults reporting poor or fair health: 12.2% (Tennessee: 21.2%)
> Physically unhealthy days per month: 3.3 (Tennessee: 4.7)
Texas: Travis County
> Adults who exercise: 84.6% (Texas: 76.8%)
> Pop. with access to places for physical activity: 93.2% (Texas: 80.5%)
> Adult obesity rate: 22.9% (Texas: 31.4%)
> Adults with diabetes: 7.0% (Texas: 10.2%)
> Adults reporting poor or fair health: 16.2% (Texas: 18.7%)
> Physically unhealthy days per month: 3.5 (Texas: 3.8)

Utah: Summit County
> Adults who exercise: 87.8% (Utah: 83.3%)
> Pop. with access to places for physical activity: 95.3% (Utah: 85.7%)
> Adult obesity rate: 14.5% (Utah: 27.0%)
> Adults with diabetes: 4.8% (Utah: 7.5%)
> Adults reporting poor or fair health: 10.9% (Utah: 14.8%)
> Physically unhealthy days per month: 2.9 (Utah: 3.5)
[in-text-ad-2]

Vermont: Chittenden County
> Adults who exercise: 86.4% (Vermont: 81.6%)
> Pop. with access to places for physical activity: 87.5% (Vermont: 75.8%)
> Adult obesity rate: 22.4% (Vermont: 27.0%)
> Adults with diabetes: 6.7% (Vermont: 8.8%)
> Adults reporting poor or fair health: 11.2% (Vermont: 12.8%)
> Physically unhealthy days per month: 3.7 (Vermont: 3.7)

Virginia: Arlington County
> Adults who exercise: 87.8% (Virginia: 77.8%)
> Pop. with access to places for physical activity: 100.0% (Virginia: 82.4%)
> Adult obesity rate: 18.6% (Virginia: 30.5%)
> Adults with diabetes: 5.1% (Virginia: 10.7%)
> Adults reporting poor or fair health: 11.2% (Virginia: 16.6%)
> Physically unhealthy days per month: 2.8 (Virginia: 3.5)
[in-text-ad]
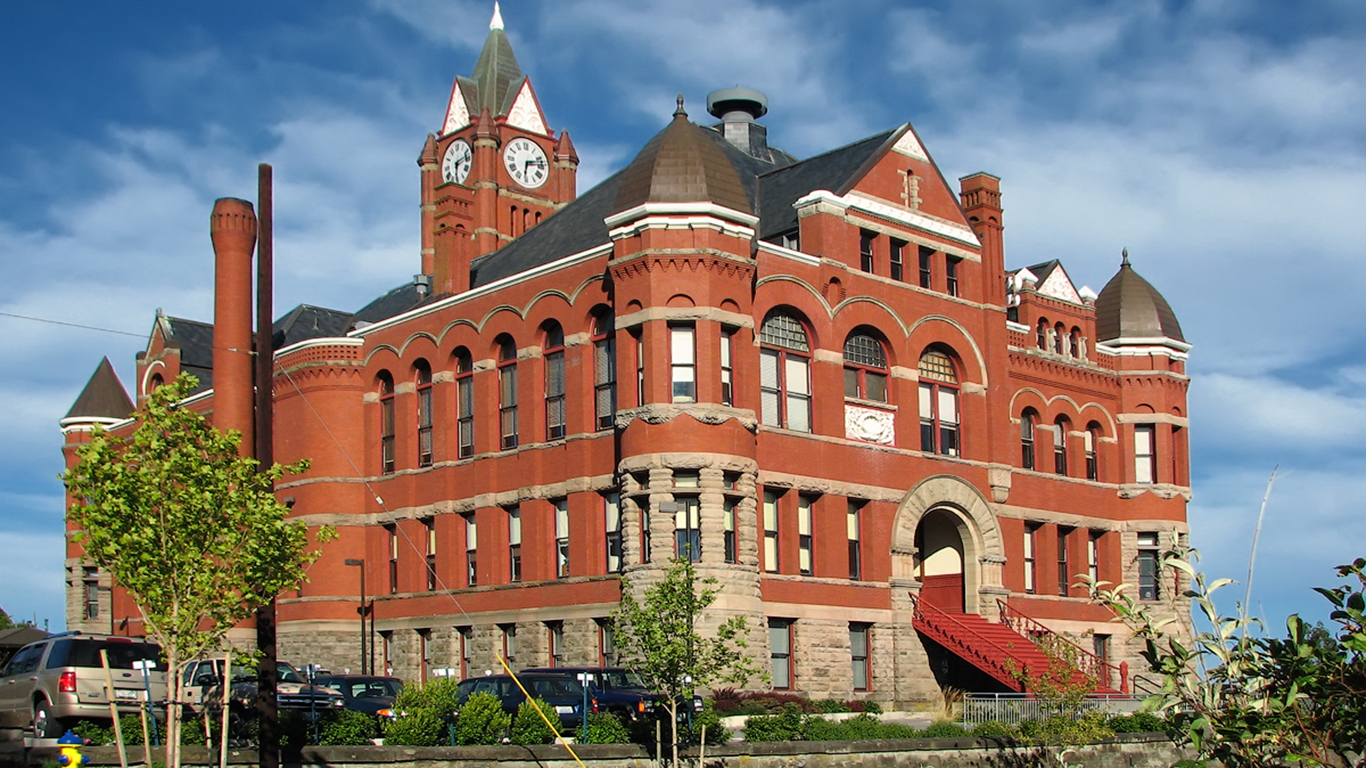
Washington: Jefferson County
> Adults who exercise: 88.5% (Washington: 83.6%)
> Pop. with access to places for physical activity: 85.1% (Washington: 86.2%)
> Adult obesity rate: 21.3% (Washington: 28.6%)
> Adults with diabetes: 7.9% (Washington: 9.3%)
> Adults reporting poor or fair health: 14.5% (Washington: 15.0%)
> Physically unhealthy days per month: 3.8 (Washington: 3.7)
West Virginia: Monongalia County
> Adults who exercise: 80.9% (West Virginia: 72.0%)
> Pop. with access to places for physical activity: 81.7% (West Virginia: 59.4%)
> Adult obesity rate: 30.2% (West Virginia: 37.8%)
> Adults with diabetes: 9.3% (West Virginia: 15.1%)
> Adults reporting poor or fair health: 19.9% (West Virginia: 23.6%)
> Physically unhealthy days per month: 4.6 (West Virginia: 5.3)
Wisconsin: Dane County
> Adults who exercise: 86.3% (Wisconsin: 79.7%)
> Pop. with access to places for physical activity: 94.1% (Wisconsin: 85.2%)
> Adult obesity rate: 23.2% (Wisconsin: 31.7%)
> Adults with diabetes: 5.8% (Wisconsin: 9.5%)
> Adults reporting poor or fair health: 12.1% (Wisconsin: 14.8%)
> Physically unhealthy days per month: 3.3 (Wisconsin: 3.7)
[in-text-ad-2]

Wyoming: Teton County
> Adults who exercise: 89.2% (Wyoming: 76.9%)
> Pop. with access to places for physical activity: 99.7% (Wyoming: 76.5%)
> Adult obesity rate: 11.0% (Wyoming: 29.2%)
> Adults with diabetes: 2.4% (Wyoming: 9.0%)
> Adults reporting poor or fair health: 11.4% (Wyoming: 15.3%)
> Physically unhealthy days per month: 2.9 (Wyoming: 3.5)
Methodology
To determine the most active county in every state, 24/7 Tempo reviewed adult physical inactivity rates from the Robert Wood Johnson Foundation and the University of Wisconsin Population Health Institute joint program’s 2021 County Health Rankings & Roadmaps report.
The physical inactivity rate is defined as the share of adults 20 years and older who report no leisure-time physical activity. While the CHR report is from 2021, physical inactivity figures published in the report are from 2017.
Of the 3,220 counties or county equivalents, 3,141 had boundaries that fell within one of the 50 states, while the rest were in the District of Columbia or Puerto Rico.
Counties with a 2019 five-year population estimate from the U.S. Census Bureau of less than 1,000 were excluded.
The remaining 3,105 places were ranked within their state based on the adult physical inactivity rate. Additional information on the share of the population with adequate access to locations for physical activity, the share of adults 20 years and older who report a body mass index of 30 kg/m2 or higher (adult obesity rate), the share of adults 20 years and older with diagnosed diabetes, the share of adults reporting poor or fair health, and the average number of physically unhealthy days reported in the past 30 days also came from the 2021 CHR.
Is Your Money Earning the Best Possible Rate? (Sponsor)
Let’s face it: If your money is just sitting in a checking account, you’re losing value every single day. With most checking accounts offering little to no interest, the cash you worked so hard to save is gradually being eroded by inflation.
However, by moving that money into a high-yield savings account, you can put your cash to work, growing steadily with little to no effort on your part. In just a few clicks, you can set up a high-yield savings account and start earning interest immediately.
There are plenty of reputable banks and online platforms that offer competitive rates, and many of them come with zero fees and no minimum balance requirements. Click here to see if you’re earning the best possible rate on your money!
Thank you for reading! Have some feedback for us?
Contact the 24/7 Wall St. editorial team.
 24/7 Wall St.
 24/7 Wall St.
 24/7 Wall St.


 24/7 Wall St.
