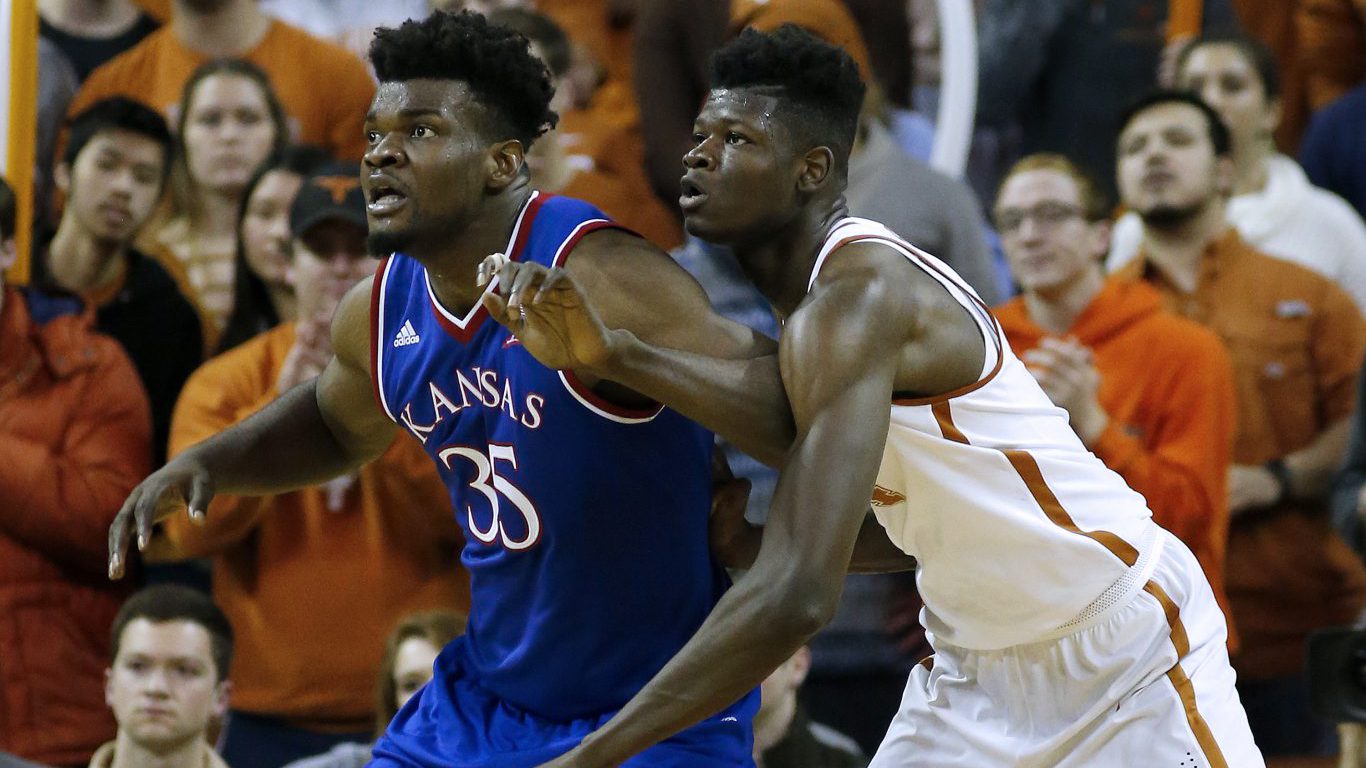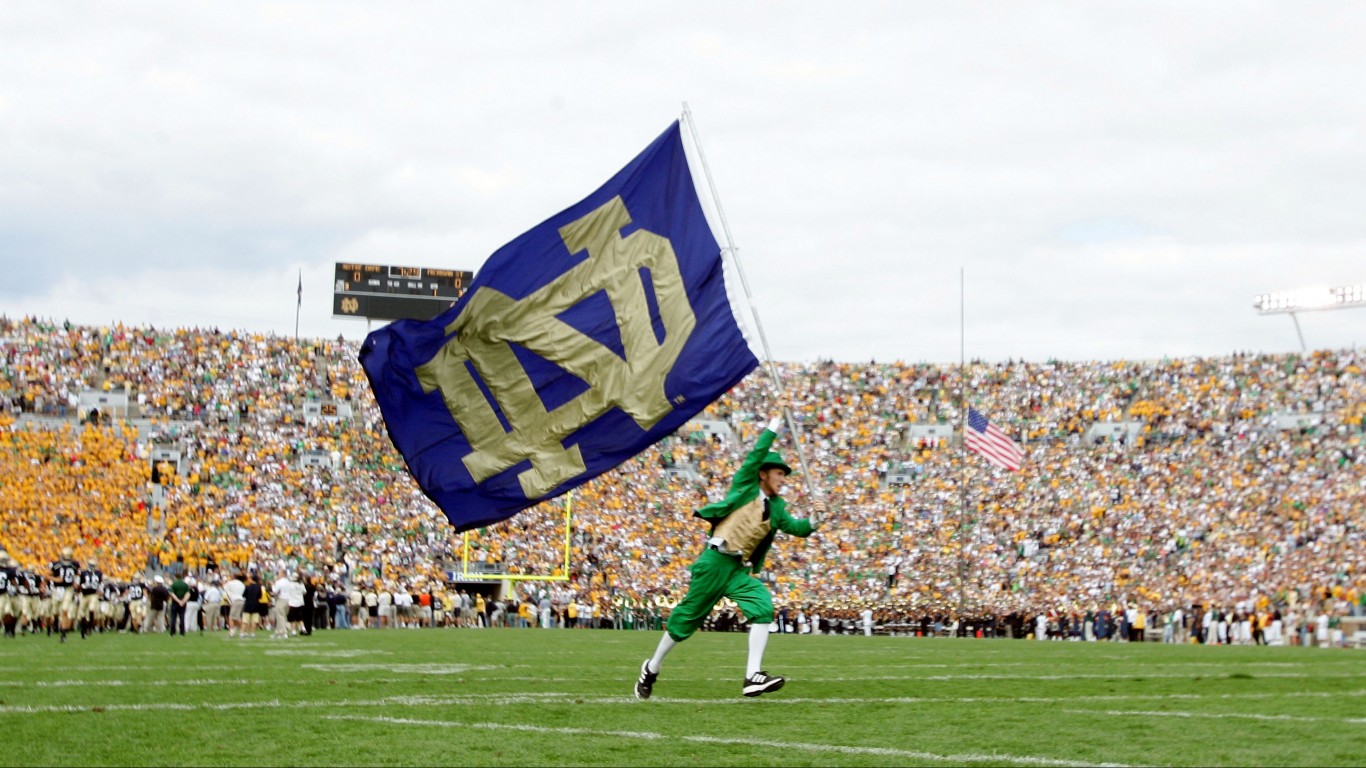
After an odd year of empty stadiums, college football is back to its best, with fans able to return to cheer on their teams. While this is great for fans, it is also beneficial for the teams because ticket sales make up over a quarter of their revenue in a given year.
The college football landscape has shifted recently. Athletes are now able to profit from their name, image, and likeness, meaning they can sign endorsement deals, sell shirts, or otherwise make money from their status as college football players. This is a big deal because college football is a big business, with some of the largest programs averaging over $100 million per year in revenue.
To determine the most valuable college football teams worth, 24/7 Tempo reviewed Forbes’ list of College Football’s Most Valuable Teams. The data is from 2019 as the 2020 season was an aberration due to the COVID-19 pandemic. Additional information about all-time records and championships came from Sports Reference.
The teams with the highest revenues are the traditionally dominant programs of college football. With the exception of the independent Notre Dame, each of the 25 most valuable programs plays in the so-called Power 5 conferences. The Southeastern Conference, the most successful conference of the 21st century, leads the way with 10 of the 25 most valuable teams. That is followed by the Big Ten with seven teams, the Pac-12 with three, and the ACC and Big 12 with two apiece.
The most valuable teams have set themselves apart as the most successful programs in the history of college football, racking up dozens of national championships and sending hundreds of players to the NFL. These are the colleges that produce the best NFL players.
Click here to see the most valuable college football teams

25. Clemson
> Avg. annual revenue (2015-2017): $77 million
> Avg. annual profit (2015-2017): $27 million
> Conference: ACC
> National championships claimed: 3
> All-time record: 751-457-44
[in-text-ad]
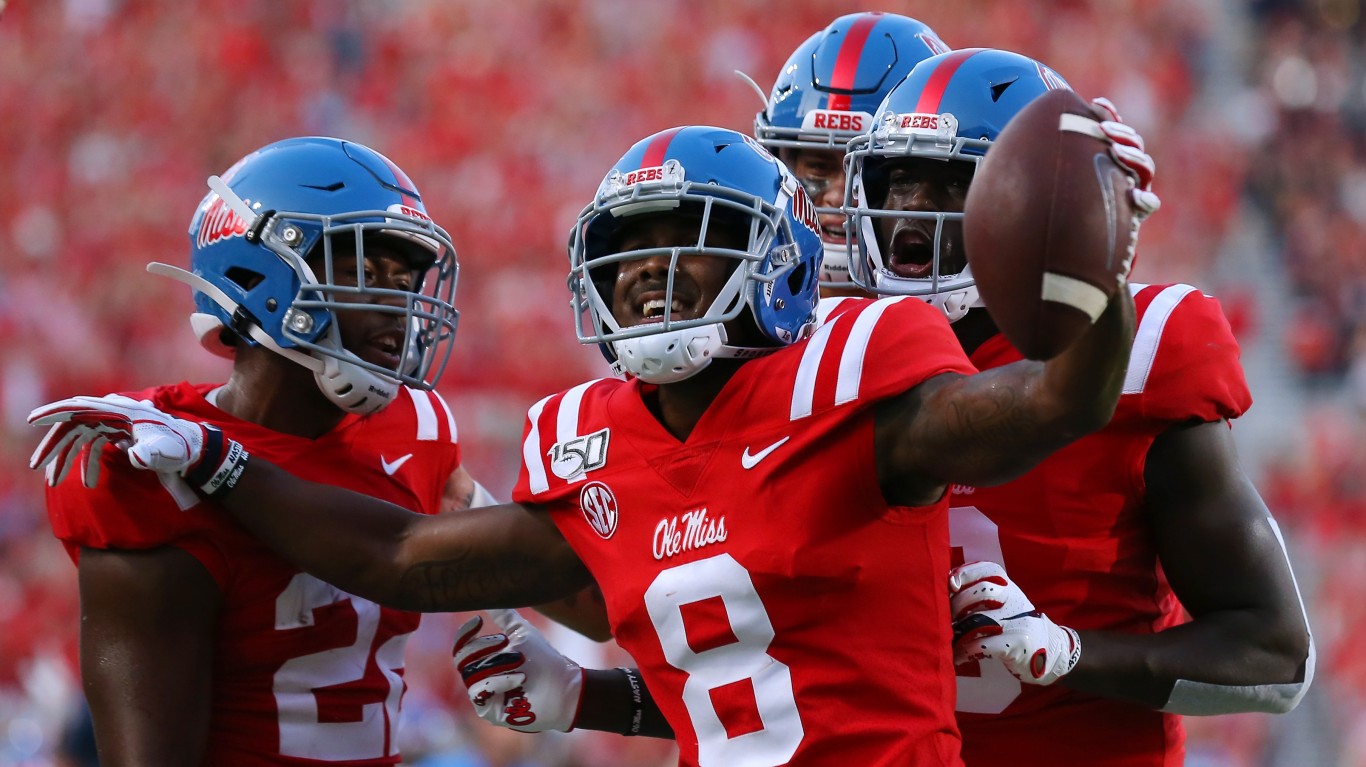
24. Mississippi
> Avg. annual revenue (2015-2017): $84 million
> Avg. annual profit (2015-2017): $43 million
> Conference: SEC
> National championships claimed: 1
> All-time record: 654-519-34

23. Wisconsin
> Avg. annual revenue (2015-2017): $86 million
> Avg. annual profit (2015-2017): $48 million
> Conference: Big Ten
> National championships claimed: 0
> All-time record: 716-500-52

22. Michigan State
> Avg. annual revenue (2015-2017): $87 million
> Avg. annual profit (2015-2017): $44 million
> Conference: Big Ten
> National championships claimed: 3
> All-time record: 593-388-30
[in-text-ad-2]

21. Iowa
> Avg. annual revenue (2015-2017): $89 million
> Avg. annual profit (2015-2017): $44 million
> Conference: Big Ten
> National championships claimed: 1
> All-time record: 642-534-34

20. Nebraska
> Avg. annual revenue (2015-2017): $91 million
> Avg. annual profit (2015-2017): $46 million
> Conference: Big Ten
> National championships claimed: 5
> All-time record: 873-379-38
[in-text-ad]

19. Washington
> Avg. annual revenue (2015-2017): $92 million
> Avg. annual profit (2015-2017): $43 million
> Conference: Pac-12
> National championships claimed: 1
> All-time record: 642-430-32
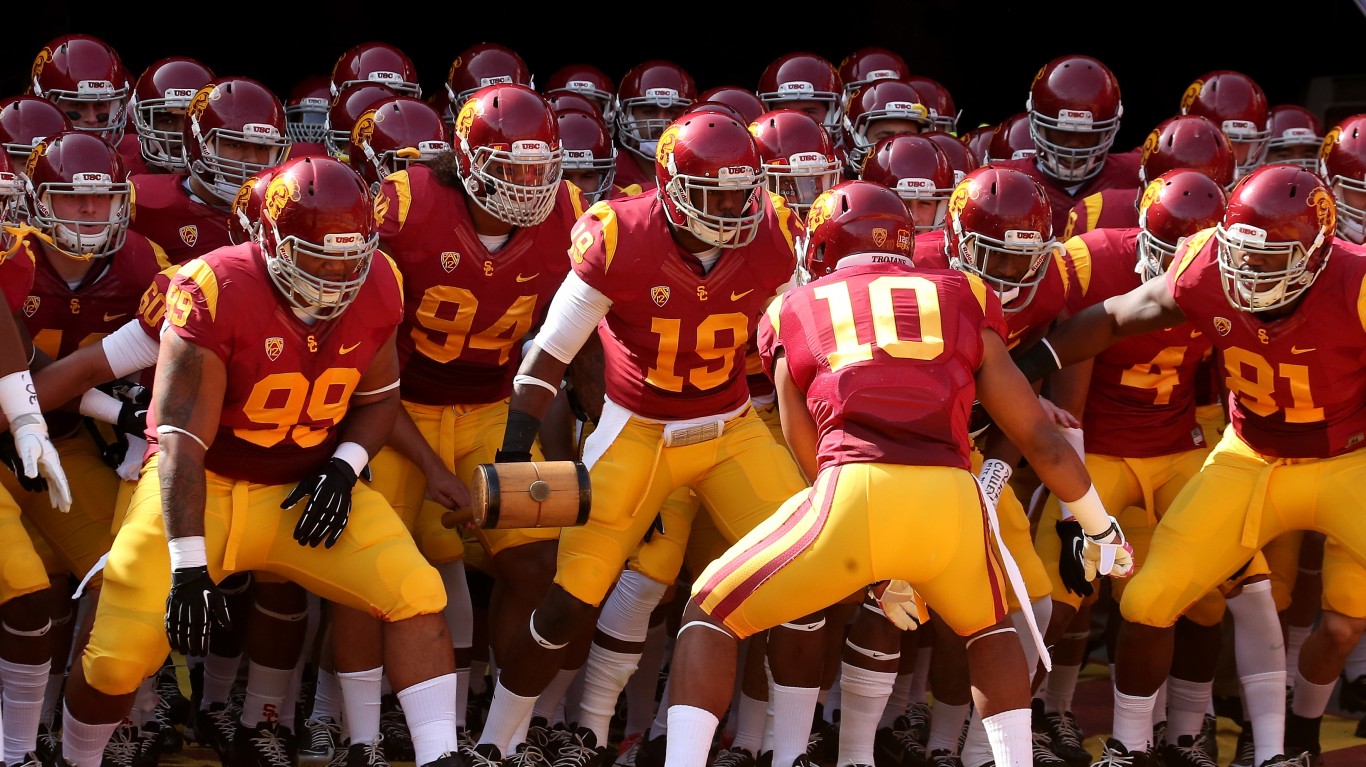
18. USC
> Avg. annual revenue (2015-2017): $93 million
> Avg. annual profit (2015-2017): $52 million
> Conference: Pac-12
> National championships claimed: 9
> All-time record: 771-314-40

16. Arkansas (tie)
> Avg. annual revenue (2015-2017): $95 million
> Avg. annual profit (2015-2017): $53 million
> Conference: SEC
> National championships claimed: 1
> All-time record: 690-500-37
[in-text-ad-2]

16. South Carolina (tie)
> Avg. annual revenue (2015-2017): $95 million
> Avg. annual profit (2015-2017): $53 million
> Conference: SEC
> National championships claimed: 0
> All-time record: 584-565-41

15. Florida State
> Avg. annual revenue (2015-2017): $96 million
> Avg. annual profit (2015-2017): $40 million
> Conference: ACC
> National championships claimed: 2
> All-time record: 530-253-16
[in-text-ad]

14. Oregon
> Avg. annual revenue (2015-2017): $96 million
> Avg. annual profit (2015-2017): $56 million
> Conference: Pac-12
> National championships claimed: 0
> All-time record: 599-461-34
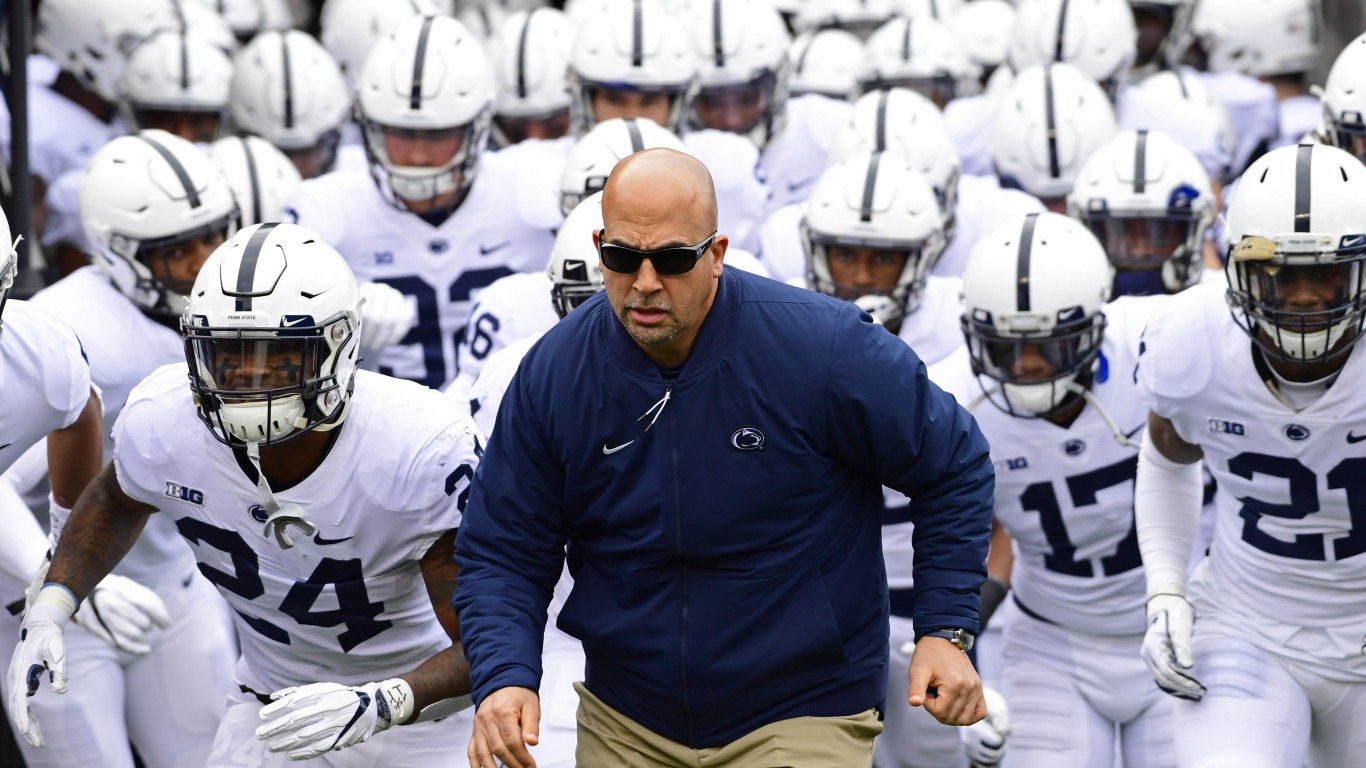
13. Penn State
> Avg. annual revenue (2015-2017): $104 million
> Avg. annual profit (2015-2017): $54 million
> Conference: Big Ten
> National championships claimed: 4
> All-time record: 885-391-37

12. Tennessee
> Avg. annual revenue (2015-2017): $113 million
> Avg. annual profit (2015-2017): $59 million
> Conference: SEC
> National championships claimed: 2
> All-time record: 828-386-51
[in-text-ad-2]

11. LSU
> Avg. annual revenue (2015-2017): $114 million
> Avg. annual profit (2015-2017): $73 million
> Conference: SEC
> National championships claimed: 5
> All-time record: 790-410-47
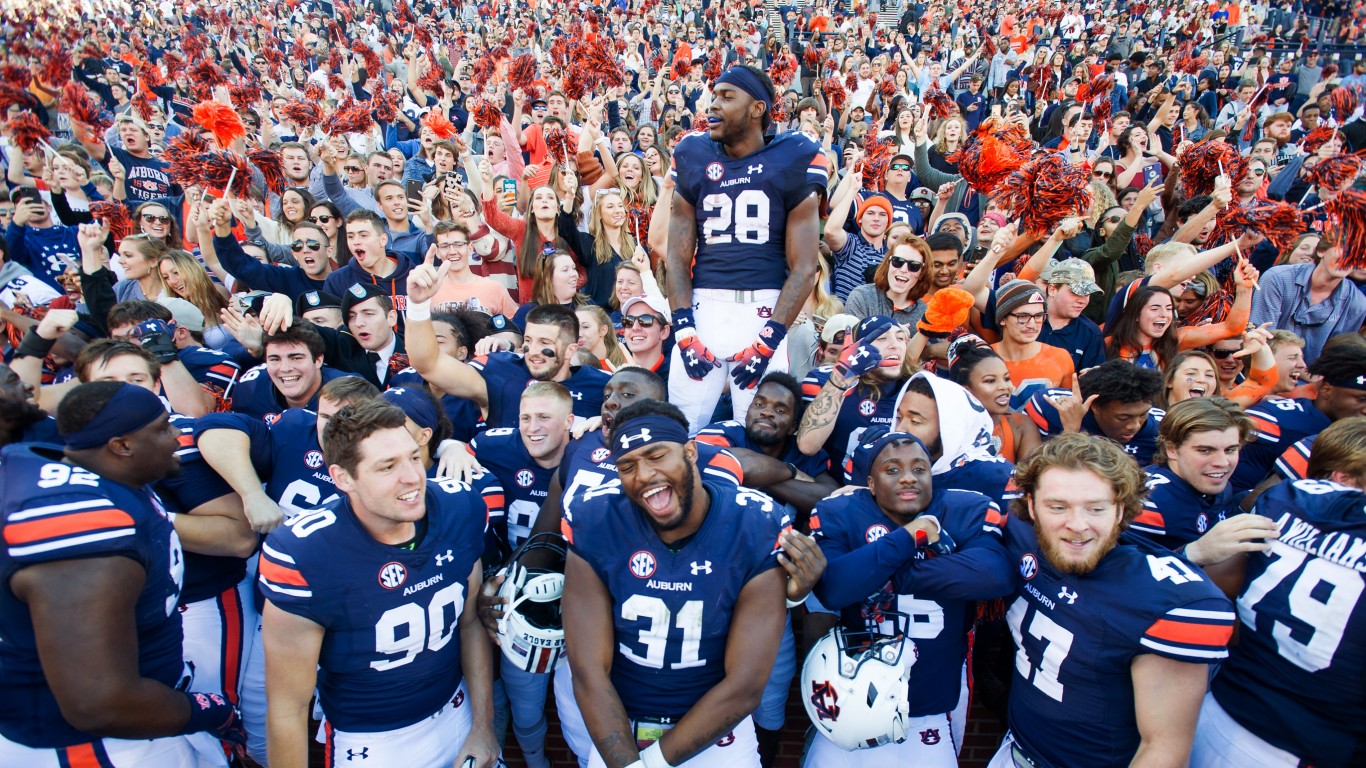
10. Auburn
> Avg. annual revenue (2015-2017): $117 million
> Avg. annual profit (2015-2017): $65 million
> Conference: SEC
> National championships claimed: 2
> All-time record: 760-442-43
[in-text-ad]

9. Florida
> Avg. annual revenue (2015-2017): $117 million
> Avg. annual profit (2015-2017): $69 million
> Conference: SEC
> National championships claimed: 3
> All-time record: 720-417-37

8. Notre Dame
> Avg. annual revenue (2015-2017): $120 million
> Avg. annual profit (2015-2017): $76 million
> Conference: Independent
> National championships claimed: 13
> All-time record: 867-315-33

7. Georgia
> Avg. annual revenue (2015-2017): $125 million
> Avg. annual profit (2015-2017): $74 million
> Conference: SEC
> National championships claimed: 1
> All-time record: 819-404-50
[in-text-ad-2]

6. Oklahoma
> Avg. annual revenue (2015-2017): $129 million
> Avg. annual profit (2015-2017): $81 million
> Conference: Big 12
> National championships claimed: 7
> All-time record: 870-309-47

5. Ohio State
> Avg. annual revenue (2015-2017): $132 million
> Avg. annual profit (2015-2017): $75 million
> Conference: Big Ten
> National championships claimed: 8
> All-time record: 828-261-36
[in-text-ad]
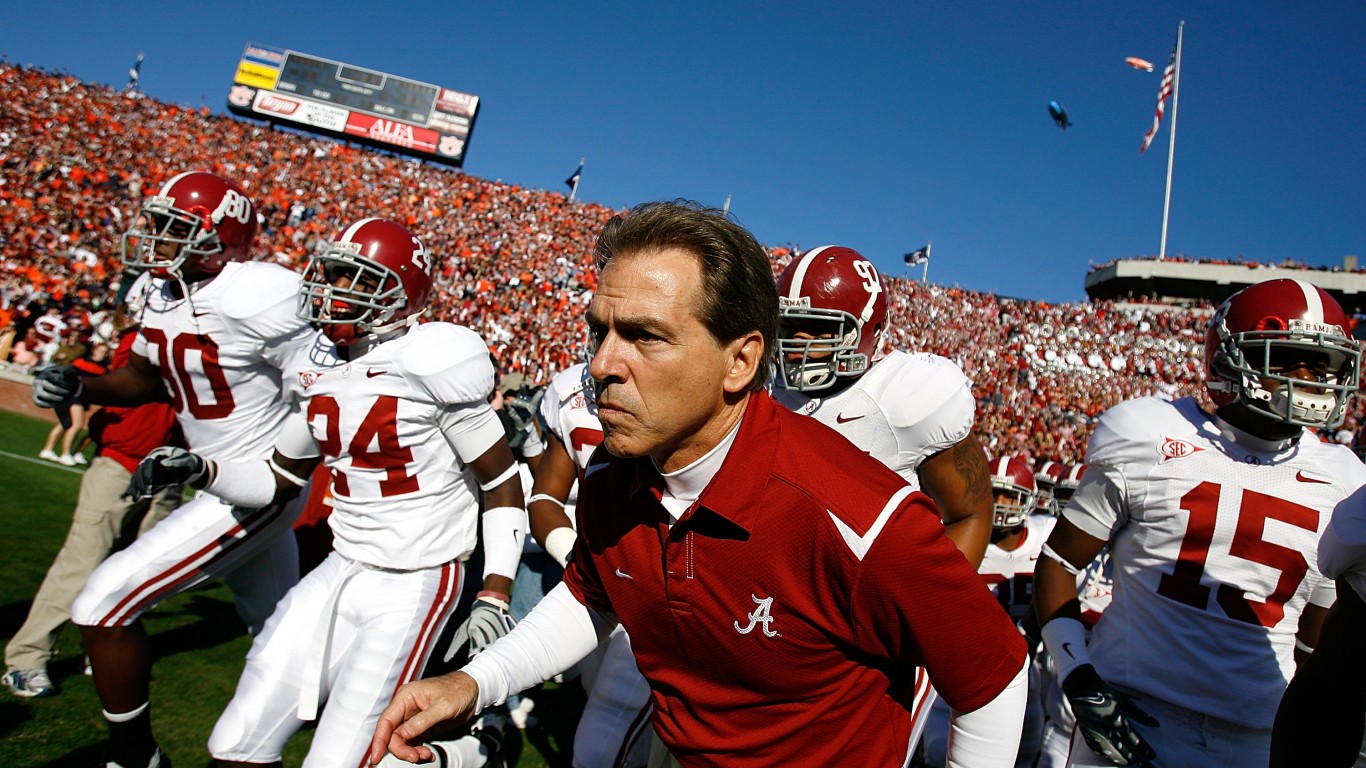
4. Alabama
> Avg. annual revenue (2015-2017): $134 million
> Avg. annual profit (2015-2017): $61 million
> Conference: SEC
> National championships claimed: 15
> All-time record: 948-306-42
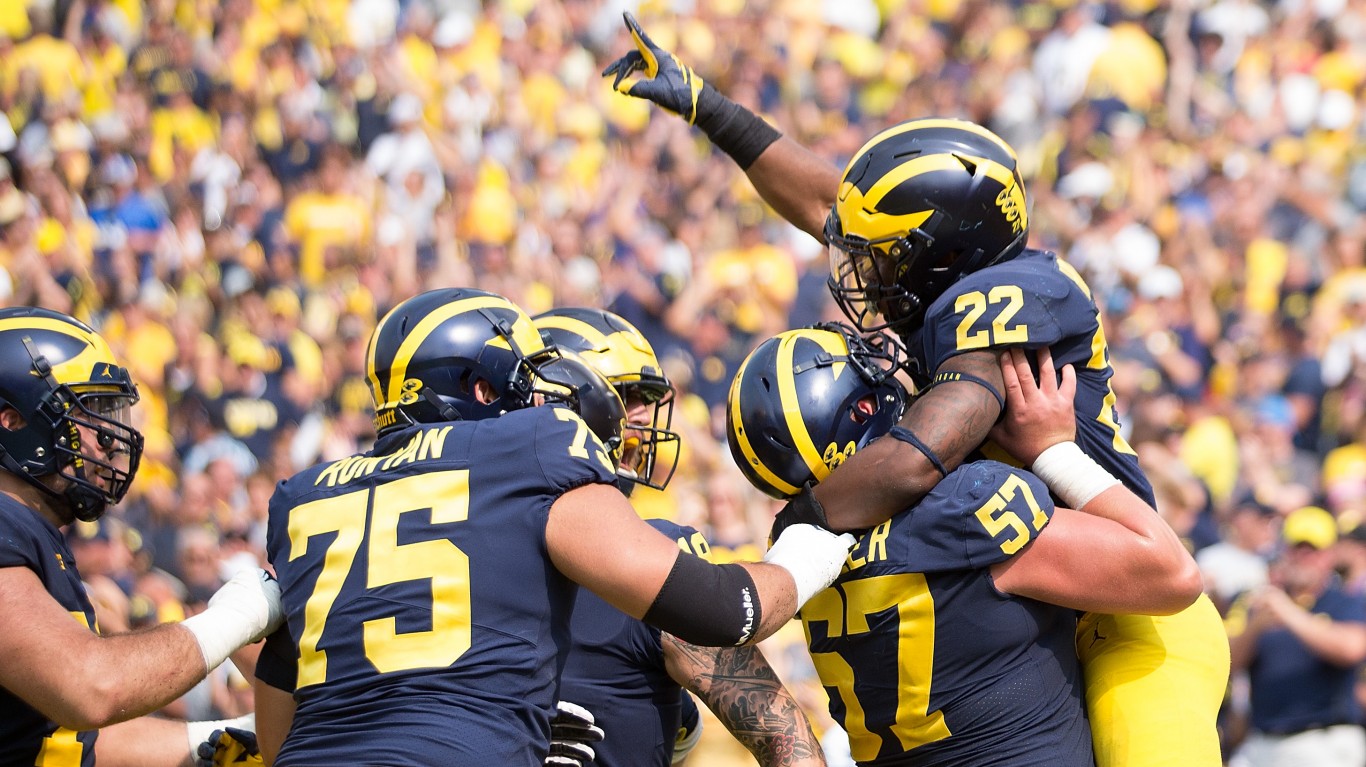
3. Michigan
> Avg. annual revenue (2015-2017): $139 million
> Avg. annual profit (2015-2017): $83 million
> Conference: Big Ten
> National championships claimed: 9
> All-time record: 944-342-35

2. Texas
> Avg. annual revenue (2015-2017): $147 million
> Avg. annual profit (2015-2017): $92 million
> Conference: Big 12
> National championships claimed: 4
> All-time record: 876-370-32
[in-text-ad-2]

1. Texas A&M
> Avg. annual revenue (2015-2017): $147 million
> Avg. annual profit (2015-2017): $94 million
> Conference: SEC
> National championships claimed: 2
> All-time record: 740-476-44
In 20 Years, I Haven’t Seen A Cash Back Card This Good
After two decades of reviewing financial products I haven’t seen anything like this. Credit card companies are at war, handing out free rewards and benefits to win the best customers.
A good cash back card can be worth thousands of dollars a year in free money, not to mention other perks like travel, insurance, and access to fancy lounges.
Our top pick today pays up to 5% cash back, a $200 bonus on top, and $0 annual fee. Click here to apply before they stop offering rewards this generous.
Flywheel Publishing has partnered with CardRatings for our coverage of credit card products. Flywheel Publishing and CardRatings may receive a commission from card issuers.
Thank you for reading! Have some feedback for us?
Contact the 24/7 Wall St. editorial team.
 24/7 Wall St.
 24/7 Wall St.
 24/7 Wall St.
 24/7 Wall St.
 24/7 Wall St.
