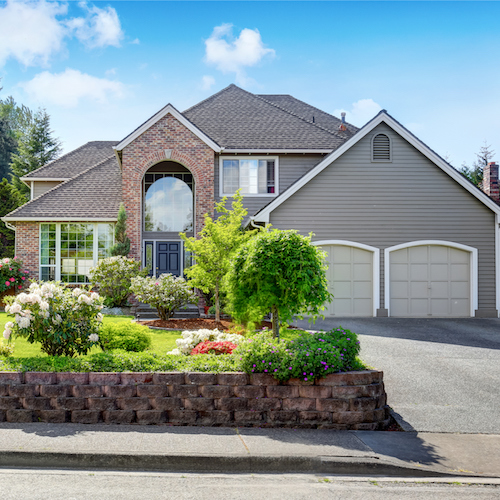
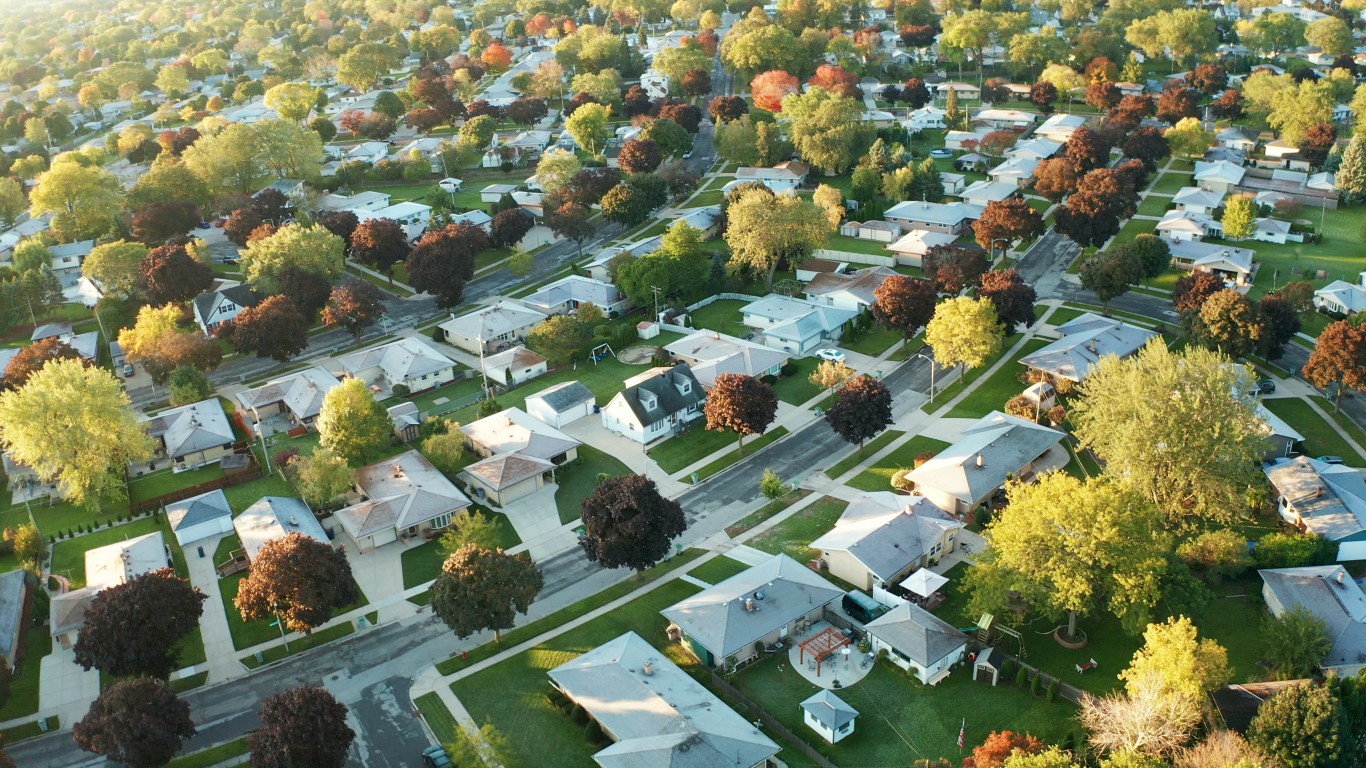
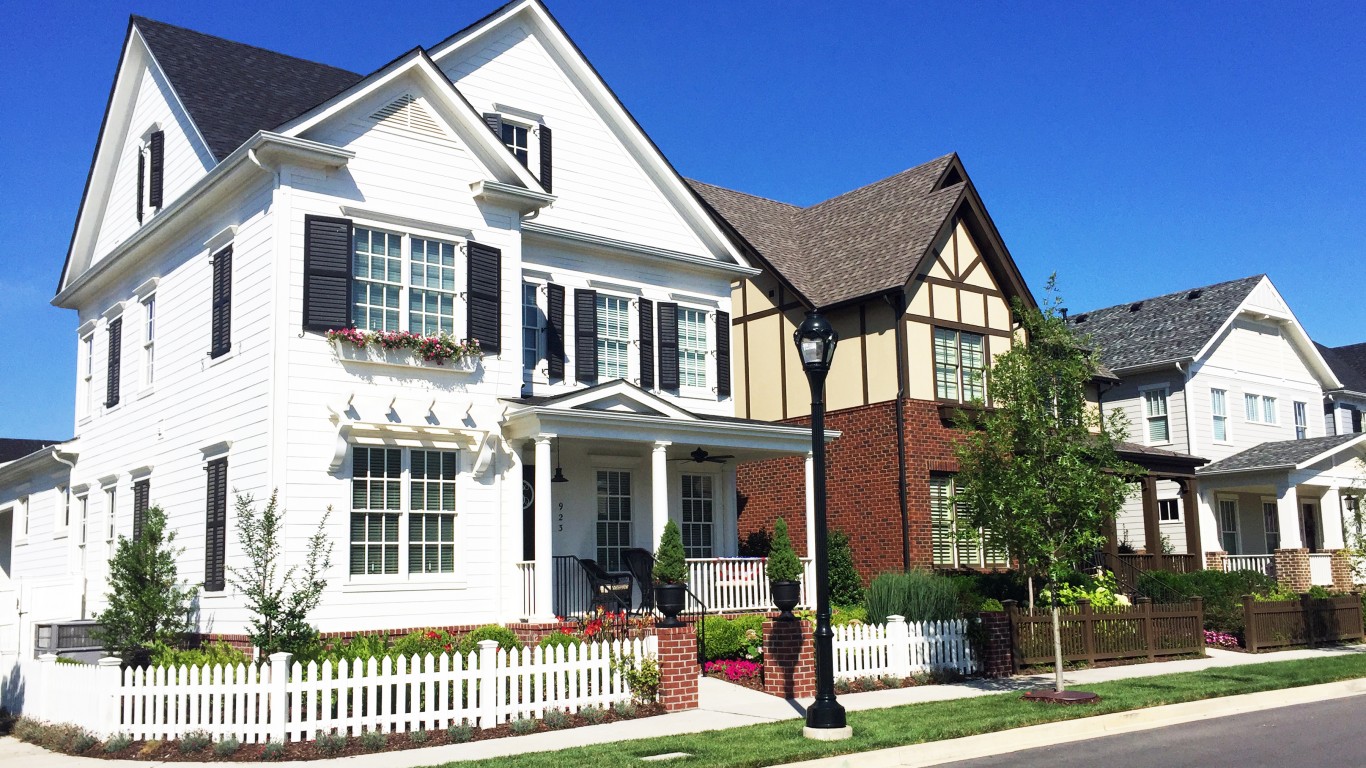
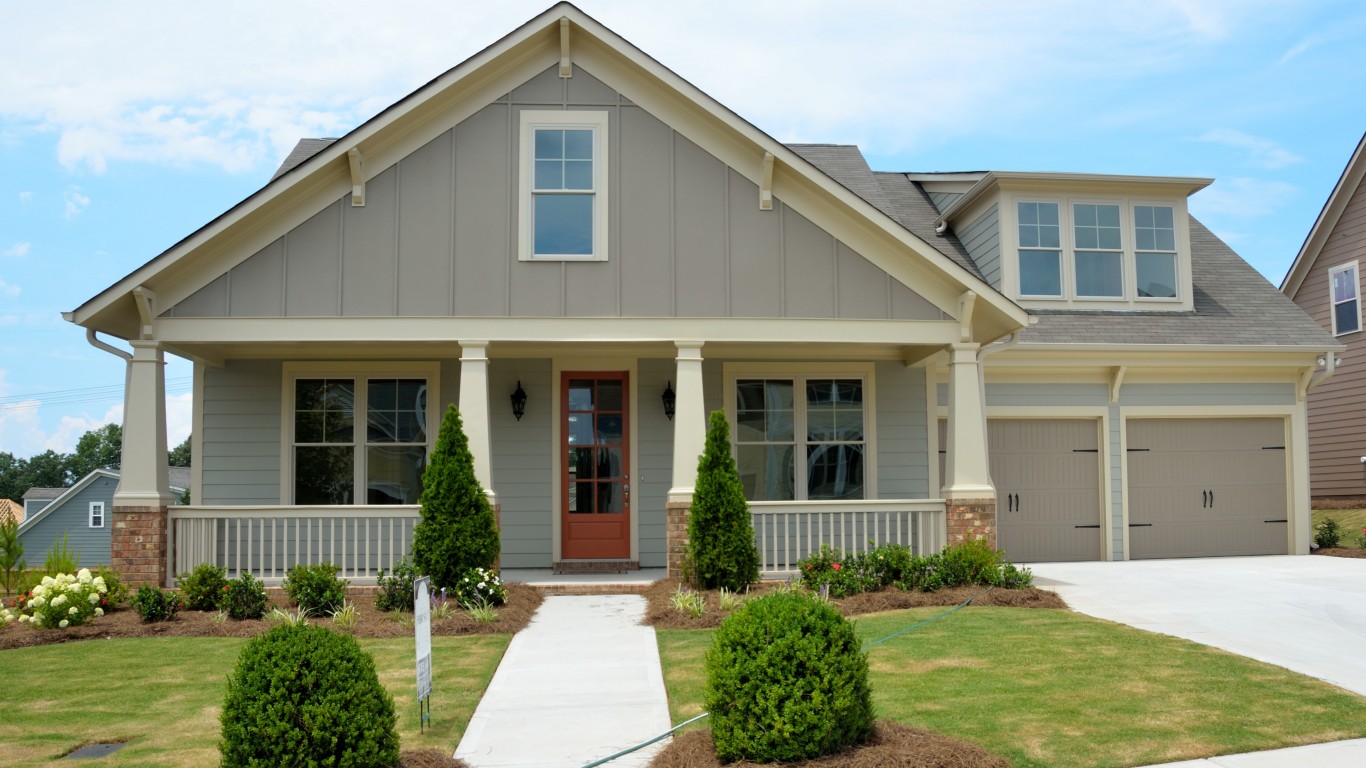
Home values have soared over the past year. In many markets, home prices have risen by double digits. The widely followed S&P Case-Shiller real estate index, which measures home prices in major metropolitan areas nationwide, showed home prices hit a record high annual gain of 19.7% in July.
Home price increases have been driven by people leaving the largest cities because of the COVID-19 pandemic. Other drivers include solid middle- and upper-class incomes and low mortgage rates. The value of home equity for the average homeowner nationwide rose by $51,500 in the second quarter of 2021 compared with the same period a year ago. Nationwide, home equity rose 29.3%, or nearly $2.9 trillion, according to CoreLogic. The state where home equity rose the most was California.
CoreLogic’s researchers commented that consumer confidence in June 2021 had risen to its highest level since the pandemic struck. They added that thanks to the different government programs, vaccines, and home equity gains, homeowners are in a better position to remain current on their mortgage payments. Further, “the majority of borrowers that fell behind on payments have a large home equity cushion that will help them avoid foreclosure.”
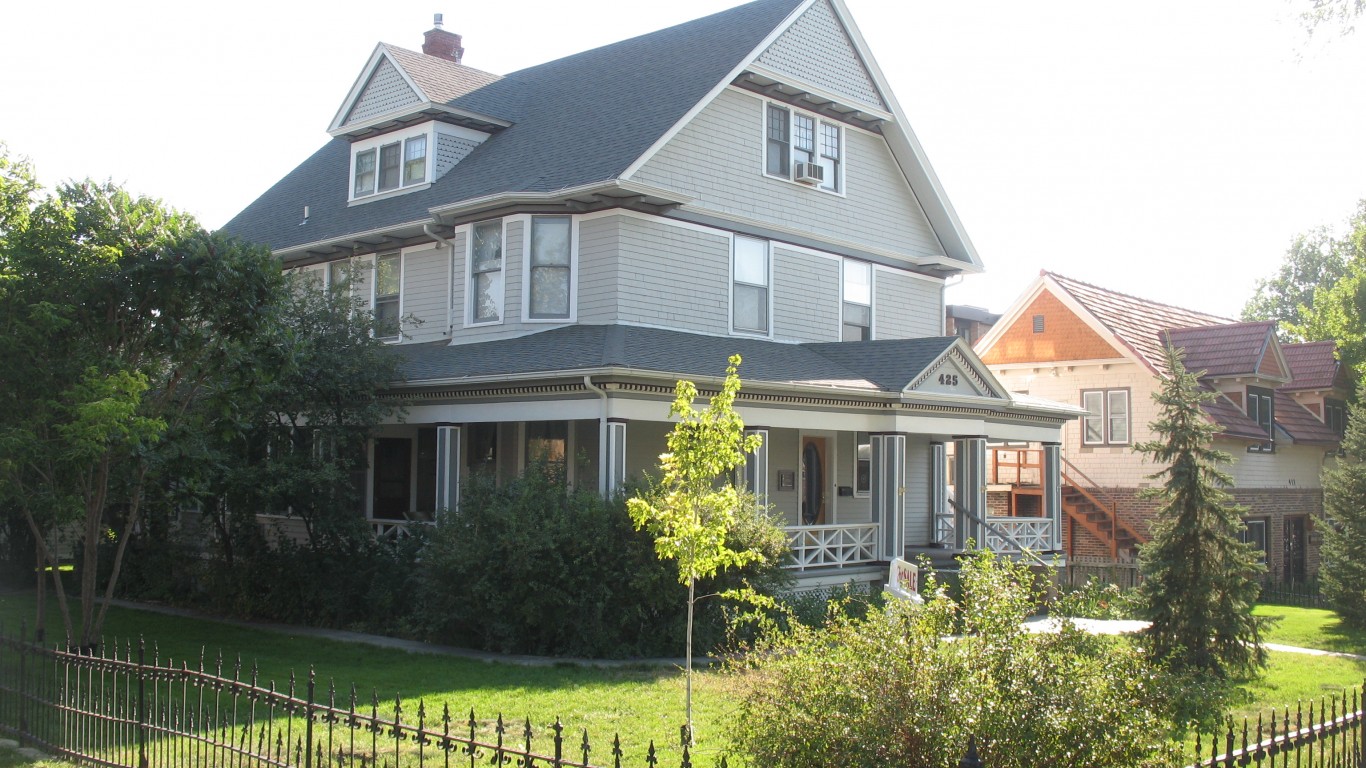
To determine the states where people are getting rich on their homes, 24/7 Wall St. reviewed data from property data provider CoreLogic’s Homeowner Equity Insights report. States were ranked on their average equity gain for the second quarter of 2021. Data was not available for Mississippi, South Dakota, Vermont, and West Virginia.
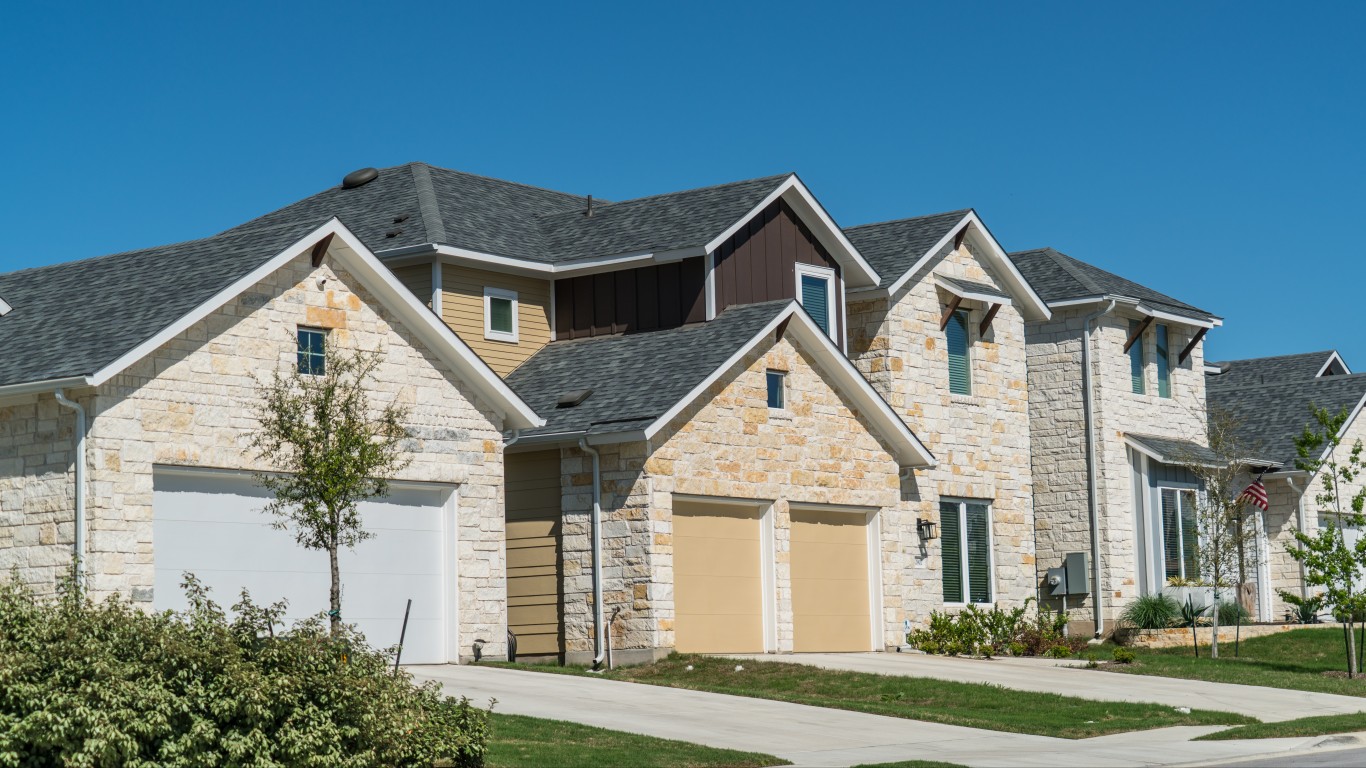
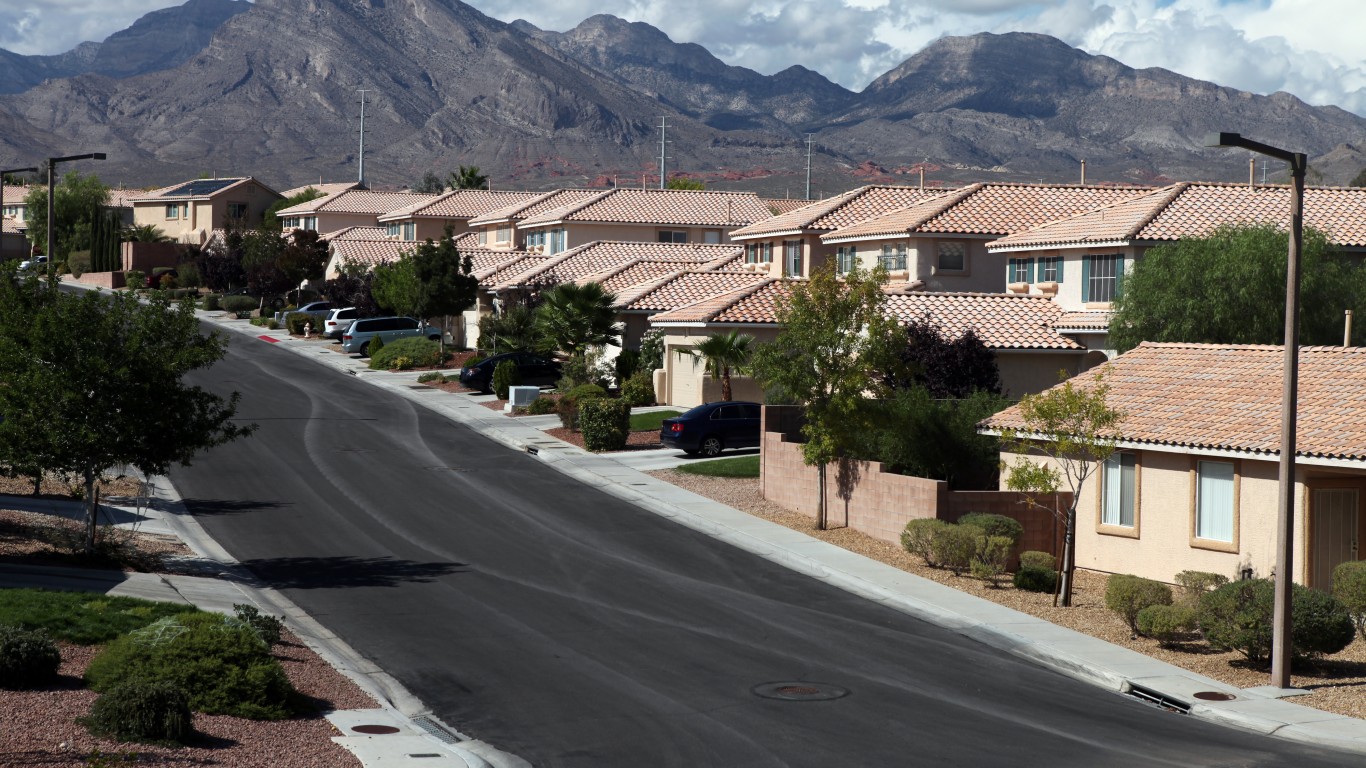
The state where home equity rose the most was California at $116,300. Washington and Idaho had the second and third largest average equity gains at $102,900 and $97,000, respectively. Western states, in general, experienced the highest increases in home equity, while states in the Midwest the lowest.
Just like it did in the first quarter, the state that did the worst was North Dakota, where home equity rose only $10,600. These are the states with highest homeownership.
It remains to be seen what will happen to home equity for the balance of the year. For now, however, with home equity rising, the number of homeowners nationwide with negative equity — those who owe more on their home than it is worth — is decreasing, falling in the second quarter by 12% year over year. These are the most at risk housing markets.
Click here to see the state where people are getting rich on their homes
46. North Dakota
> Avg. equity gain, 12 months through Q2 2021: +$10,600
> Median household income: $64,577 (20th highest)
> Median home listing price: $254,950 (13th lowest)
> Pct. of homeowners who owe more than their home is worth: 3.8% (6th most)
[in-text-ad]

45. Iowa
> Avg. equity gain, 12 months through Q2 2021: +$15,000
> Median household income: $61,691 (21st lowest)
> Median home listing price: $219,500 (4th lowest)
> Pct. of homeowners who owe more than their home is worth: 5.2% (2nd most)
[recirclink id=911070]

44. Oklahoma
> Avg. equity gain, 12 months through Q2 2021: +$17,000
> Median household income: $54,449 (8th lowest)
> Median home listing price: $234,461 (8th lowest)
> Pct. of homeowners who owe more than their home is worth: 4.4% (4th most)

43. Kentucky
> Avg. equity gain, 12 months through Q2 2021: +$20,000
> Median household income: $52,295 (7th lowest)
> Median home listing price: $249,000 (11th lowest)
> Pct. of homeowners who owe more than their home is worth: 3.6% (8th most)
[in-text-ad-2]

42. Alaska
> Avg. equity gain, 12 months through Q2 2021: +$20,000
> Median household income: $75,463 (12th highest)
> Median home listing price: $342,250 (25th lowest)
> Pct. of homeowners who owe more than their home is worth: 1.4% (14th least)

41. Louisiana
> Avg. equity gain, 12 months through Q2 2021: +$22,000
> Median household income: $51,073 (4th lowest)
> Median home listing price: $269,900 (16th lowest)
> Pct. of homeowners who owe more than their home is worth: 7.8% (the most)
[in-text-ad]

40. Illinois
> Avg. equity gain, 12 months through Q2 2021: +$24,000
> Median household income: $69,187 (17th highest)
> Median home listing price: $259,900 (14th lowest)
> Pct. of homeowners who owe more than their home is worth: 4.7% (3rd most)
[recirclink id=963472]

39. Arkansas
> Avg. equity gain, 12 months through Q2 2021: +$24,000
> Median household income: $48,952 (3rd lowest)
> Median home listing price: $229,950 (5th lowest)
> Pct. of homeowners who owe more than their home is worth: 4.1% (5th most)
38. Ohio
> Avg. equity gain, 12 months through Q2 2021: +$26,000
> Median household income: $58,642 (15th lowest)
> Median home listing price: $203,900 (2nd lowest)
> Pct. of homeowners who owe more than their home is worth: 2.7% (13th most)
[in-text-ad-2]

37. Alabama
> Avg. equity gain, 12 months through Q2 2021: +$26,000
> Median household income: $51,734 (5th lowest)
> Median home listing price: $278,648 (18th lowest)
> Pct. of homeowners who owe more than their home is worth: 2.5% (18th most)

36. Michigan
> Avg. equity gain, 12 months through Q2 2021: +$27,000
> Median household income: $59,584 (19th lowest)
> Median home listing price: $248,450 (10th lowest)
> Pct. of homeowners who owe more than their home is worth: 3.0% (12th most)
[in-text-ad]
35. Wisconsin
> Avg. equity gain, 12 months through Q2 2021: +$28,000
> Median household income: $64,168 (21st highest)
> Median home listing price: $275,000 (17th lowest)
> Pct. of homeowners who owe more than their home is worth: 3.2% (10th most)
[recirclink id=970055]

34. Nebraska
> Avg. equity gain, 12 months through Q2 2021: +$28,000
> Median household income: $63,229 (25th highest)
> Median home listing price: $253,475 (12th lowest)
> Pct. of homeowners who owe more than their home is worth: 1.5% (18th least)

33. Kansas
> Avg. equity gain, 12 months through Q2 2021: +$29,000
> Median household income: $62,087 (24th lowest)
> Median home listing price: $212,450 (3rd lowest)
> Pct. of homeowners who owe more than their home is worth: 1.5% (18th least)
[in-text-ad-2]

32. Missouri
> Avg. equity gain, 12 months through Q2 2021: +$30,000
> Median household income: $57,409 (13th lowest)
> Median home listing price: $243,750 (9th lowest)
> Pct. of homeowners who owe more than their home is worth: 2.6% (15th most)

31. Pennsylvania
> Avg. equity gain, 12 months through Q2 2021: +$30,000
> Median household income: $63,463 (23rd highest)
> Median home listing price: $267,000 (15th lowest)
> Pct. of homeowners who owe more than their home is worth: 2.4% (19th most)
[in-text-ad]
30. Wyoming
> Avg. equity gain, 12 months through Q2 2021: +$31,000
> Median household income: $65,003 (19th highest)
> Median home listing price: $329,500 (23rd lowest)
> Pct. of homeowners who owe more than their home is worth: 2.2% (22nd most)
[recirclink id=968097]
29. Texas
> Avg. equity gain, 12 months through Q2 2021: +$31,000
> Median household income: $64,034 (22nd highest)
> Median home listing price: $350,000 (24th highest)
> Pct. of homeowners who owe more than their home is worth: 1.6% (20th least)

28. New York
> Avg. equity gain, 12 months through Q2 2021: +$32,000
> Median household income: $72,108 (14th highest)
> Median home listing price: $574,000 (6th highest)
> Pct. of homeowners who owe more than their home is worth: 3.7% (7th most)
[in-text-ad-2]

27. Minnesota
> Avg. equity gain, 12 months through Q2 2021: +$33,000
> Median household income: $74,593 (13th highest)
> Median home listing price: $319,900 (21st lowest)
> Pct. of homeowners who owe more than their home is worth: 2.1% (23rd most)

26. South Carolina
> Avg. equity gain, 12 months through Q2 2021: +$35,000
> Median household income: $56,227 (10th lowest)
> Median home listing price: $325,450 (22nd lowest)
> Pct. of homeowners who owe more than their home is worth: 2.4% (19th most)
[in-text-ad]
25. Indiana
> Avg. equity gain, 12 months through Q2 2021: +$35,000
> Median household income: $57,603 (14th lowest)
> Median home listing price: $232,500 (7th lowest)
> Pct. of homeowners who owe more than their home is worth: 1.4% (14th least)
[recirclink id=911070]
24. Tennessee
> Avg. equity gain, 12 months through Q2 2021: +$37,000
> Median household income: $56,071 (9th lowest)
> Median home listing price: $346,532 (25th highest)
> Pct. of homeowners who owe more than their home is worth: 2.6% (15th most)
23. Georgia
> Avg. equity gain, 12 months through Q2 2021: +$37,000
> Median household income: $61,980 (22nd lowest)
> Median home listing price: $364,950 (21st highest)
> Pct. of homeowners who owe more than their home is worth: 2.1% (23rd most)
[in-text-ad-2]

22. New Mexico
> Avg. equity gain, 12 months through Q2 2021: +$37,000
> Median household income: $51,945 (6th lowest)
> Median home listing price: $305,000 (20th lowest)
> Pct. of homeowners who owe more than their home is worth: 2.0% (25th most)

21. Maine
> Avg. equity gain, 12 months through Q2 2021: +$37,000
> Median household income: $58,924 (16th lowest)
> Median home listing price: $336,500 (24th lowest)
> Pct. of homeowners who owe more than their home is worth: 1.6% (20th least)
[in-text-ad]

20. Delaware
> Avg. equity gain, 12 months through Q2 2021: +$44,000
> Median household income: $70,176 (16th highest)
> Median home listing price: $387,000 (18th highest)
> Pct. of homeowners who owe more than their home is worth: 3.3% (9th most)
[recirclink id=963472]

19. North Carolina
> Avg. equity gain, 12 months through Q2 2021: +$44,000
> Median household income: $57,341 (12th lowest)
> Median home listing price: $359,000 (23rd highest)
> Pct. of homeowners who owe more than their home is worth: 2.0% (25th most)

18. Maryland
> Avg. equity gain, 12 months through Q2 2021: +$46,000
> Median household income: $86,738 (the highest)
> Median home listing price: $374,995 (20th highest)
> Pct. of homeowners who owe more than their home is worth: 2.6% (15th most)
[in-text-ad-2]

17. Florida
> Avg. equity gain, 12 months through Q2 2021: +$46,000
> Median household income: $59,227 (17th lowest)
> Median home listing price: $399,000 (17th highest)
> Pct. of homeowners who owe more than their home is worth: 2.3% (21st most)

16. Virginia
> Avg. equity gain, 12 months through Q2 2021: +$50,000
> Median household income: $76,456 (10th highest)
> Median home listing price: $375,916 (19th highest)
> Pct. of homeowners who owe more than their home is worth: 1.9% (24th least)
[in-text-ad]

15. New Jersey
> Avg. equity gain, 12 months through Q2 2021: +$55,000
> Median household income: $85,751 (3rd highest)
> Median home listing price: $439,950 (14th highest)
> Pct. of homeowners who owe more than their home is worth: 2.7% (13th most)
[recirclink id=970055]

14. New Hampshire
> Avg. equity gain, 12 months through Q2 2021: +$55,000
> Median household income: $77,933 (8th highest)
> Median home listing price: $425,000 (15th highest)
> Pct. of homeowners who owe more than their home is worth: 1.9% (24th least)

13. Connecticut
> Avg. equity gain, 12 months through Q2 2021: +$64,000
> Median household income: $78,833 (6th highest)
> Median home listing price: $459,250 (11th highest)
> Pct. of homeowners who owe more than their home is worth: 3.1% (11th most)
[in-text-ad-2]
12. Nevada
> Avg. equity gain, 12 months through Q2 2021: +$64,000
> Median household income: $63,276 (24th highest)
> Median home listing price: $449,450 (13th highest)
> Pct. of homeowners who owe more than their home is worth: 1.3% (9th least)
11. Rhode Island
> Avg. equity gain, 12 months through Q2 2021: +$68,000
> Median household income: $71,169 (15th highest)
> Median home listing price: $420,950 (16th highest)
> Pct. of homeowners who owe more than their home is worth: 1.9% (24th least)
[in-text-ad]

10. Oregon
> Avg. equity gain, 12 months through Q2 2021: +$68,000
> Median household income: $67,058 (18th highest)
> Median home listing price: $520,000 (10th highest)
> Pct. of homeowners who owe more than their home is worth: 1.1% (6th least)
[recirclink id=968097]

9. Montana
> Avg. equity gain, 12 months through Q2 2021: +$73,000
> Median household income: $57,153 (11th lowest)
> Median home listing price: $529,950 (9th highest)
> Pct. of homeowners who owe more than their home is worth: 1.5% (18th least)

8. Massachusetts
> Avg. equity gain, 12 months through Q2 2021: +$74,000
> Median household income: $85,843 (2nd highest)
> Median home listing price: $632,000 (3rd highest)
> Pct. of homeowners who owe more than their home is worth: 1.7% (21st least)
[in-text-ad-2]

7. Colorado
> Avg. equity gain, 12 months through Q2 2021: +$77,000
> Median household income: $77,127 (9th highest)
> Median home listing price: $575,000 (4th highest)
> Pct. of homeowners who owe more than their home is worth: 1.4% (14th least)

6. Arizona
> Avg. equity gain, 12 months through Q2 2021: +$79,000
> Median household income: $62,055 (23rd lowest)
> Median home listing price: $449,950 (12th highest)
> Pct. of homeowners who owe more than their home is worth: 1.2% (7th least)
[in-text-ad]

5. Utah
> Avg. equity gain, 12 months through Q2 2021: +$81,000
> Median household income: $75,780 (11th highest)
> Median home listing price: $572,450 (7th highest)
> Pct. of homeowners who owe more than their home is worth: 1.3% (9th least)
[recirclink id=911070]

4. Hawaii
> Avg. equity gain, 12 months through Q2 2021: +$86,000
> Median household income: $83,102 (4th highest)
> Median home listing price: $725,000 (2nd highest)
> Pct. of homeowners who owe more than their home is worth: 1.4% (14th least)
3. Idaho
> Avg. equity gain, 12 months through Q2 2021: +$97,000
> Median household income: $60,999 (20th lowest)
> Median home listing price: $532,500 (8th highest)
> Pct. of homeowners who owe more than their home is worth: 1.5% (18th least)
[in-text-ad-2]

2. Washington
> Avg. equity gain, 12 months through Q2 2021: +$102,900
> Median household income: $78,687 (7th highest)
> Median home listing price: $575,000 (4th highest)
> Pct. of homeowners who owe more than their home is worth: 1.4% (14th least)
1. California
> Avg. equity gain, 12 months through Q2 2021: +$116,300
> Median household income: $80,440 (5th highest)
> Median home listing price: $726,500 (the highest)
> Pct. of homeowners who owe more than their home is worth: 0.8% (5th least)