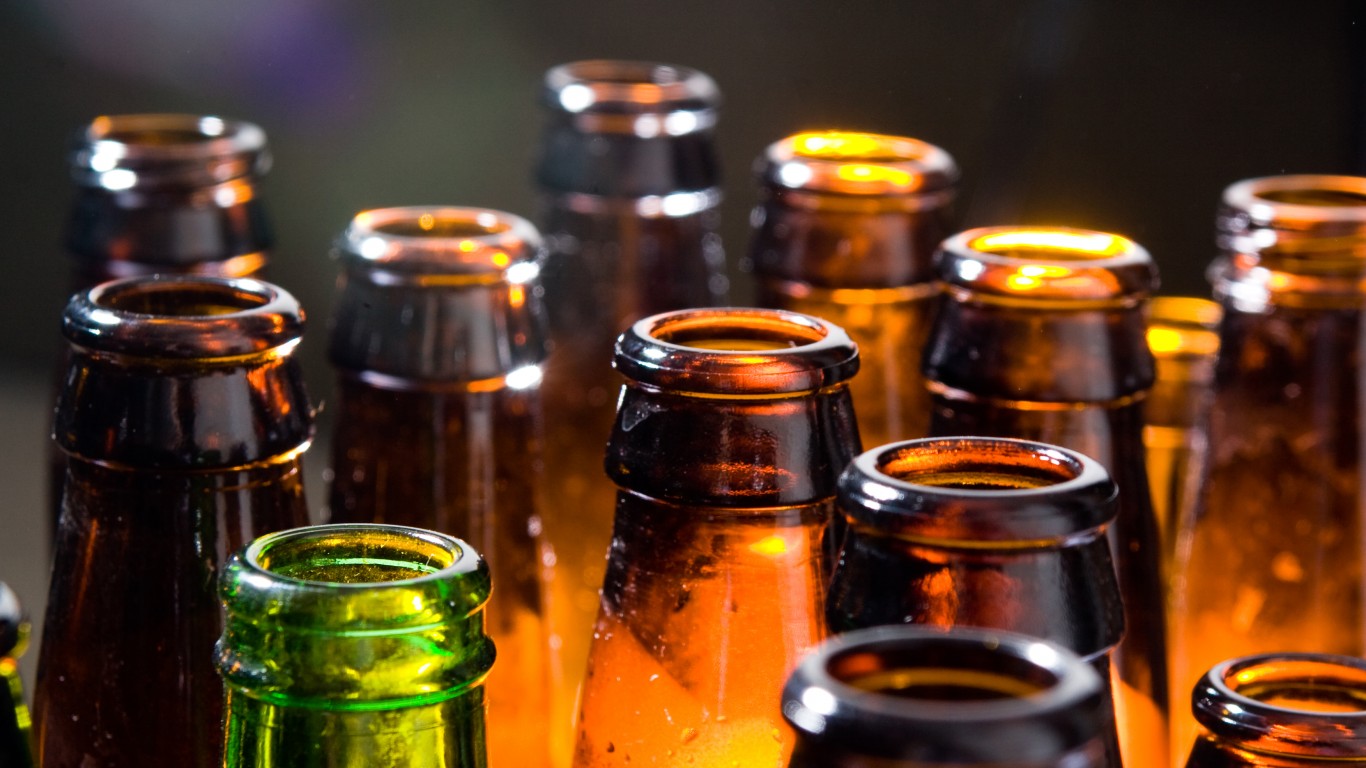
Data about beer consumption in America is usually robust. According to beer news site, Beer Info, U.S. beer consumption by people 21 years or over totals 28.2 gallons per person per year. That is about a six-pack per week. Since not all Americans drink beer, the figures for those who do must be much higher on an annual basis — with many no doubt regularly imbibing some of America’s 30 oldest beers.
Consumption is usually high in the Plains States. North Dakota tops the list at 45.8 gallons per adult a year. Montana is third at 41 gallons and South Dakota is fourth at 38.9 gallons. At the far end of the spectrum is Utah, at 20.2 gallons. In addition, there are rankings of best and worst cities for beer lovers. The worst American city for beer lovers is San Bernardino, California.
Lawn Love has been able to break down the best and worst cities for beer lovers. This list delivers very different results than state consumption data does. It uses different metrics. Across America’s 180 largest cities, Lawn Love measured access to establishments where people drink beer. It also ranked what it calls “establishment quality,” a yardstick of consumer rankings. It looked at beer quality and costs. It listed its sources as BreweryDB, Eventbrite, Great American Beer Festival, Livability, Meetup, North American Brewers Association, World Beer Awards, and Yelp.
Each of the measurements was weighted to calculate an overall score for each of the 180 cities. The highest among them posted a score of 55.07. The lowest score was 14.46, for San Bernardino, California.
24/7 Tempo listed the 50 worst cities for beer lovers. The two largest states by population, California and Texas, dominate the worst 10 cities. California has two more cities among the worst 10: Fontana with a score of 21.01 and Bakersfield with a score of 21.02. In Texas, Plano has a score of 18.38 and Laredo a score of 19.05.
Virginia also has two cities among the worst 10 for beer lovers, Chesapeake, with a score of 20.55 and Virginia Beach with a score of 21.19. Rounding out the list, Columbus, Georgia, has a score of 17.07; Kansas City, Kansas, has a score of 17.8; and Scottsdale, Arizona has a score of 20.96.
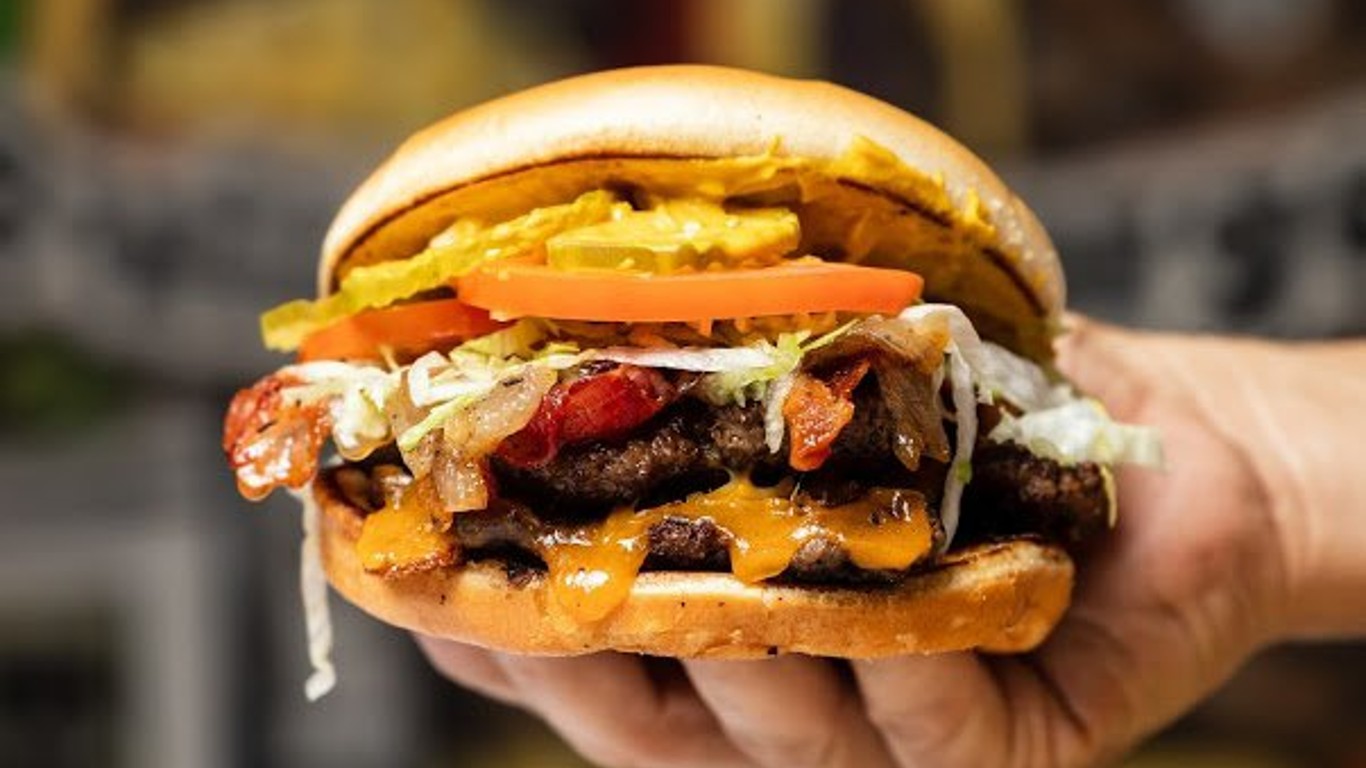
Two geographic areas dominate the top of the list — the best cities for beer lovers. Among the Pacific Northwest states, Spokane, Washington, has a 55.07 score, the highest nationwide. Portland, Oregon, ranks second with a score of 53.41. Seattle ranks fourth with a score of 48.97. With that beer, you might want a burger — this is the best American city for burger lovers.
Click here to see the worst American city for beer lovers
Click here to read our detailed methodology
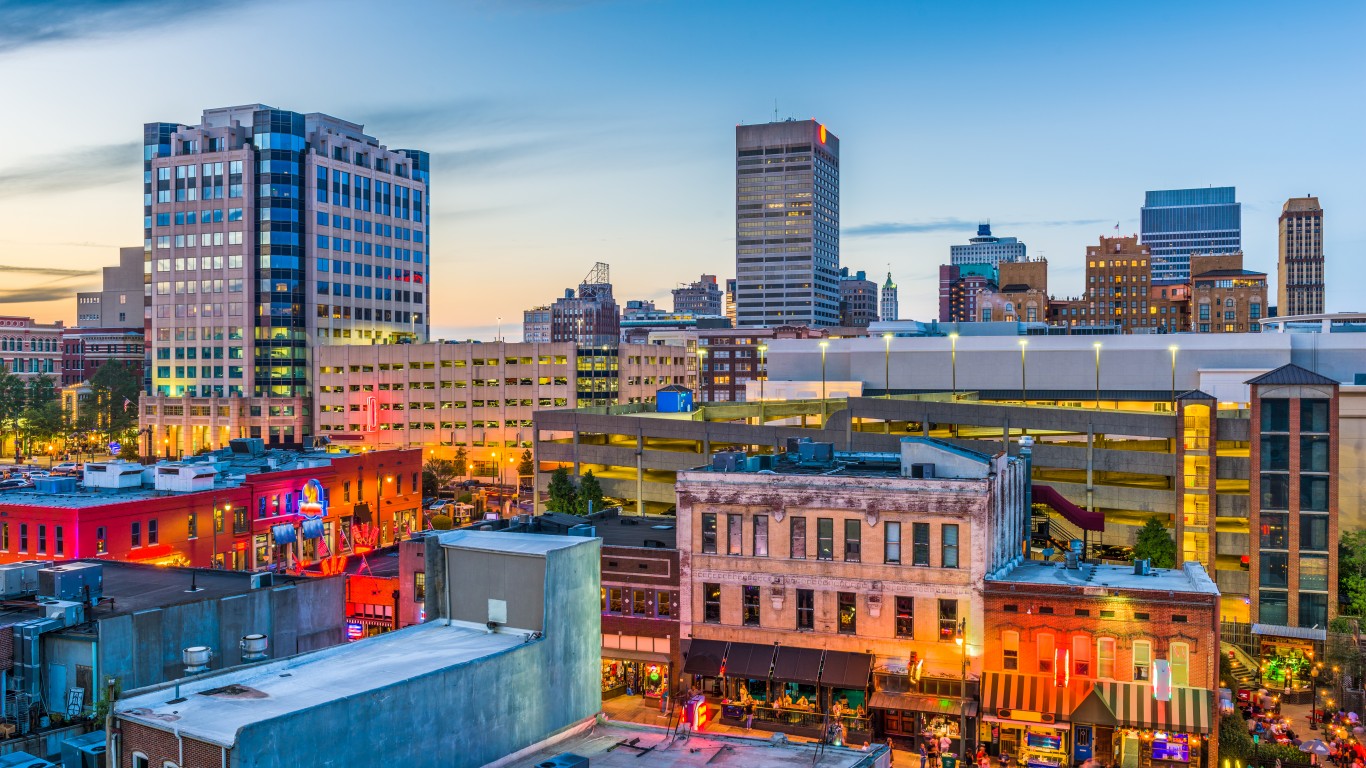
> 50. Memphis, Tennessee
> Overall score: 27.98
> Drinking places: 5.2 per 100,000
> Total population: 651,932
[in-text-ad]
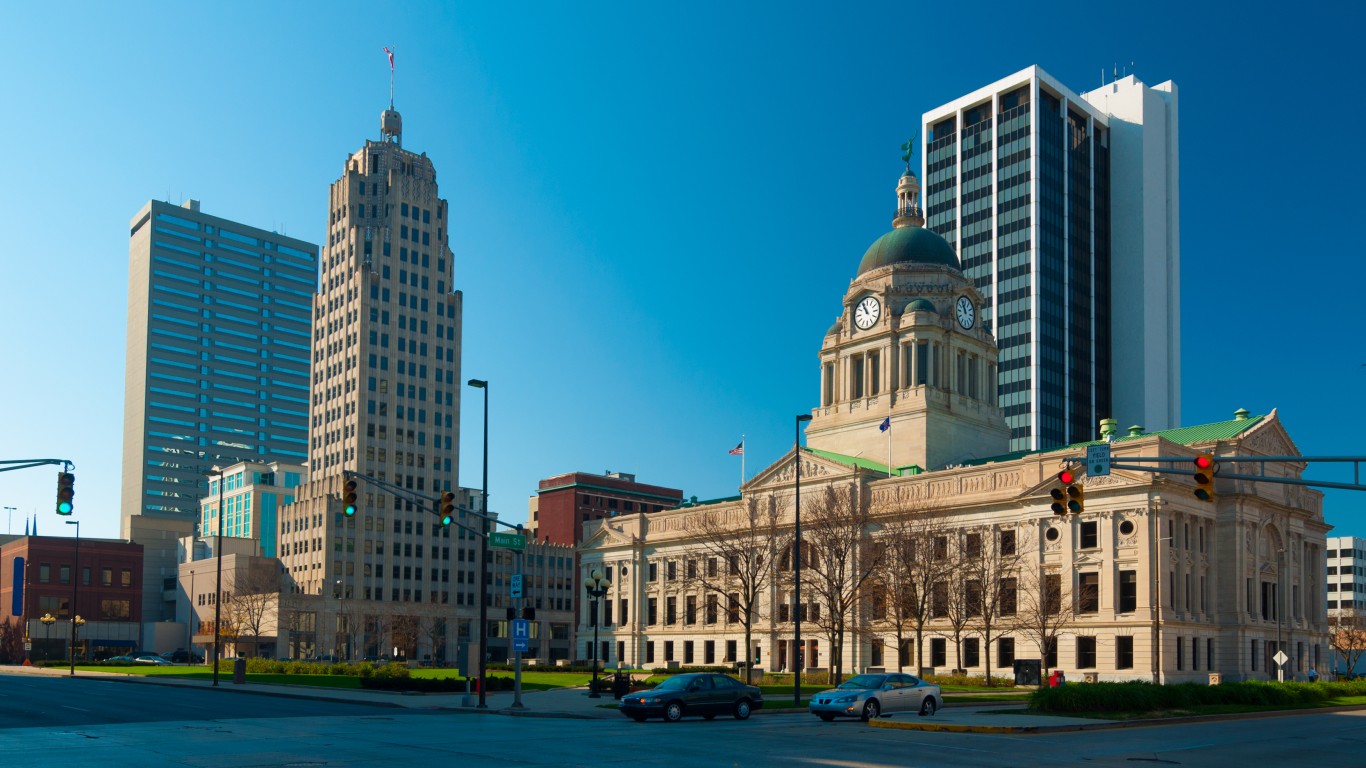
> 49. Fort Wayne, Indiana
> Overall score: 27.88
> Drinking places: 16.1 per 100,000
> Total population: 265,752
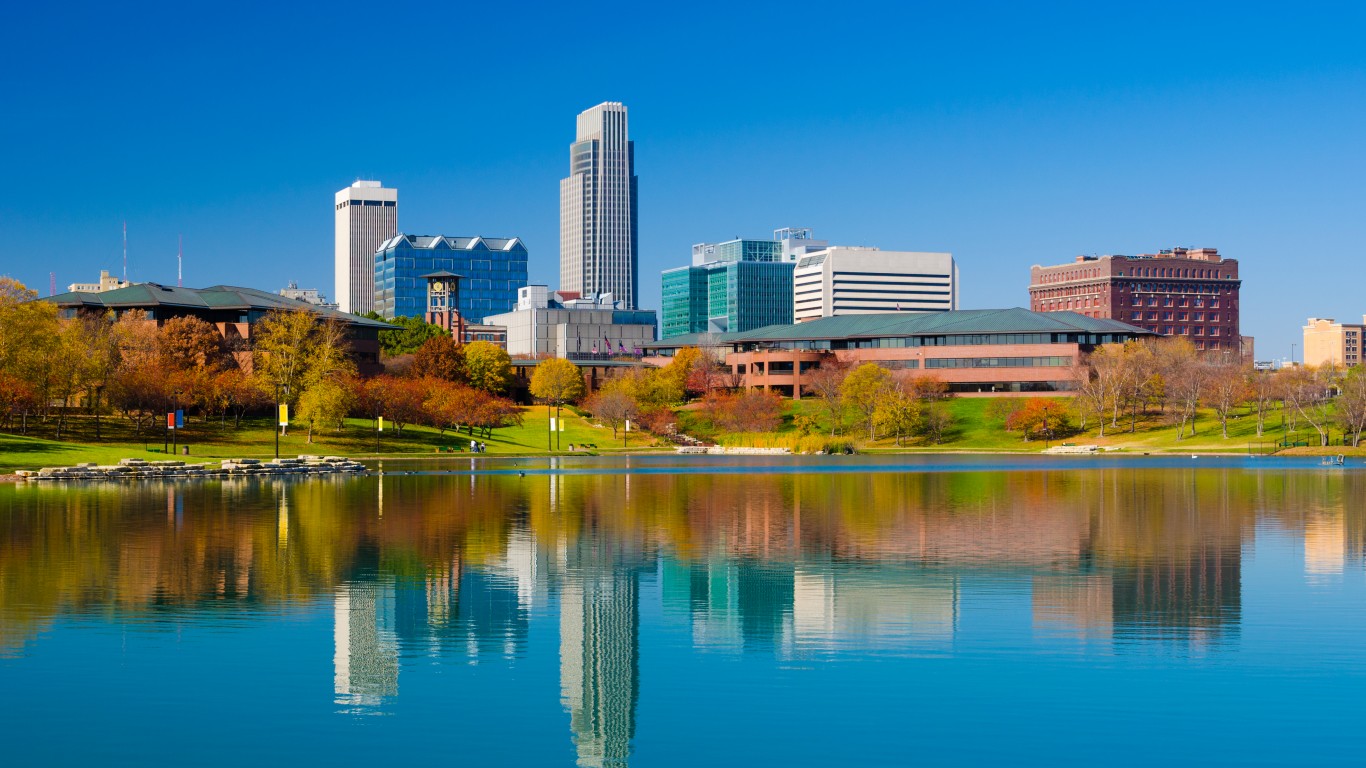
> 48. Omaha, Nebraska
> Overall score: 27.77
> Drinking places: 32.8 per 100,000
> Total population: 475,862
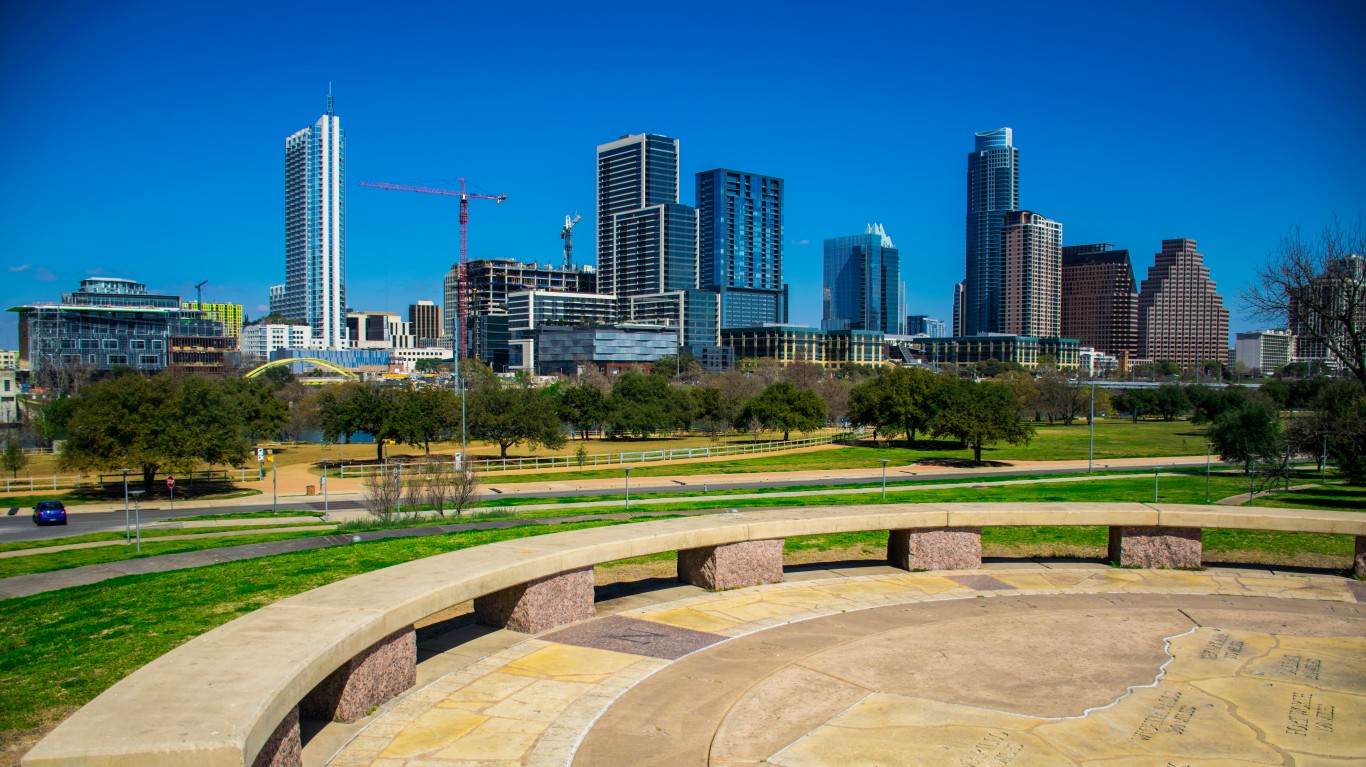
> 47. Amarillo, Texas
> Overall score: 27.49
> Drinking places: 26.7 per 100,000
> Total population: 198,955
[in-text-ad-2]
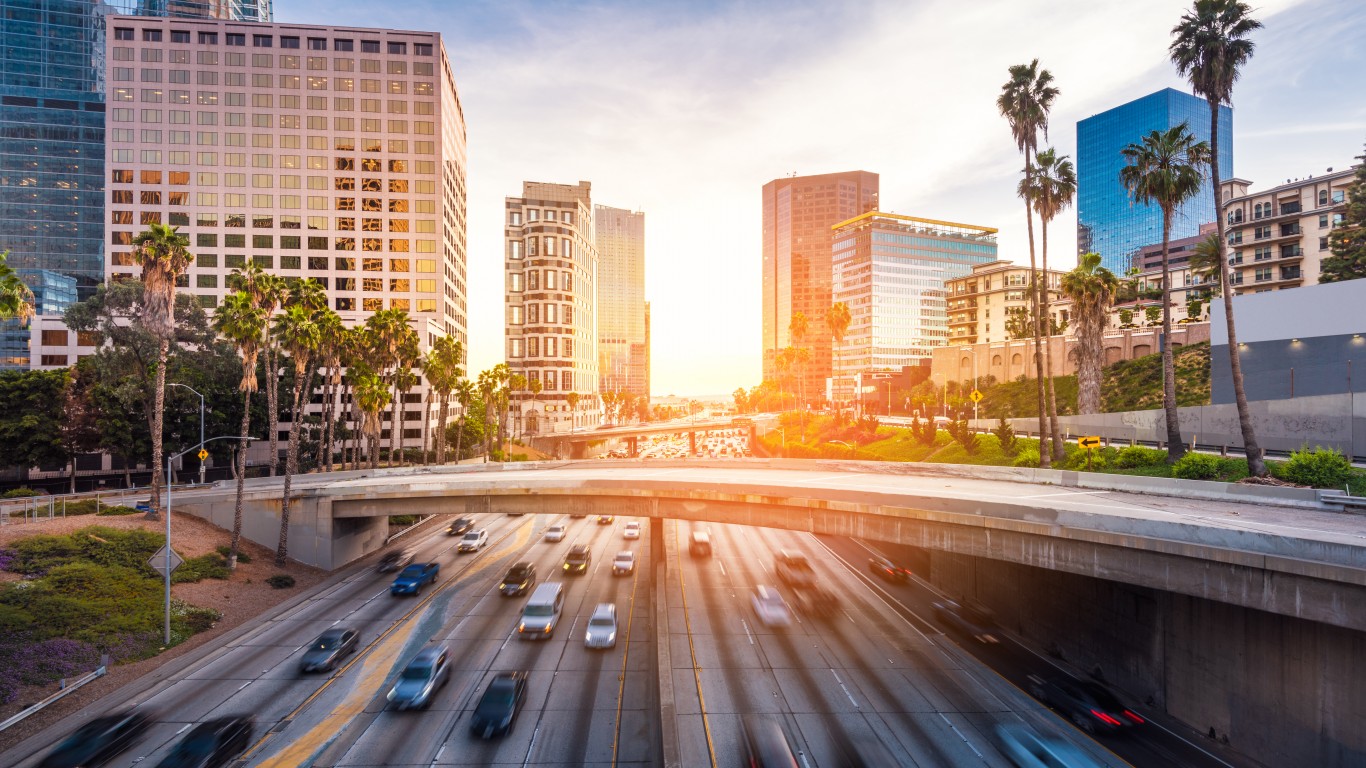
> 46. Los Angeles, California
> Overall score: 27.33
> Drinking places: 7.8 per 100,000
> Total population: 4.0 million
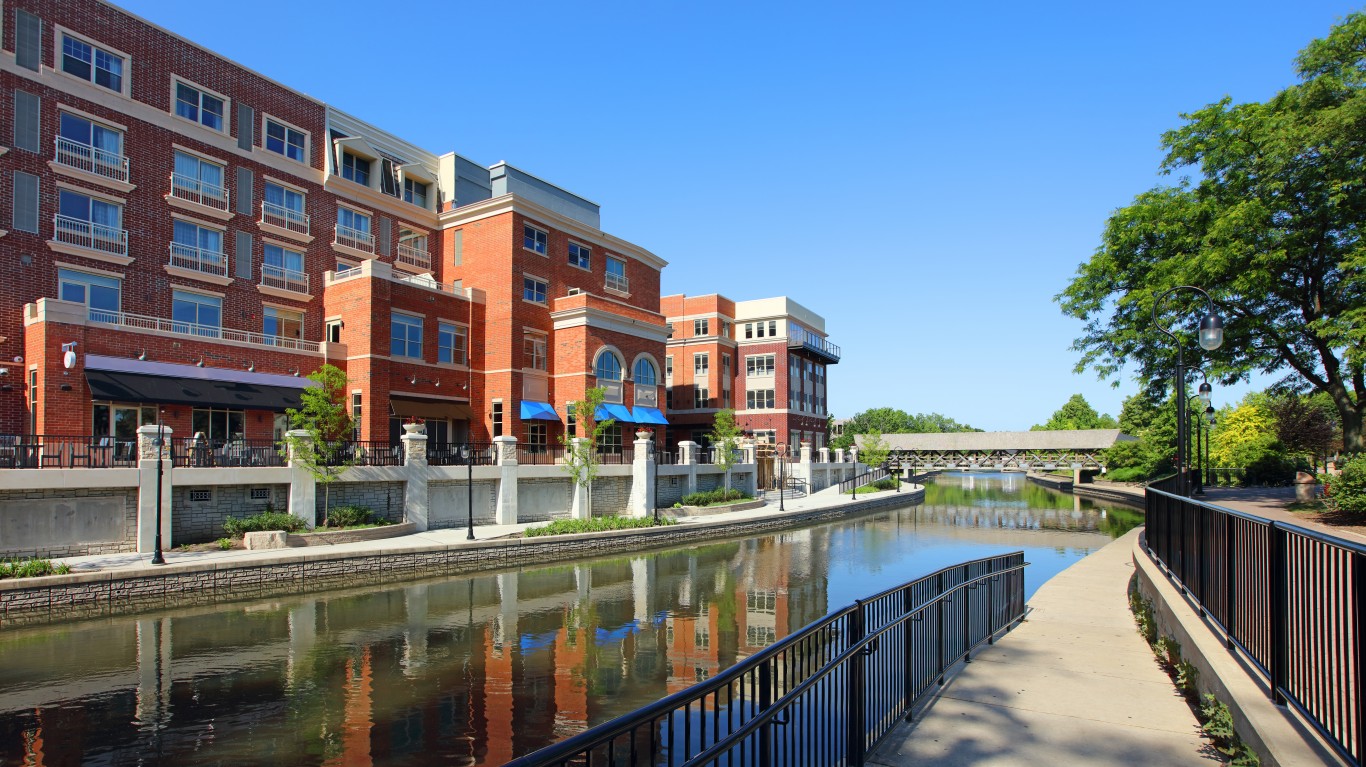
> 45. Naperville, Illinois
> Overall score: 27.05
> Drinking places: 7.9 per 100,000
> Total population: 147,501
[in-text-ad]
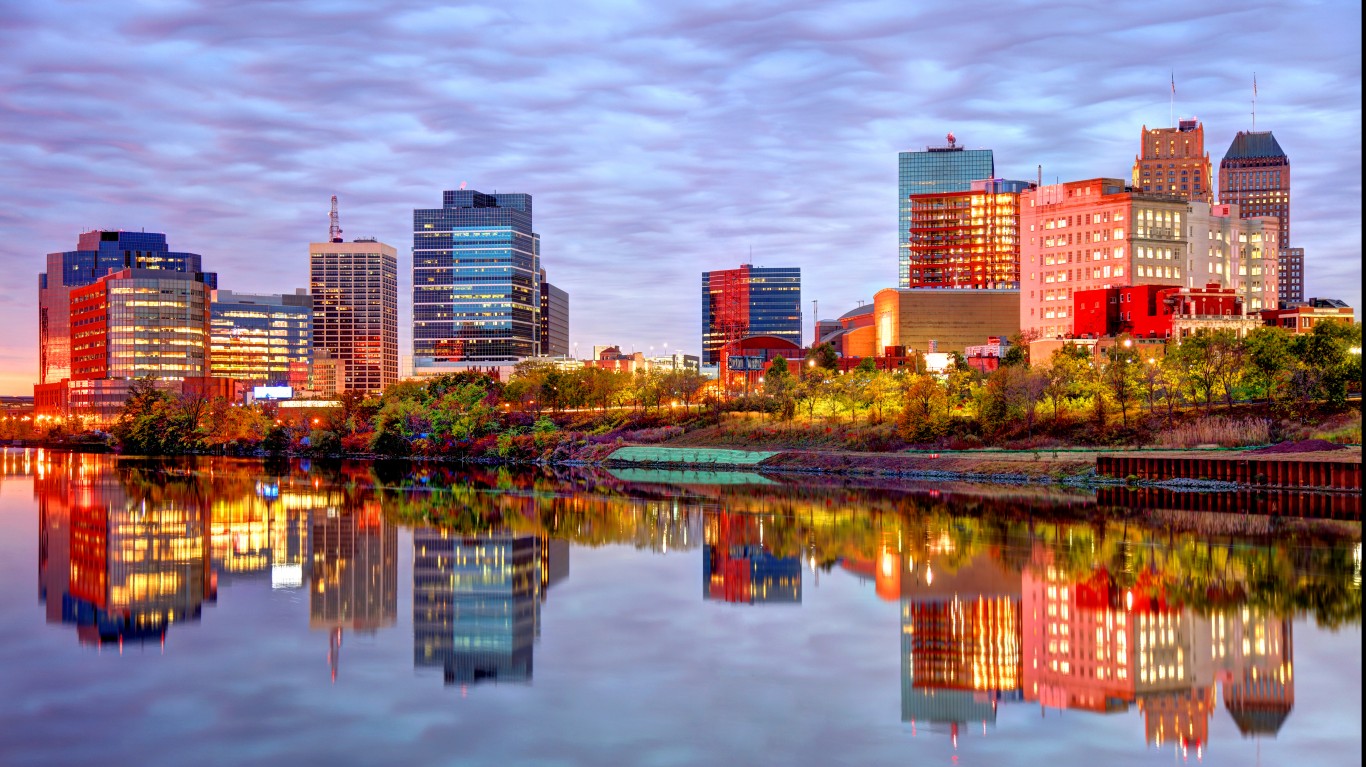
> 44. Newark, New Jersey
> Overall score: 26.63
> Drinking places: 11.1 per 100,000
> Total population: 281,054
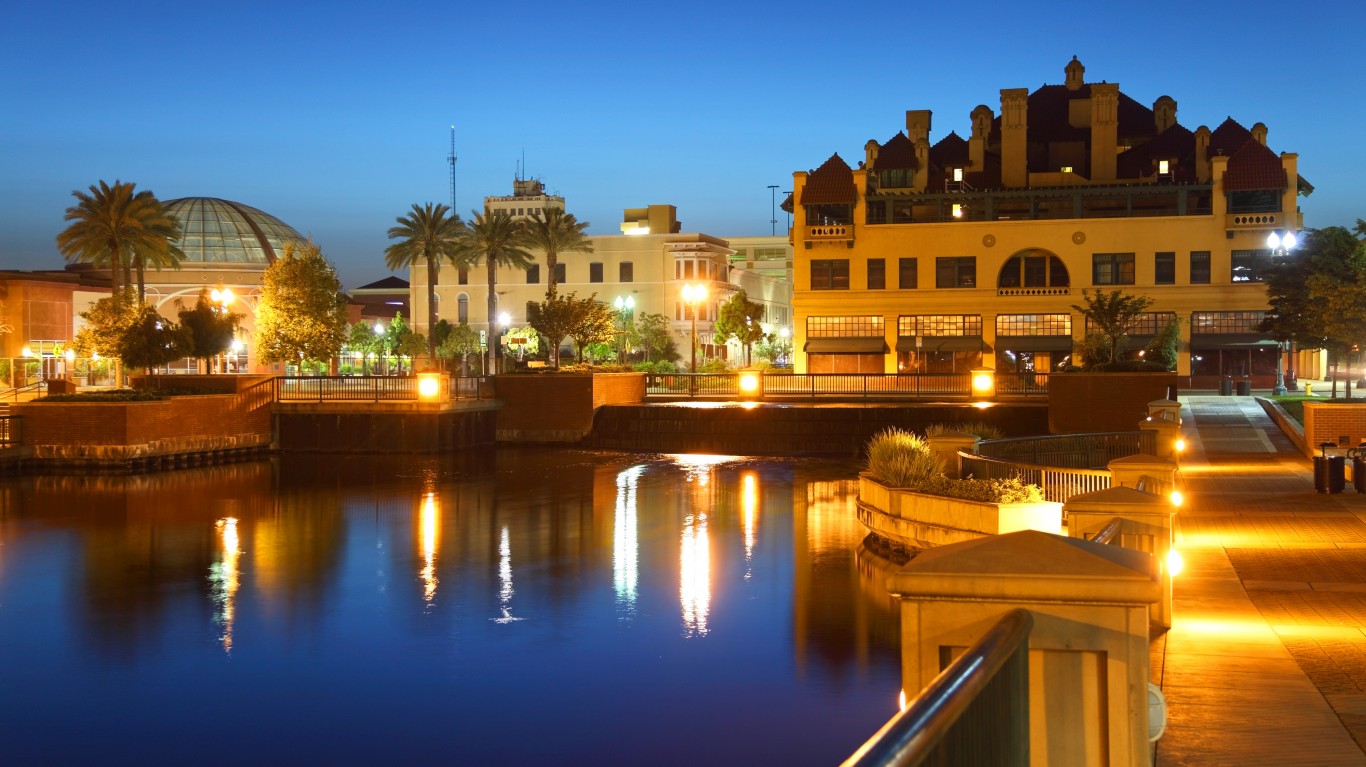
> 43. Stockton, California
> Overall score: 26.60
> Drinking places: 6.6 per 100,000
> Total population: 309,228
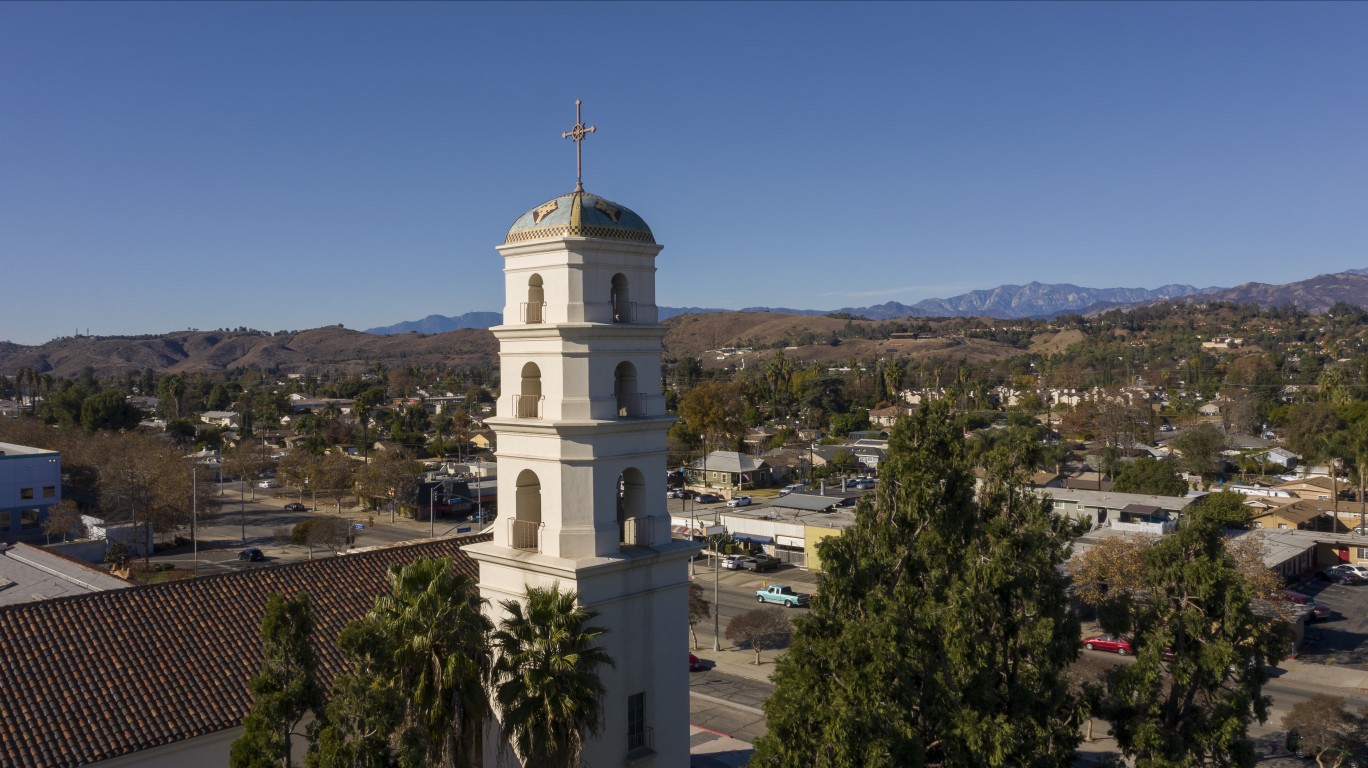
> 42. Pomona, California
> Overall score: 26.48
> Drinking places: 7.8 per 100,000
> Total population: 152,209
[in-text-ad-2]
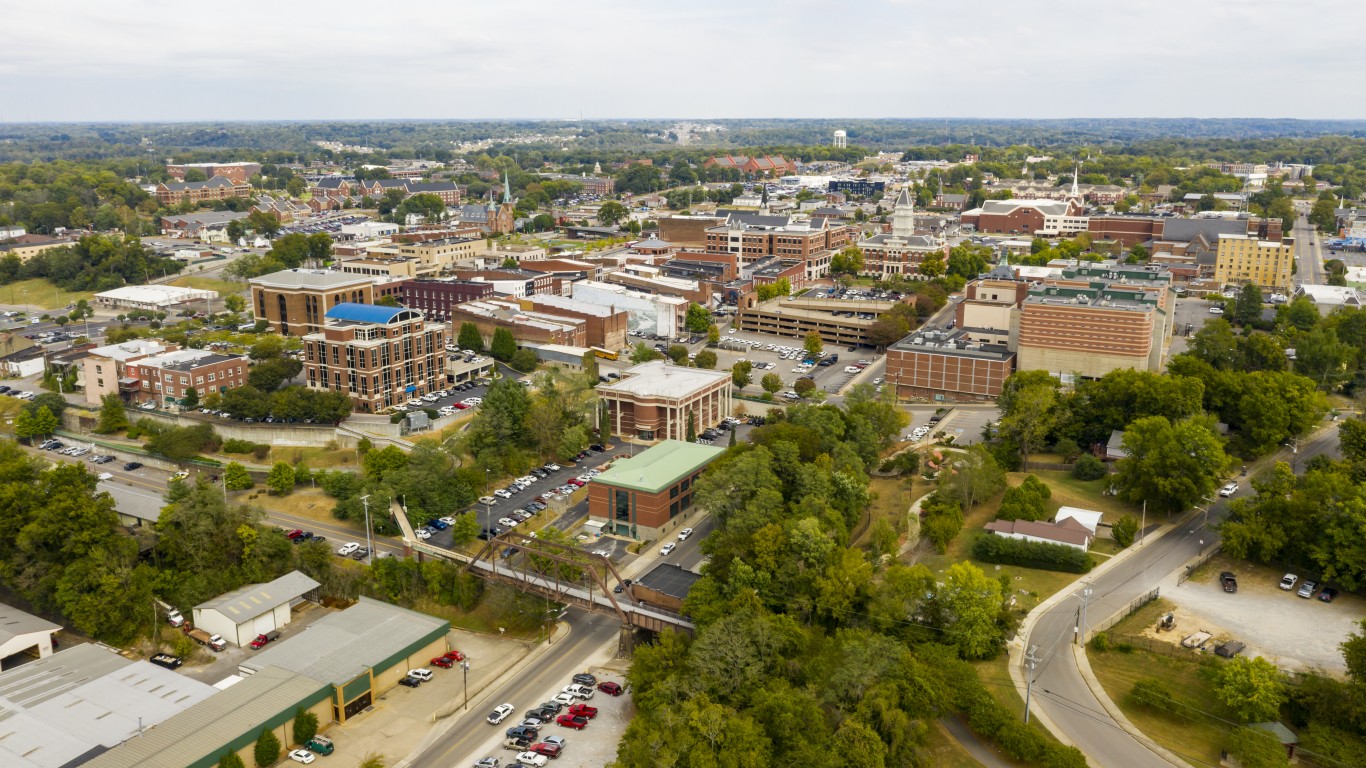
> 41. Clarksville, Tennessee
> Overall score: 26.47
> Drinking places: 6.0 per 100,000
> Total population: 152,934
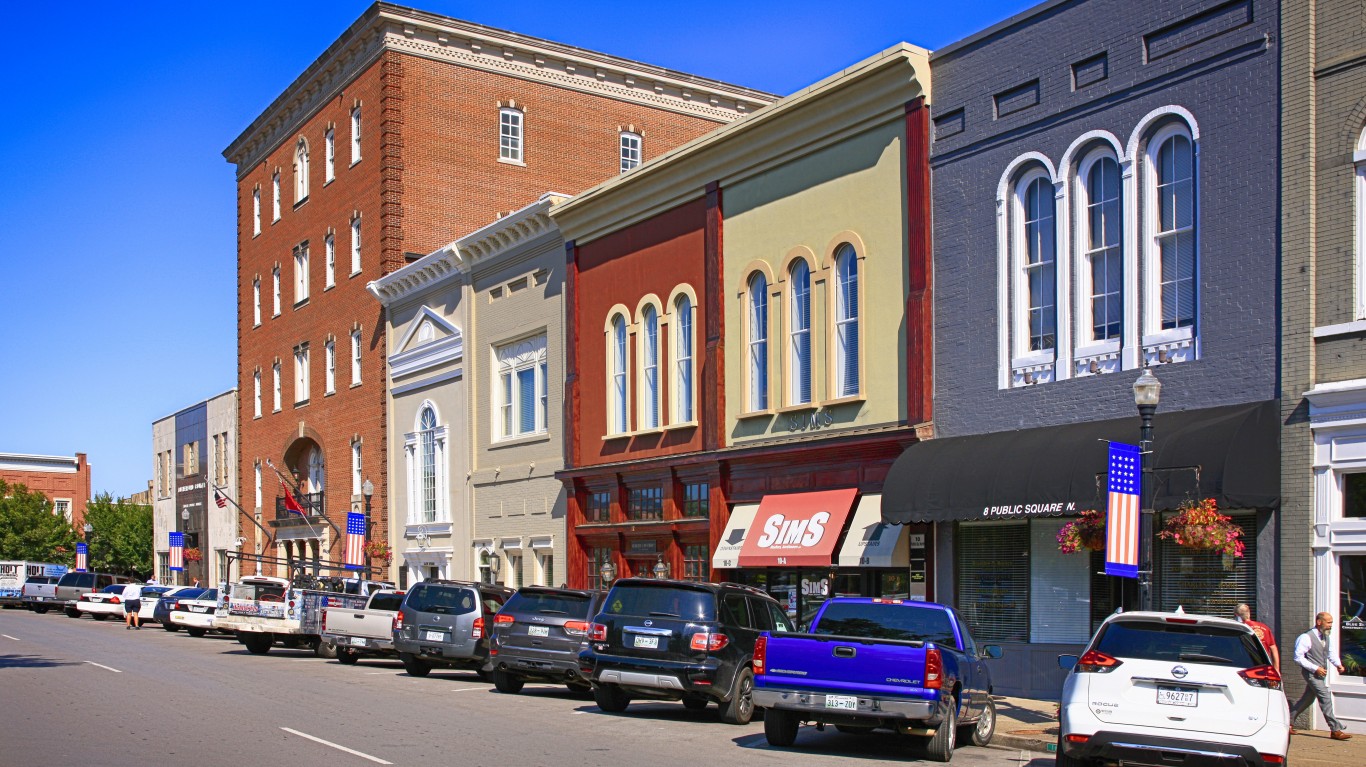
> 40. Murfreesboro, Tennessee
> Overall score: 26.43
> Drinking places: 4.1 per 100,000
> Total population: 136,366
[in-text-ad]
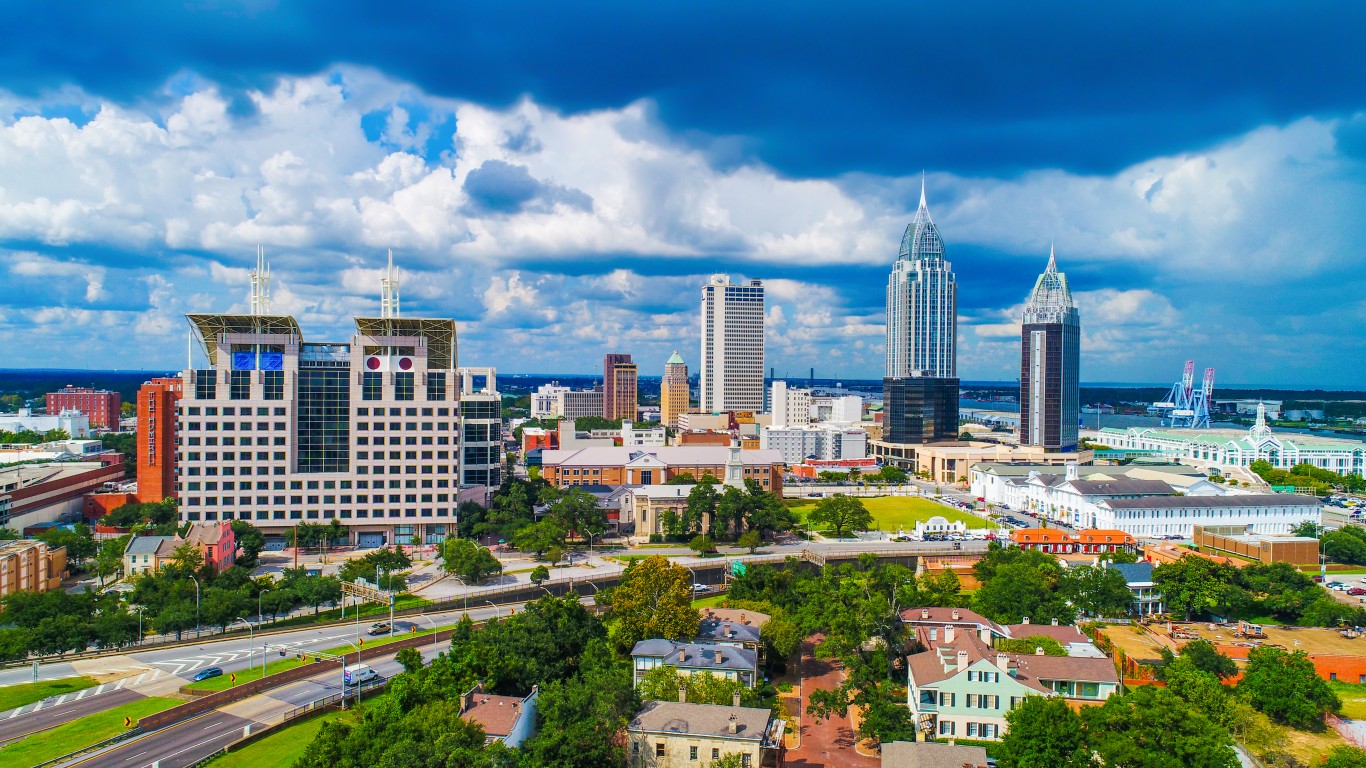
> 39. Mobile, Alabama
> Overall score: 26.35
> Drinking places: 10.4 per 100,000
> Total population: 190,432
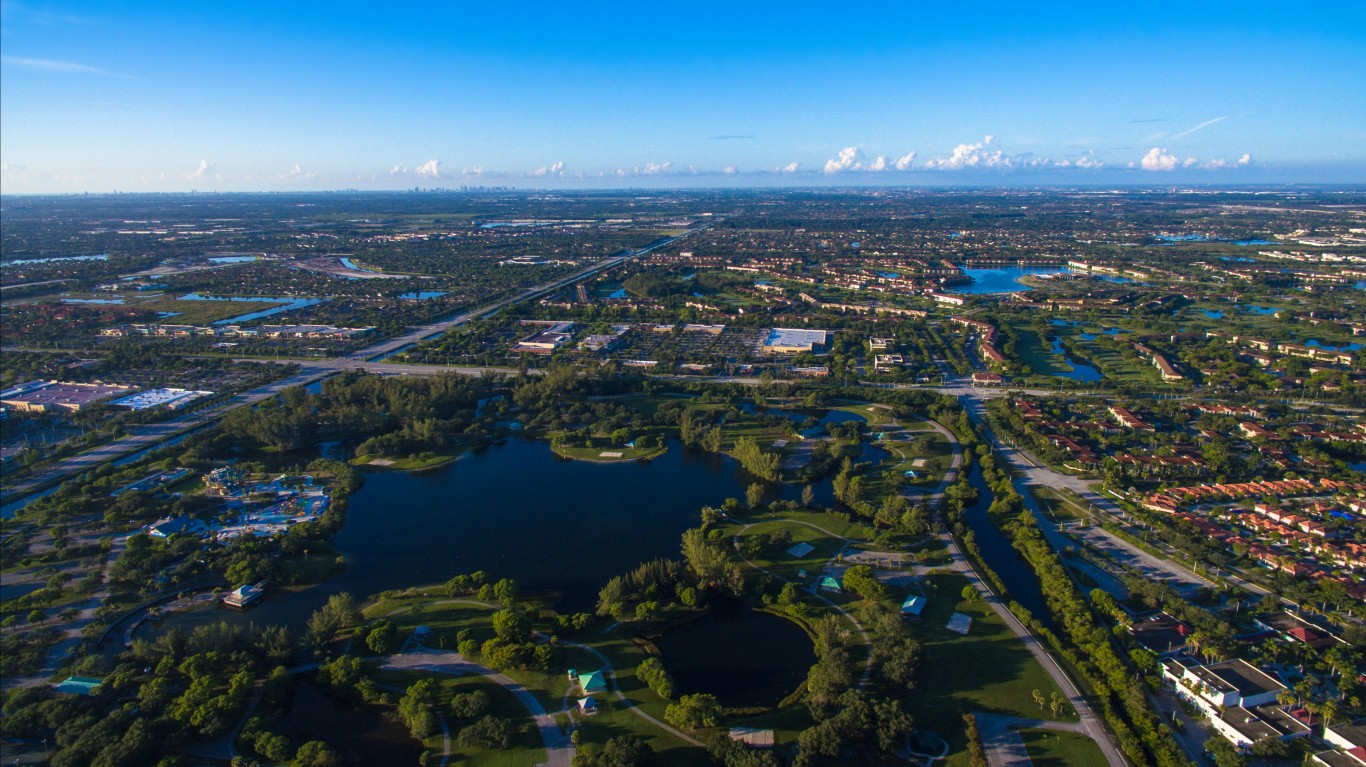
> 38. Pembroke Pines, Florida
> Overall score: 26.30
> Drinking places: 8.5 per 100,000
> Total population: 170,072
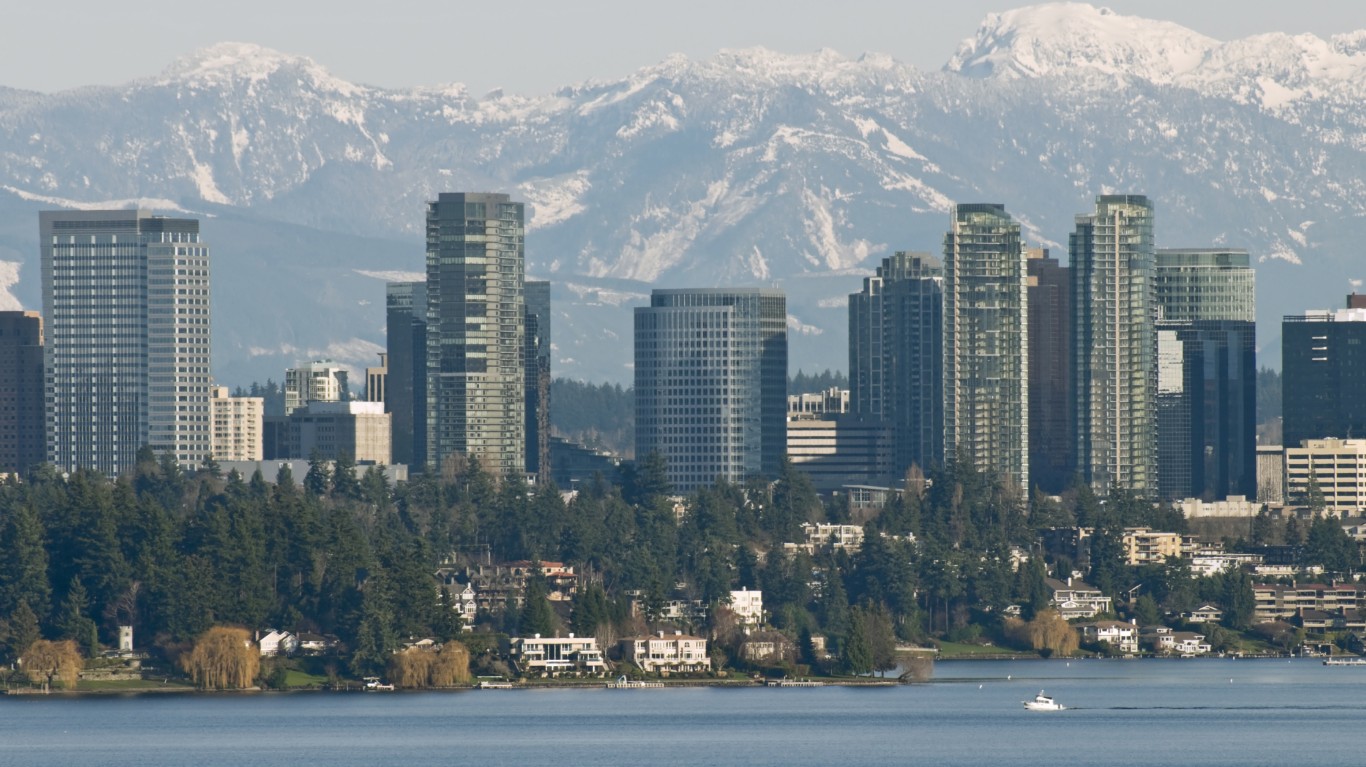
> 37. Bellevue, Washington
> Overall score: 26.23
> Drinking places: 15.8 per 100,000
> Total population: 144,403
[in-text-ad-2]
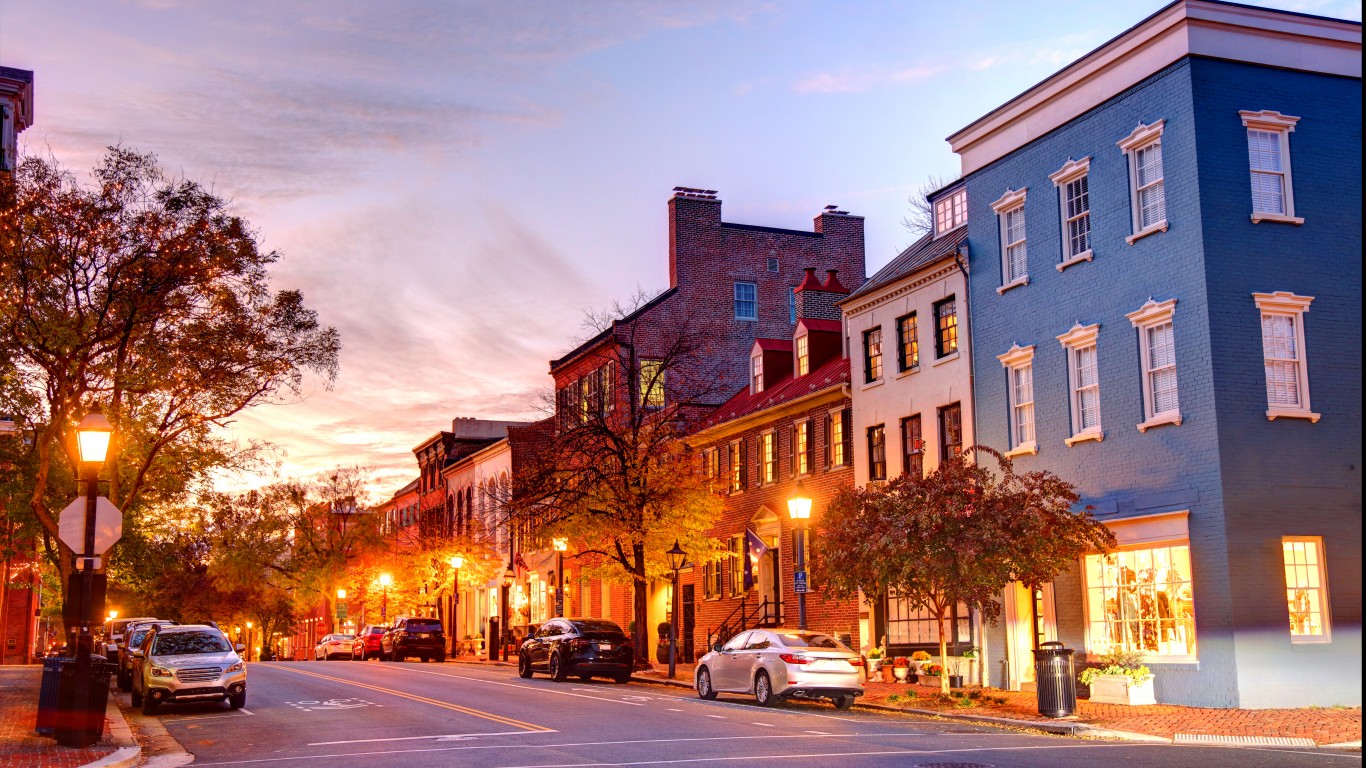
> 36. Alexandria, Virginia
> Overall score: 26.15
> Drinking places: 3.2 per 100,000
> Total population: 157,613
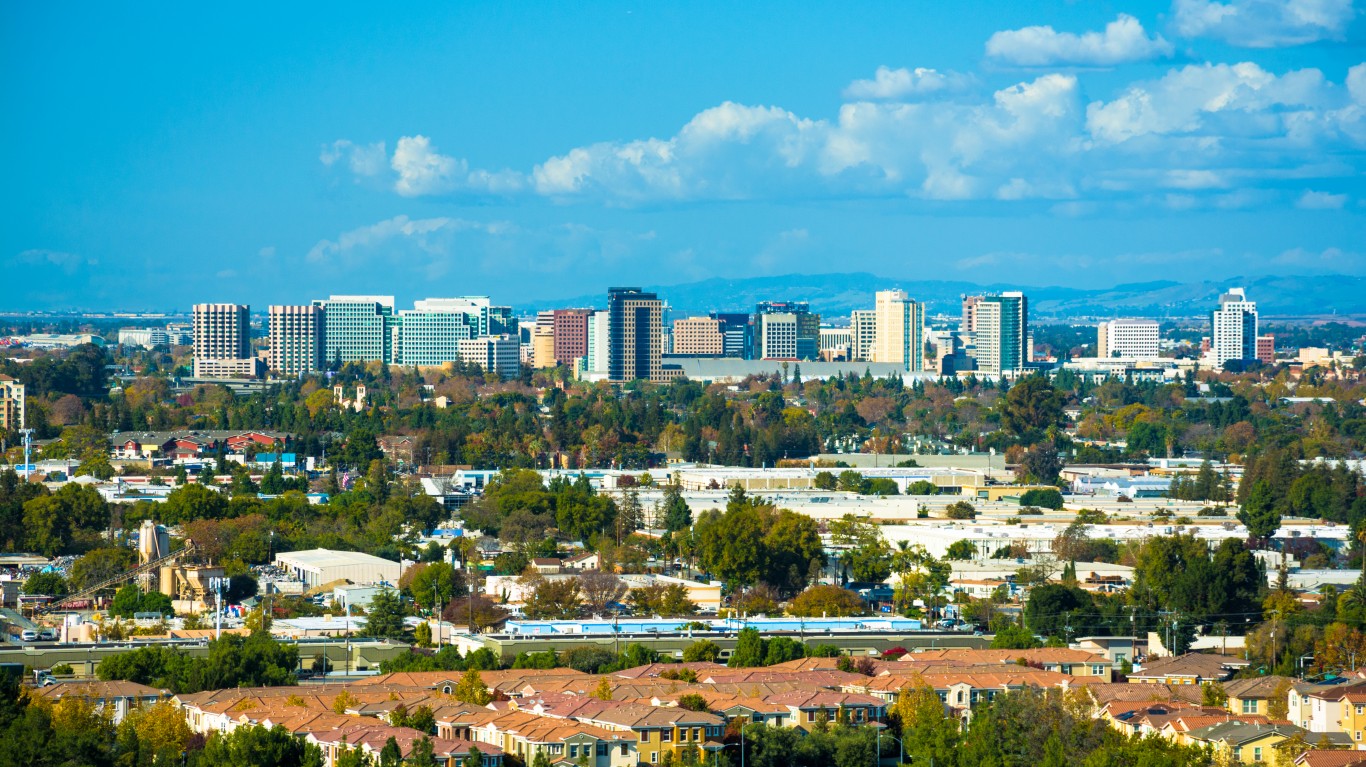
> 35. San Jose, California
> Overall score: 26.15
> Drinking places: 7.1 per 100,000
> Total population: 1.0 million
[in-text-ad]
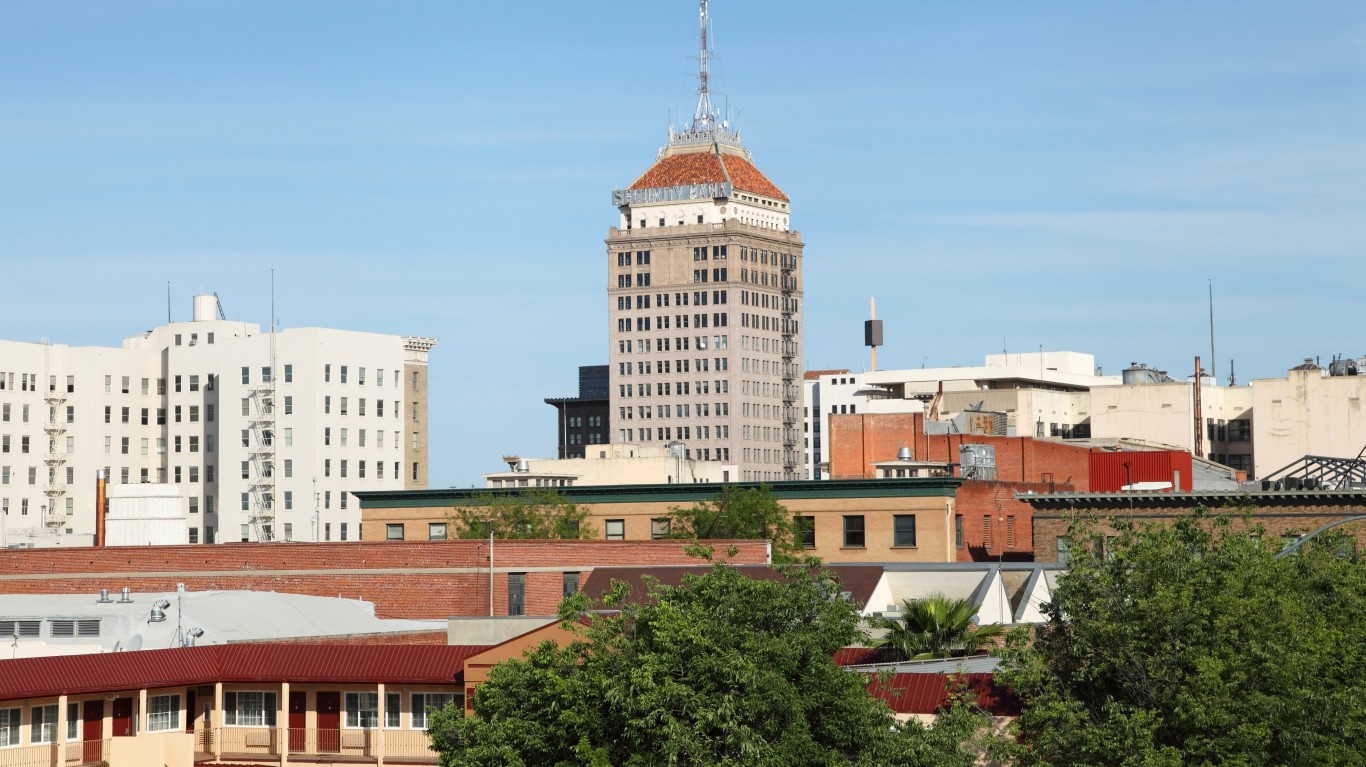
> 34. Fresno, California
> Overall score: 25.94
> Drinking places: 6.4 per 100,000
> Total population: 525,010
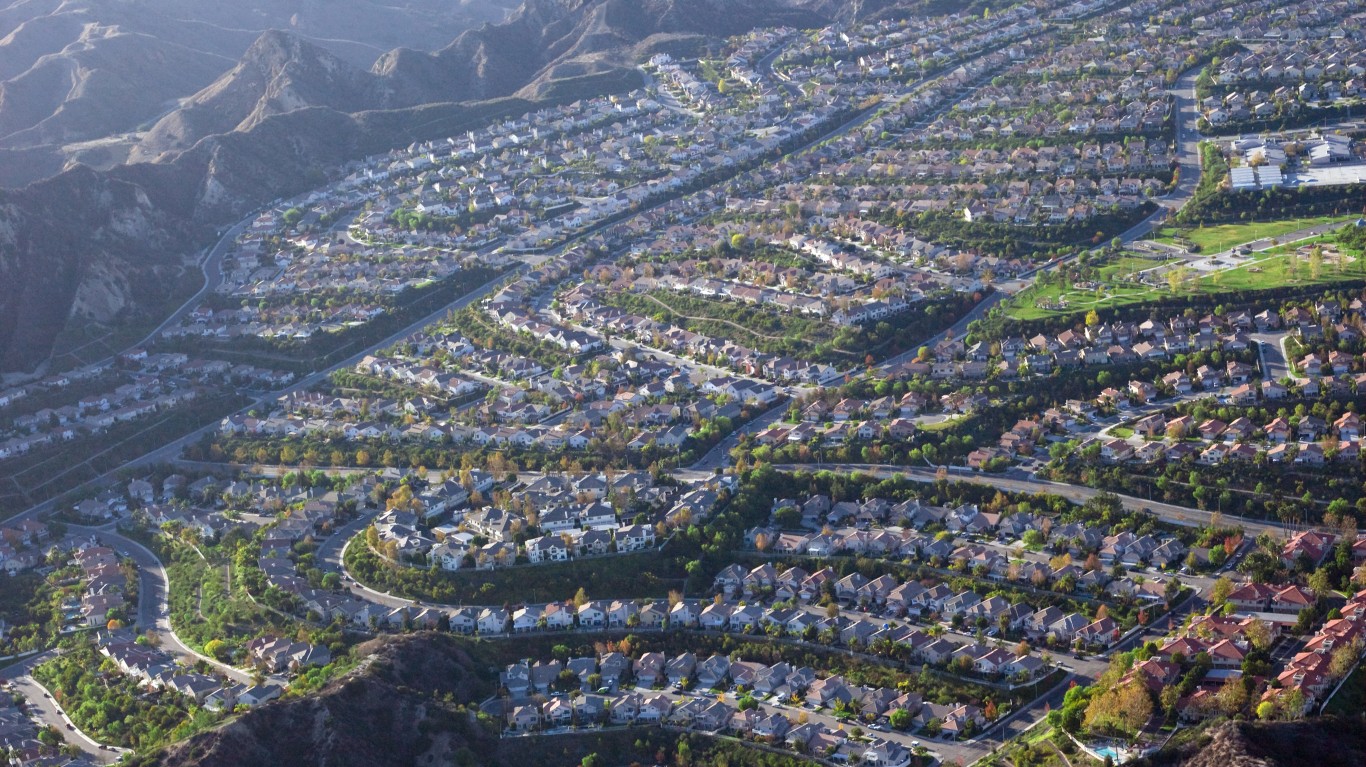
> 33. Lancaster, California
> Overall score: 25.87
> Drinking places: 7.8 per 100,000
> Total population: 159,028

> 32. Fremont, California
> Overall score: 25.85
> Drinking places: 9.8 per 100,000
> Total population: 235,740
[in-text-ad-2]
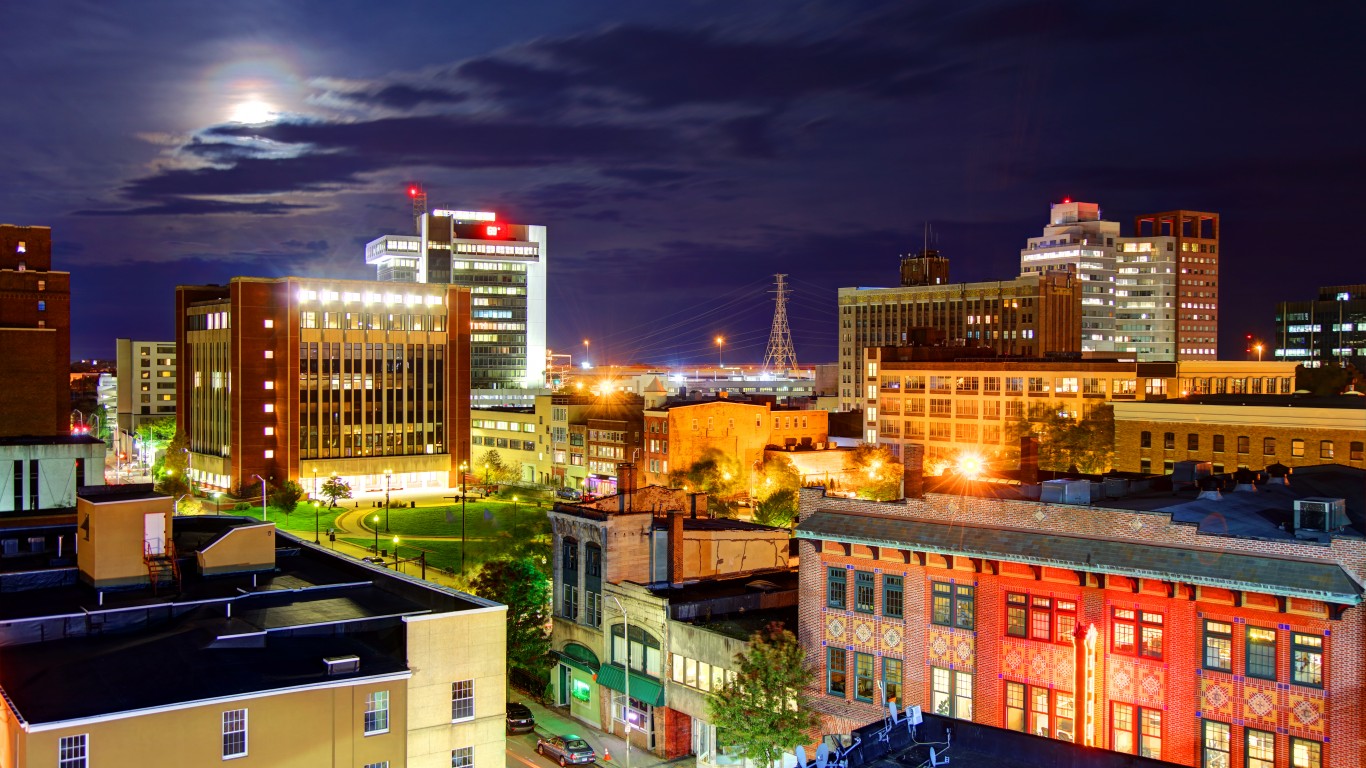
> 31. Bridgeport, Connecticut
> Overall score: 25.69
> Drinking places: 6.1 per 100,000
> Total population: 145,639
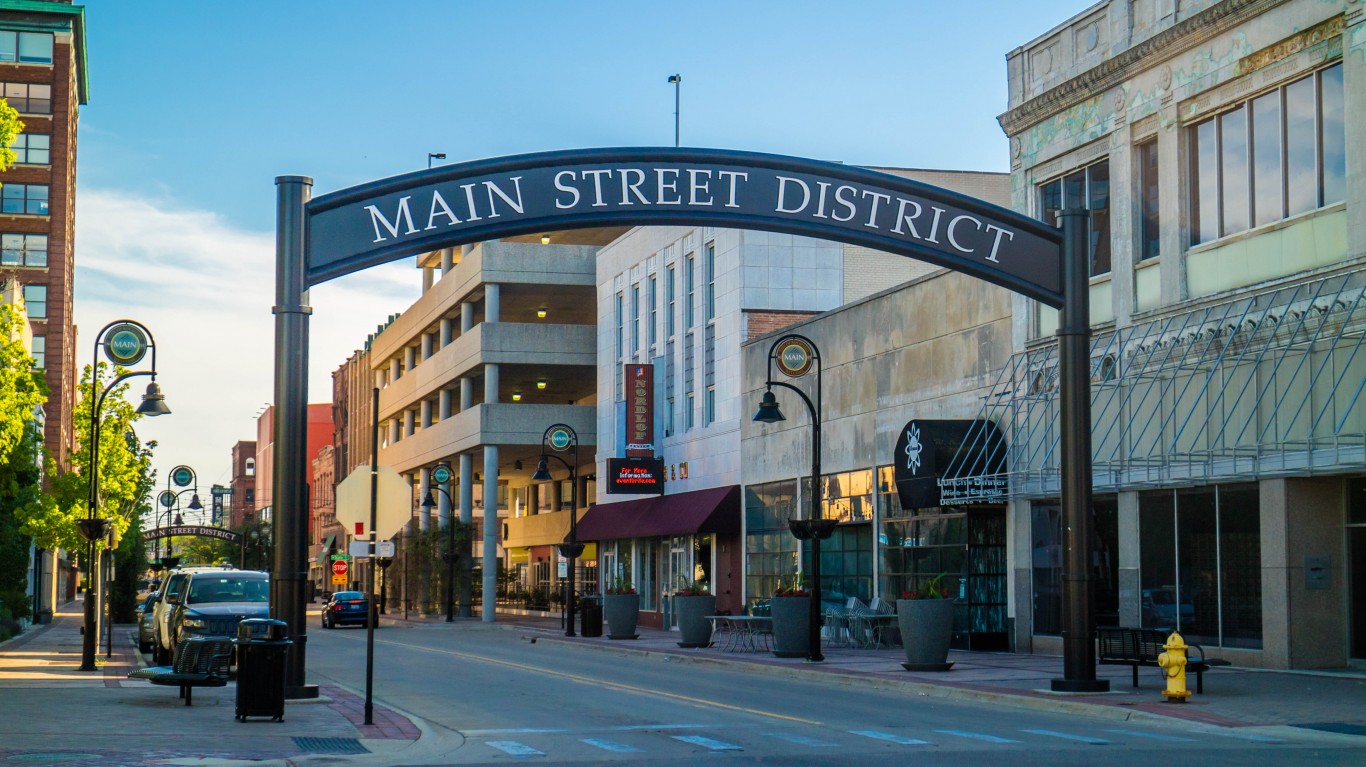
> 30. Rockford, Illinois
> Overall score: 25.64
> Drinking places: 20.0 per 100,000
> Total population: 147,070
[in-text-ad]
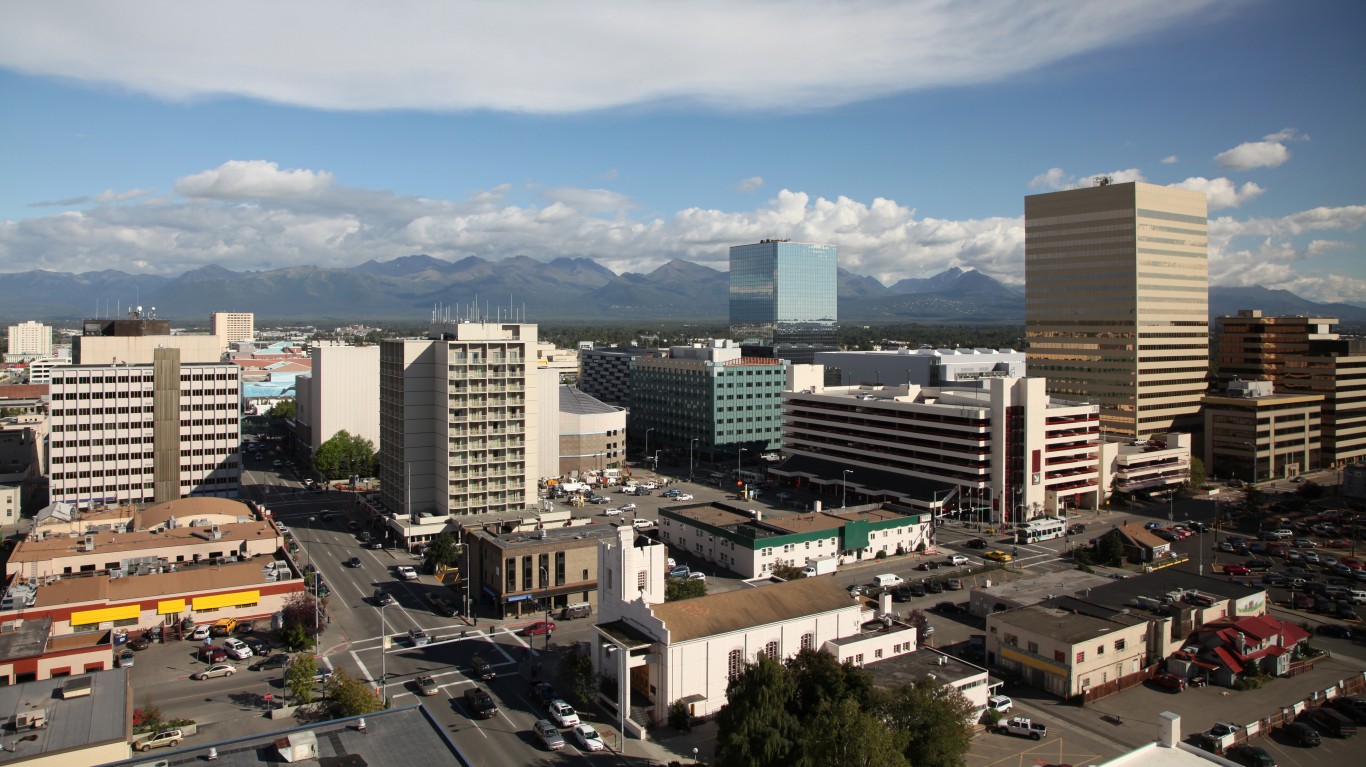
> 29. Anchorage, Alaska
> Overall score: 25.58
> Drinking places: 11.6 per 100,000
> Total population: 293,531
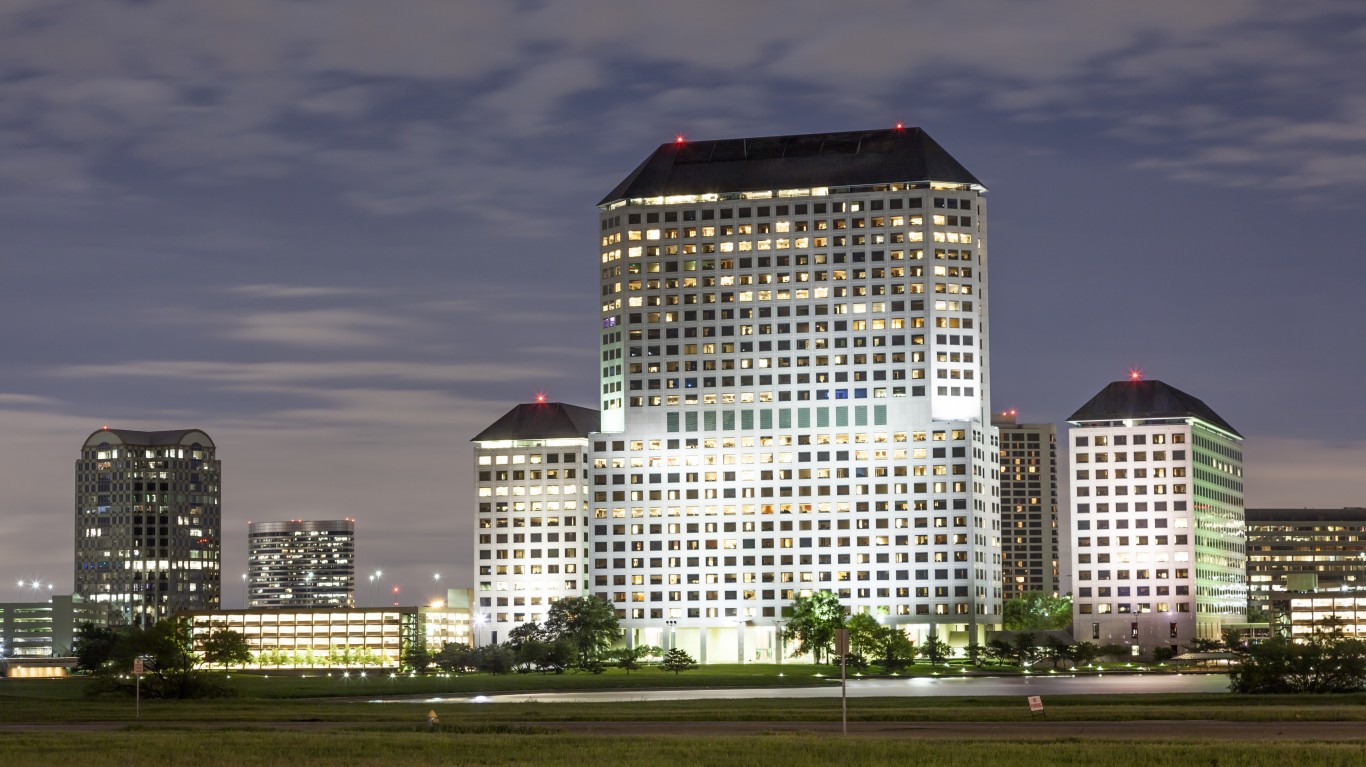
> 28. Irving, Texas
> Overall score: 25.07
> Drinking places: 9.4 per 100,000
> Total population: 239,783
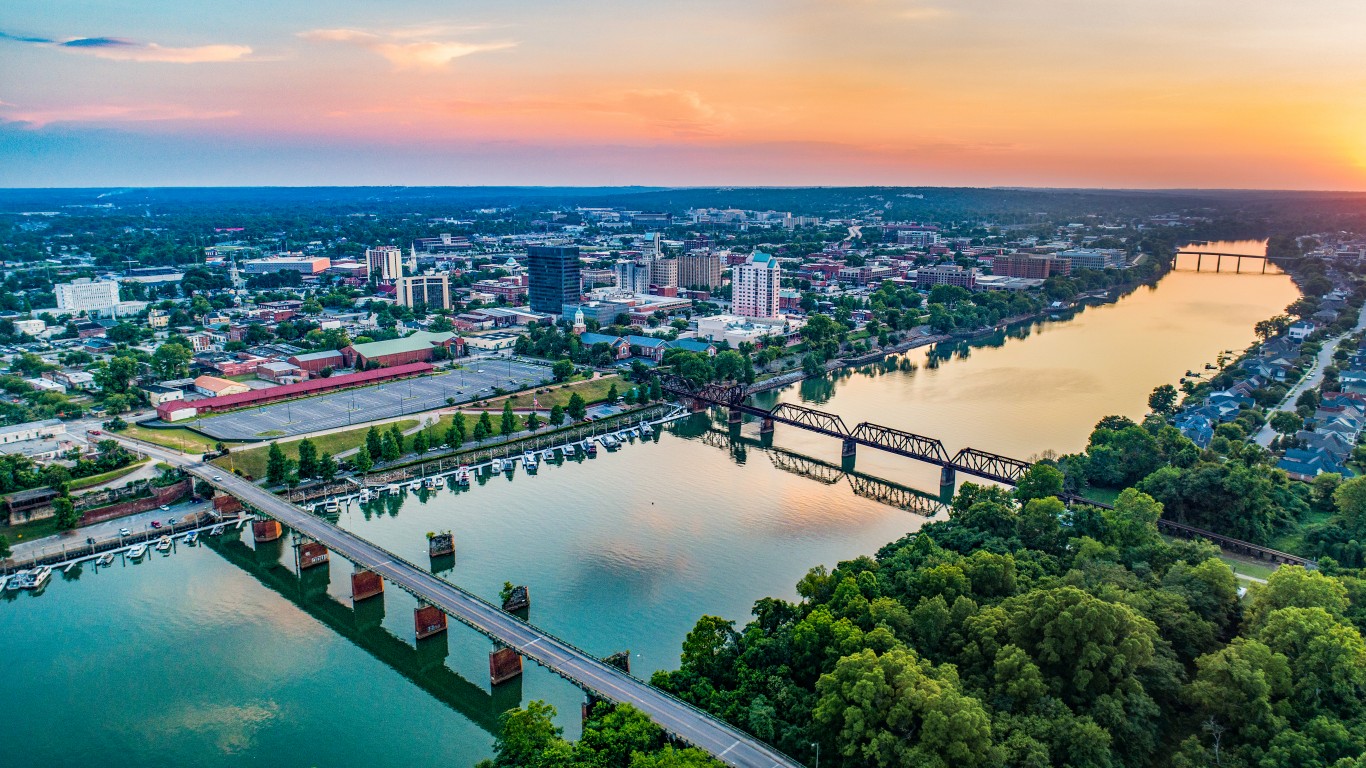
> 27. Augusta, Georgia
> Overall score: 25.05
> Drinking places: 10.4 per 100,000
> Total population: 197,191
[in-text-ad-2]
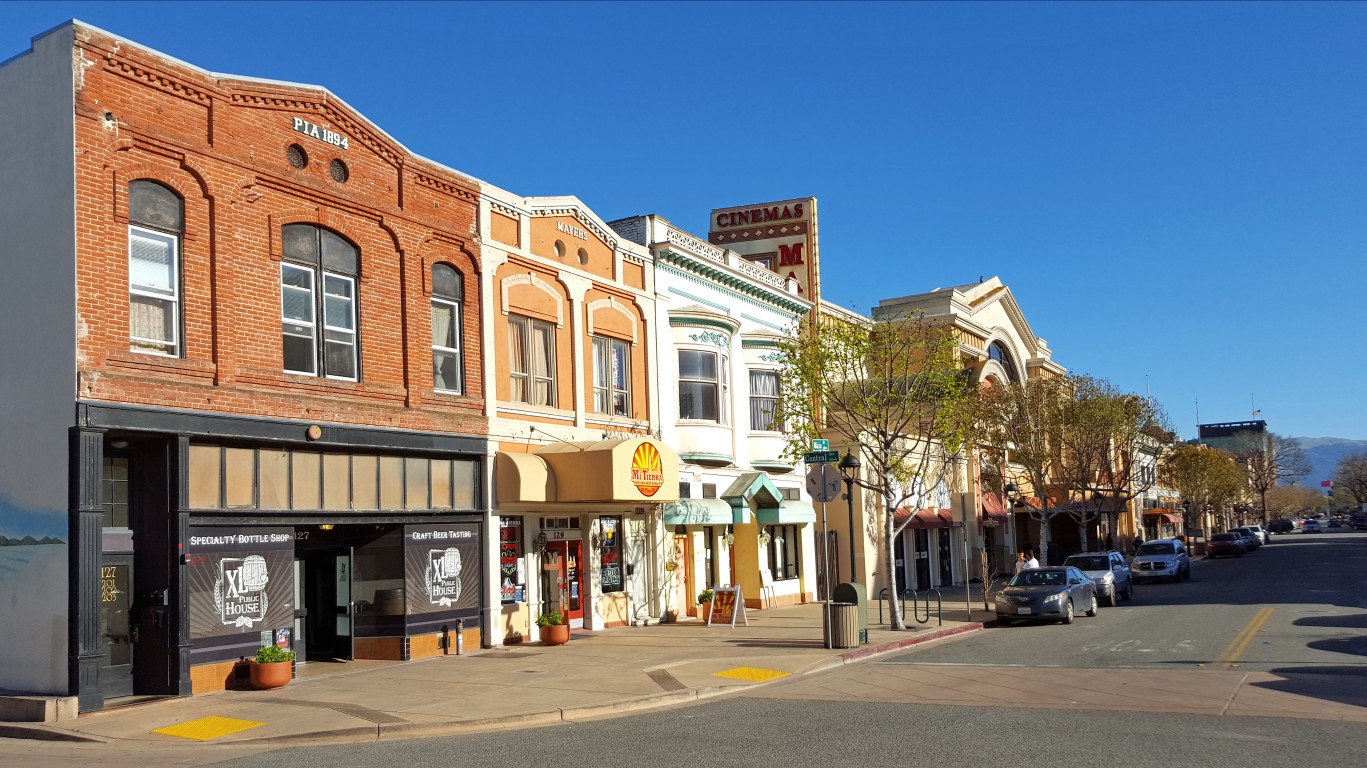
> 26. Salinas, California
> Overall score: 24.96
> Drinking places: 5.5 per 100,000
> Total population: 156,143
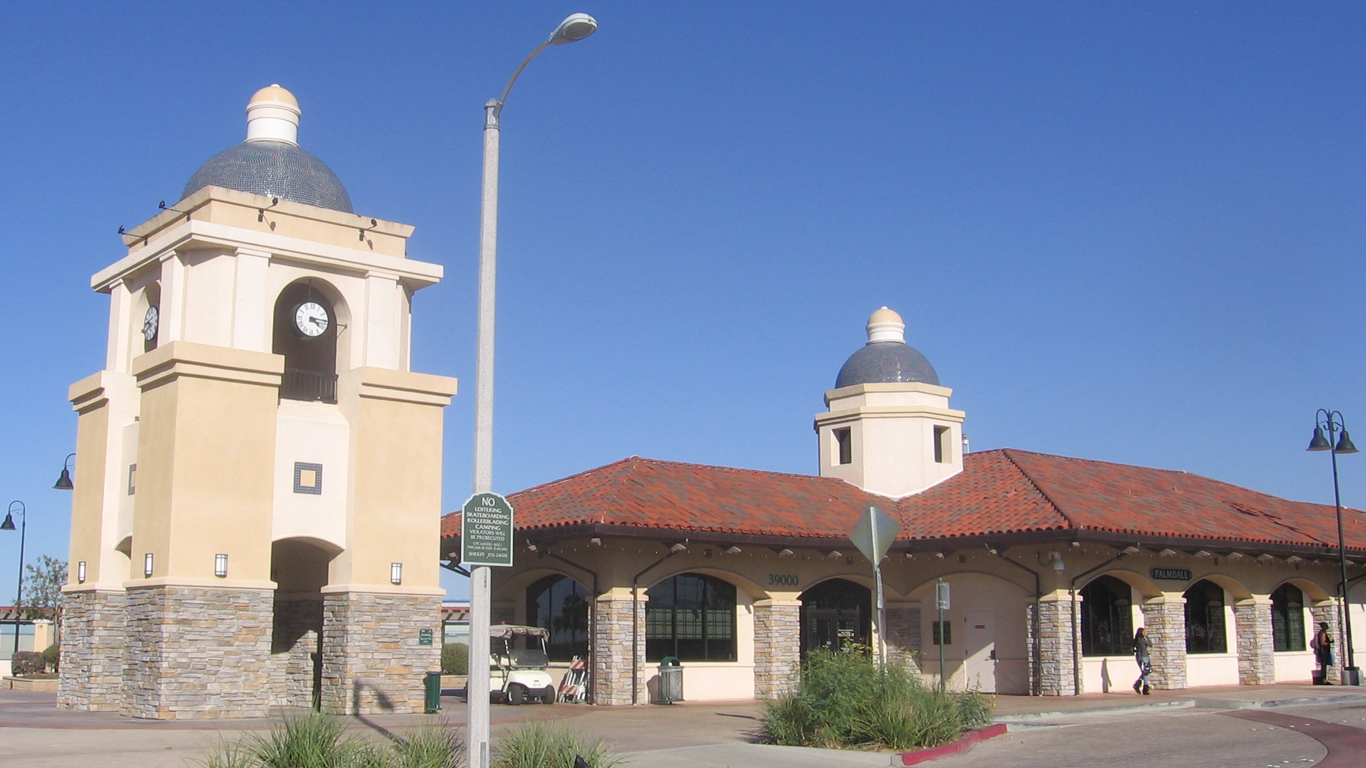
> 25. Palmdale, California
> Overall score: 24.80
> Drinking places: 7.8 per 100,000
> Total population: 156,293
[in-text-ad]
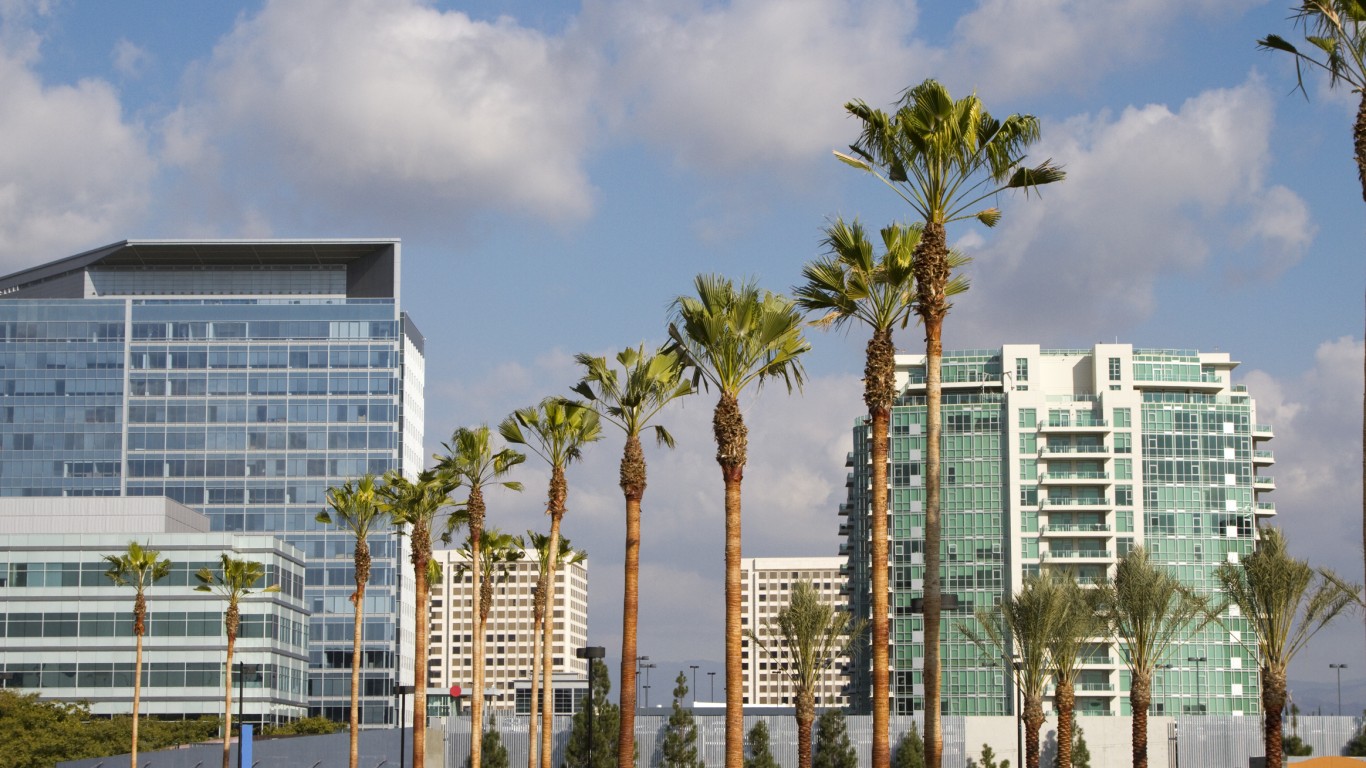
> 24. Irvine, California
> Overall score: 24.29
> Drinking places: 7.7 per 100,000
> Total population: 273,157
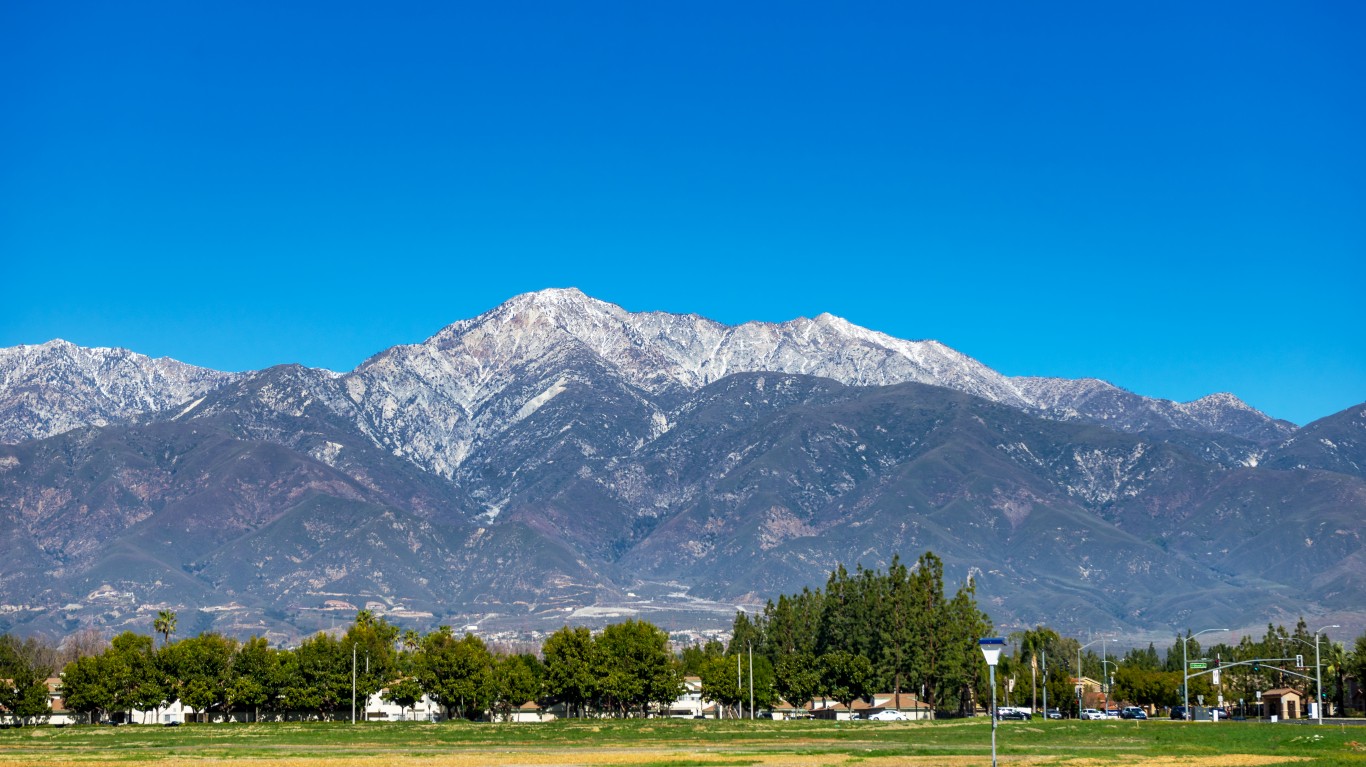
> 23. Rancho Cucamonga, California
> Overall score: 24.13
> Drinking places: 4.1 per 100,000
> Total population: 176,379
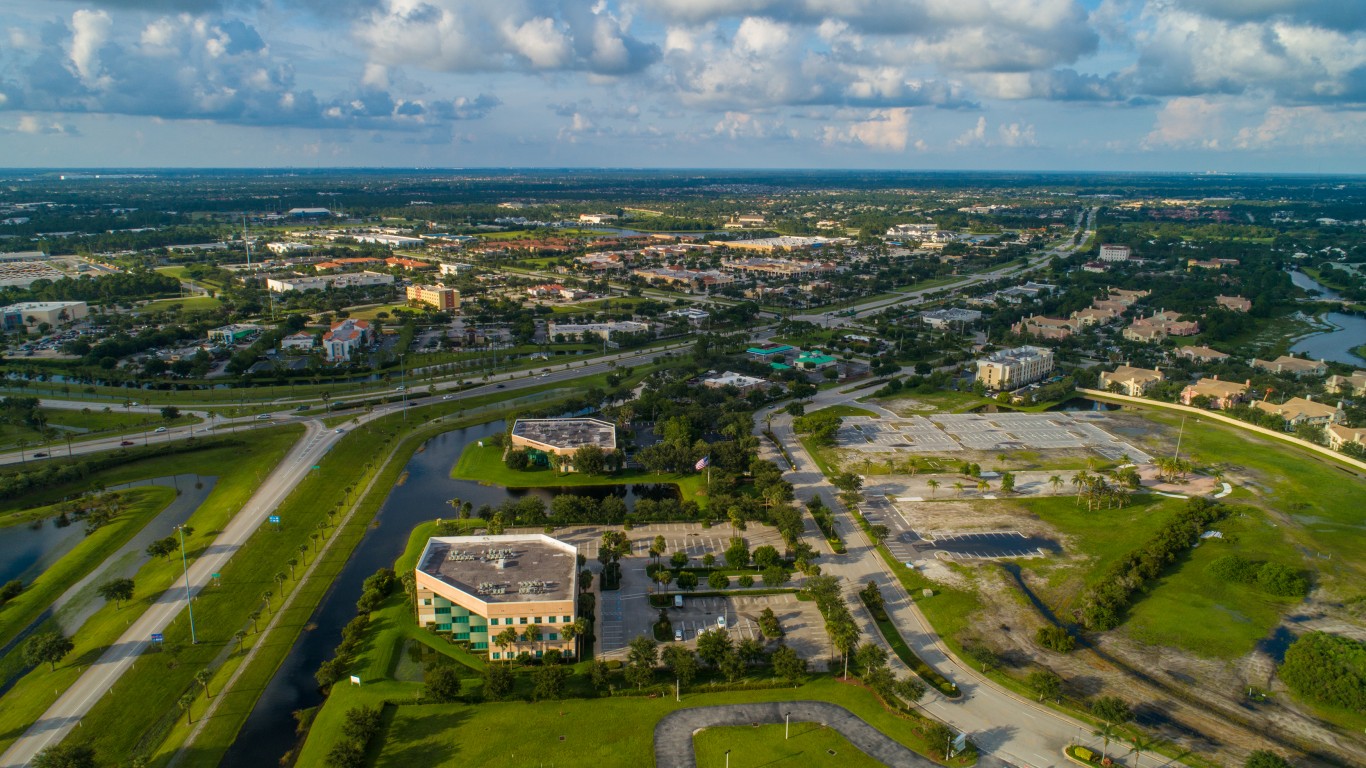
> 22. Port St. Lucie, Florida
> Overall score: 23.99
> Drinking places: 6.1 per 100,000
> Total population: 189,396
[in-text-ad-2]
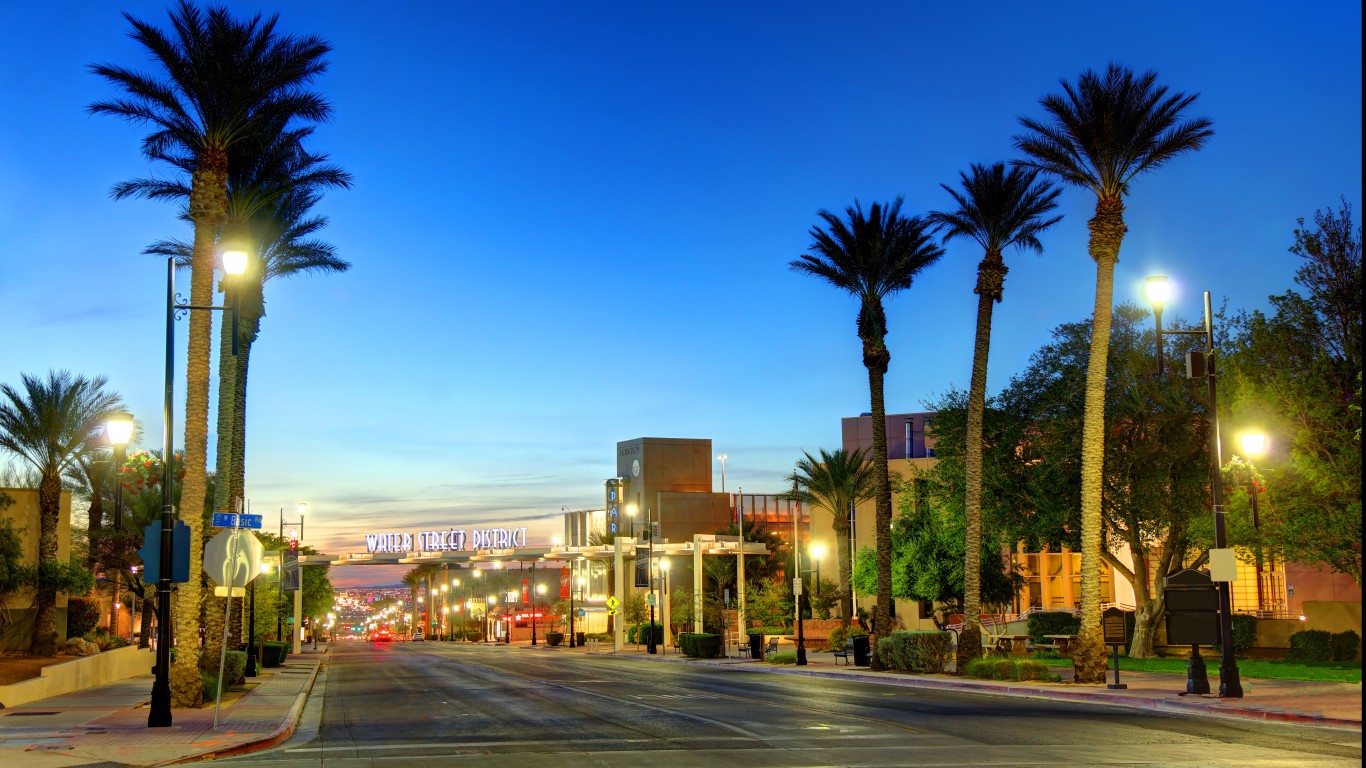
> 21. Henderson, Nevada
> Overall score: 23.79
> Drinking places: 20.5 per 100,000
> Total population: 300,116
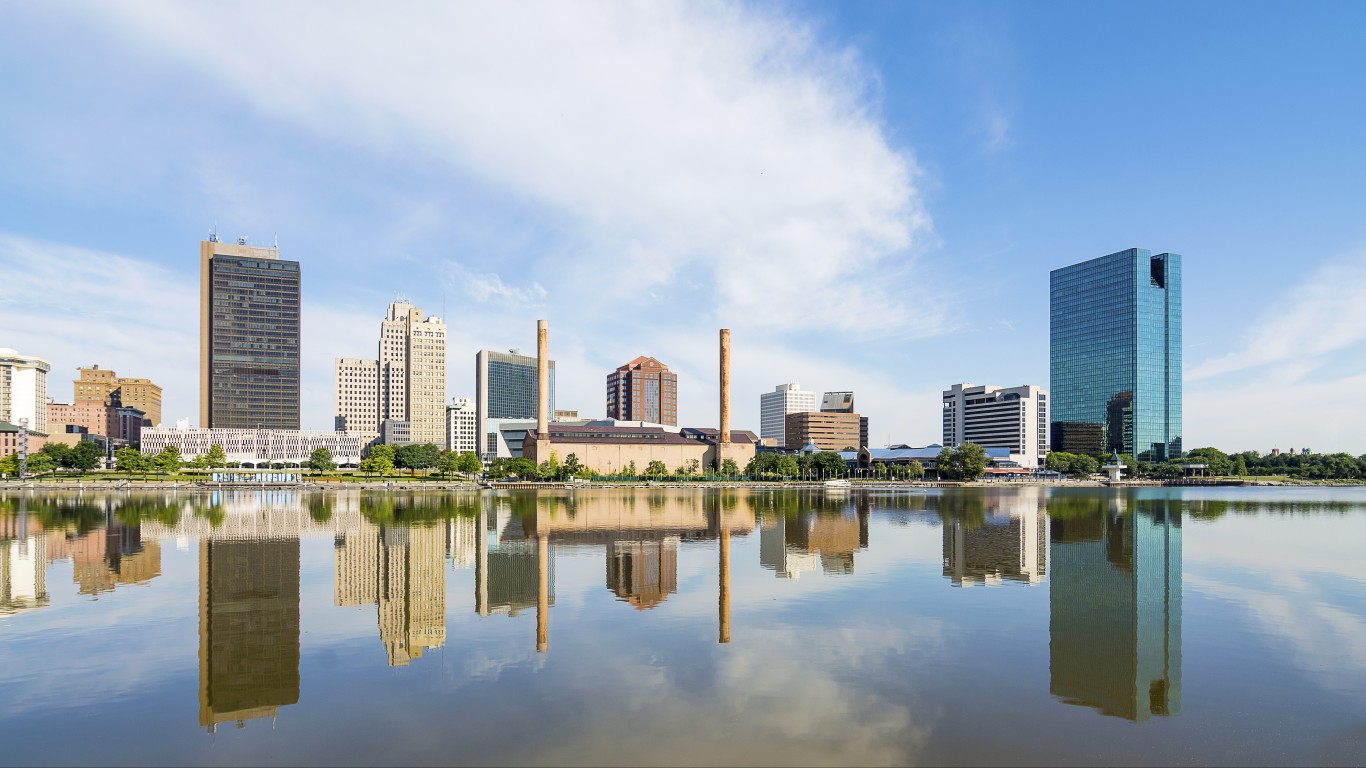
> 20. Toledo, Ohio
> Overall score: 23.65
> Drinking places: 21.6 per 100,000
> Total population: 276,614
[in-text-ad]
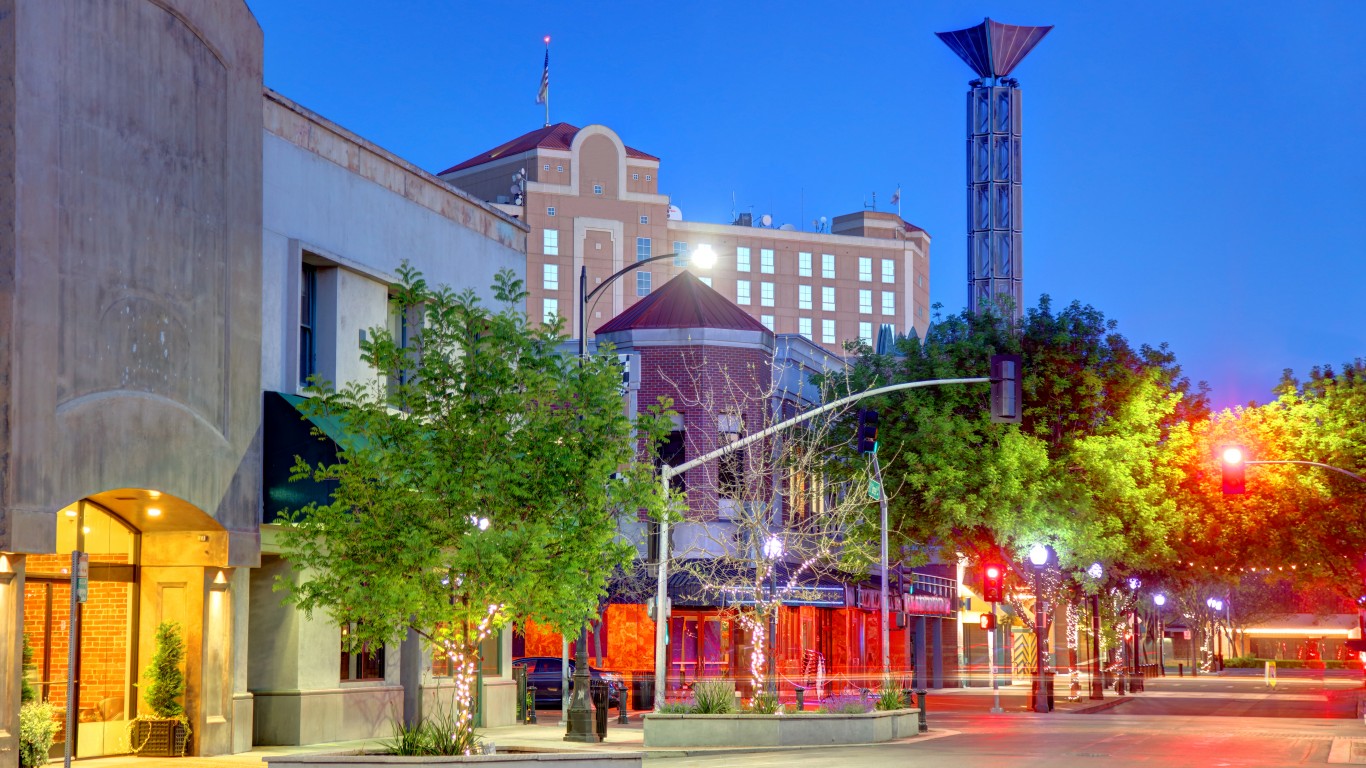
> 19. Modesto, California
> Overall score: 23.61
> Drinking places: 6.6 per 100,000
> Total population: 212,616
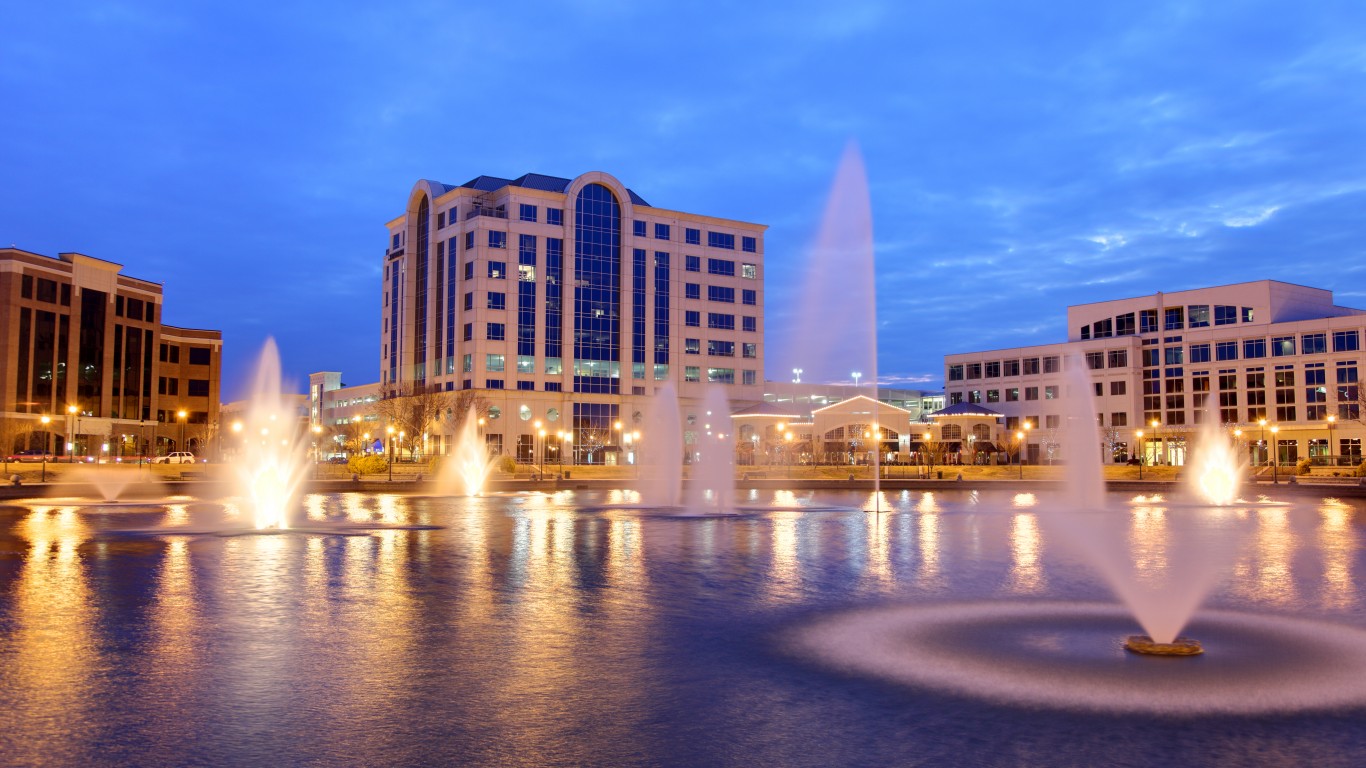
> 18. Newport News, Virginia
> Overall score: 23.33
> Drinking places: 3.3 per 100,000
> Total population: 179,673
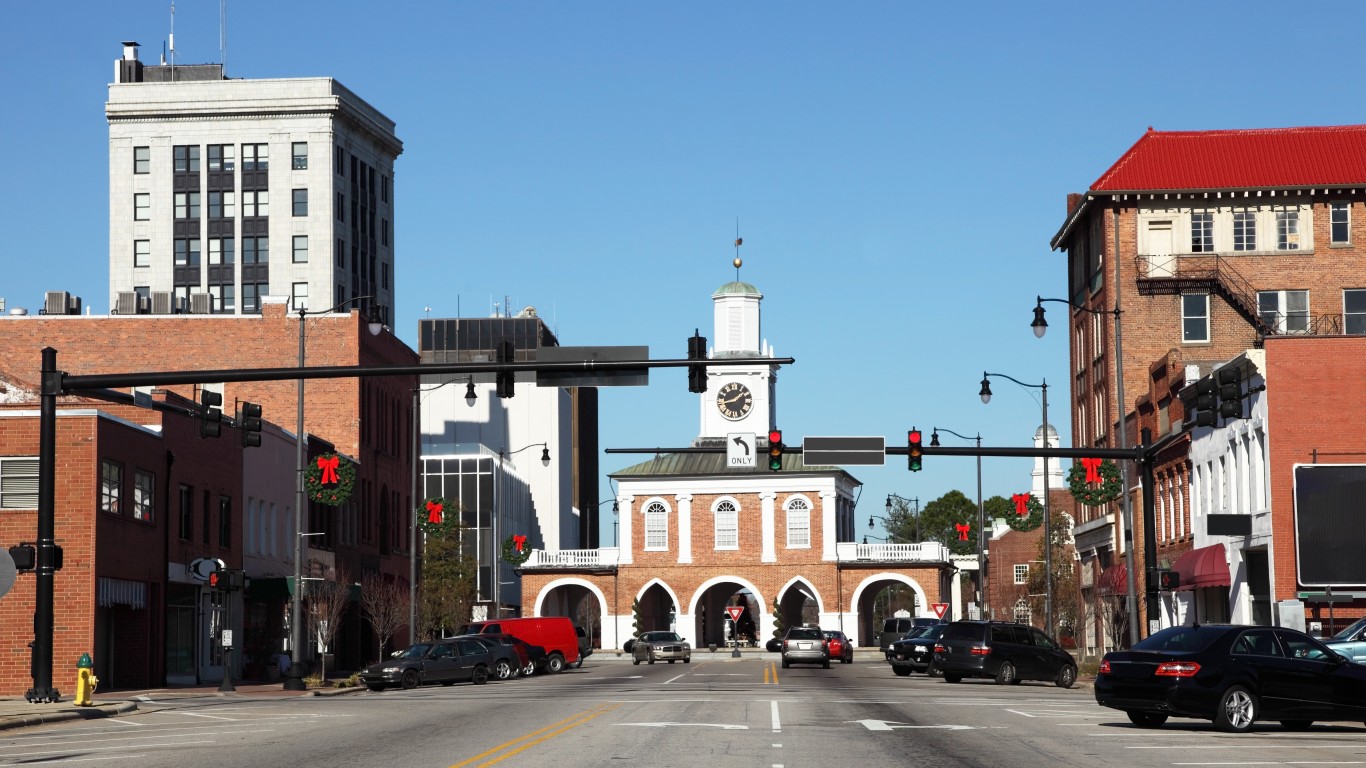
> 17. Fayetteville, North Carolina
> Overall score: 23.33
> Drinking places: 9.3 per 100,000
> Total population: 210,432
[in-text-ad-2]
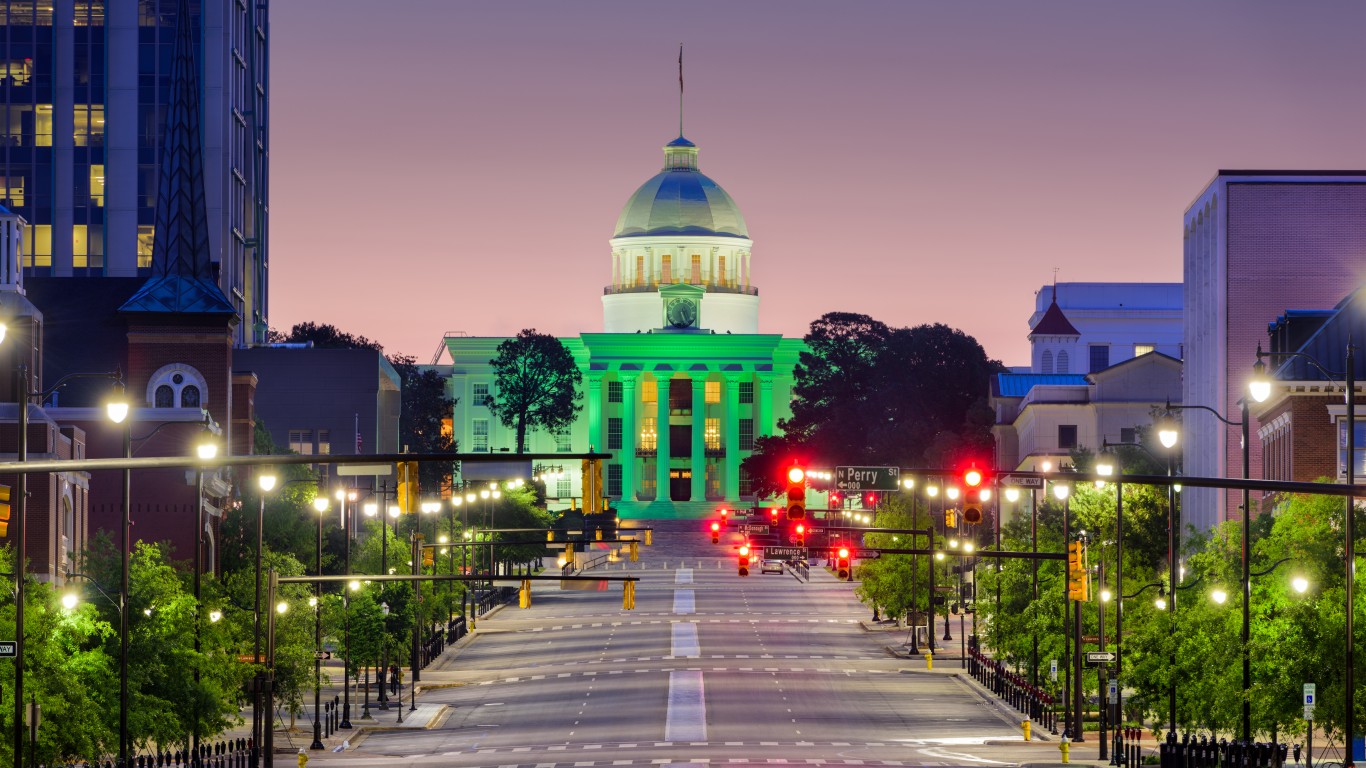
> 16. Montgomery, Alabama
> Overall score: 22.73
> Drinking places: 5.3 per 100,000
> Total population: 199,783
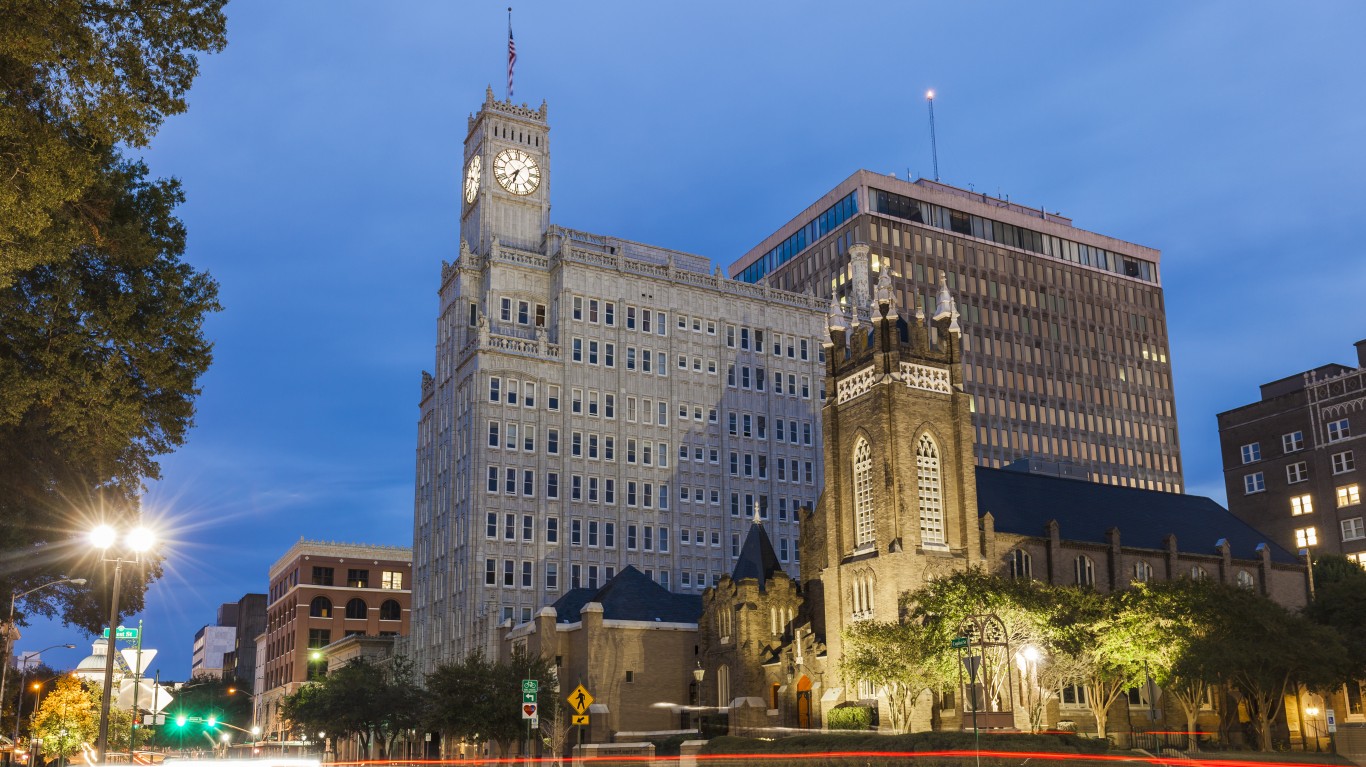
> 15. Jackson, Mississippi
> Overall score: 22.09
> Drinking places: 3.8 per 100,000
> Total population: 166,383
[in-text-ad]
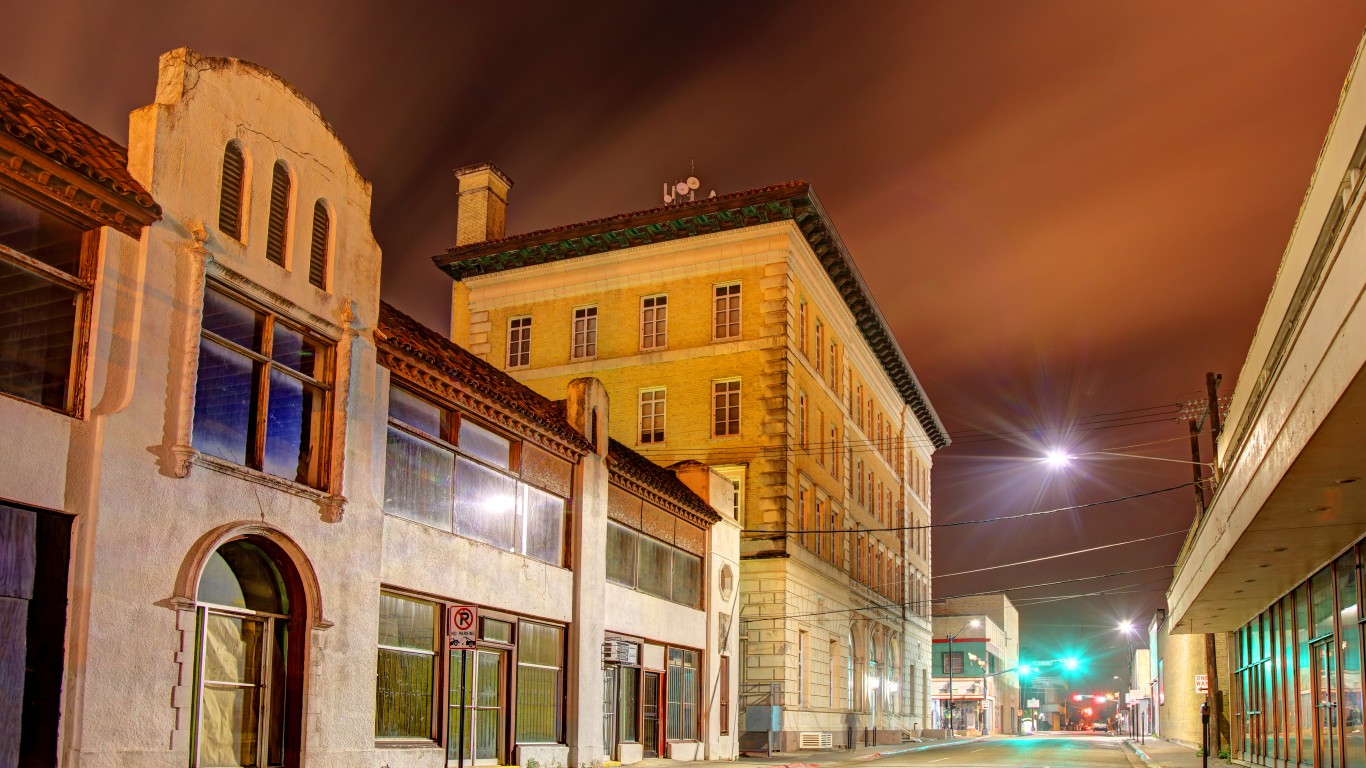
> 14. Brownsville, Texas
> Overall score: 22.08
> Drinking places: 8.8 per 100,000
> Total population: 182,271
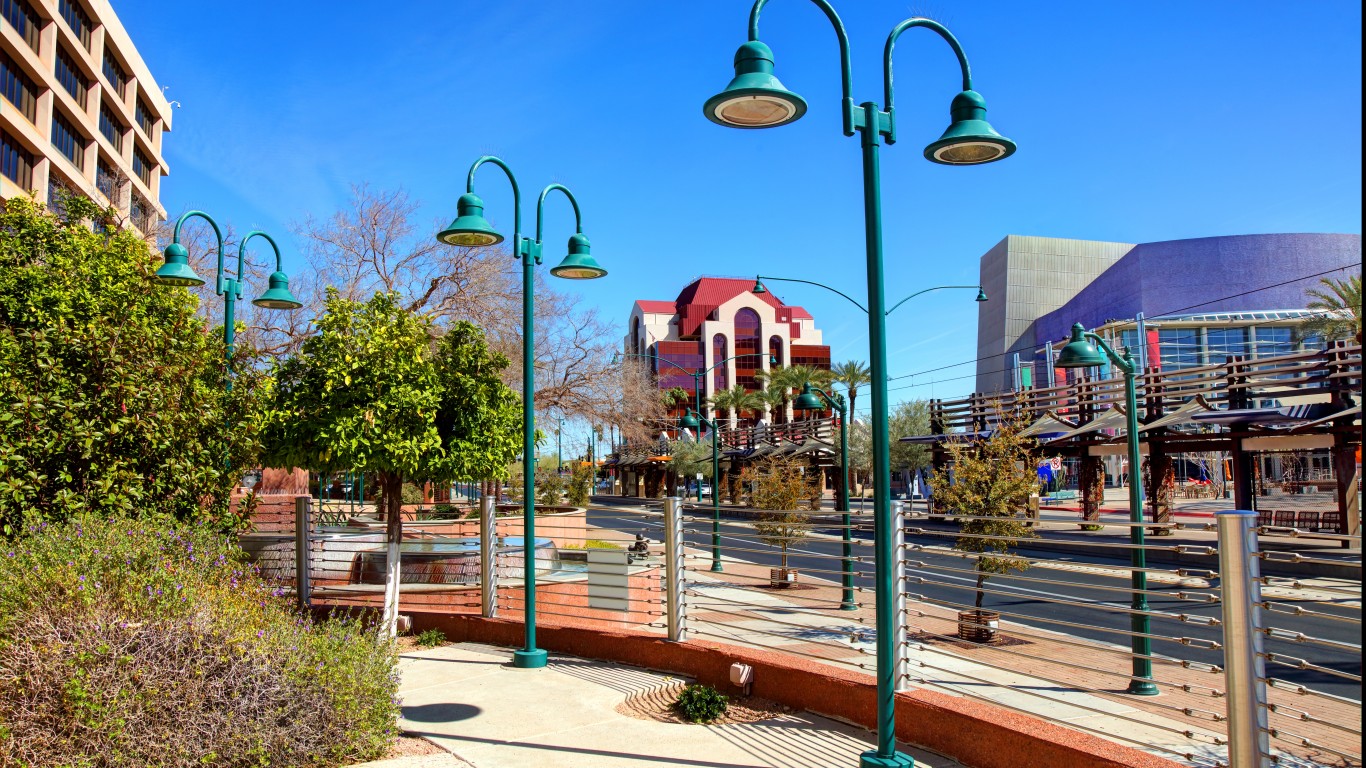
> 13. Mesa, Arizona
> Overall score: 22.00
> Drinking places: 7.9 per 100,000
> Total population: 499,720
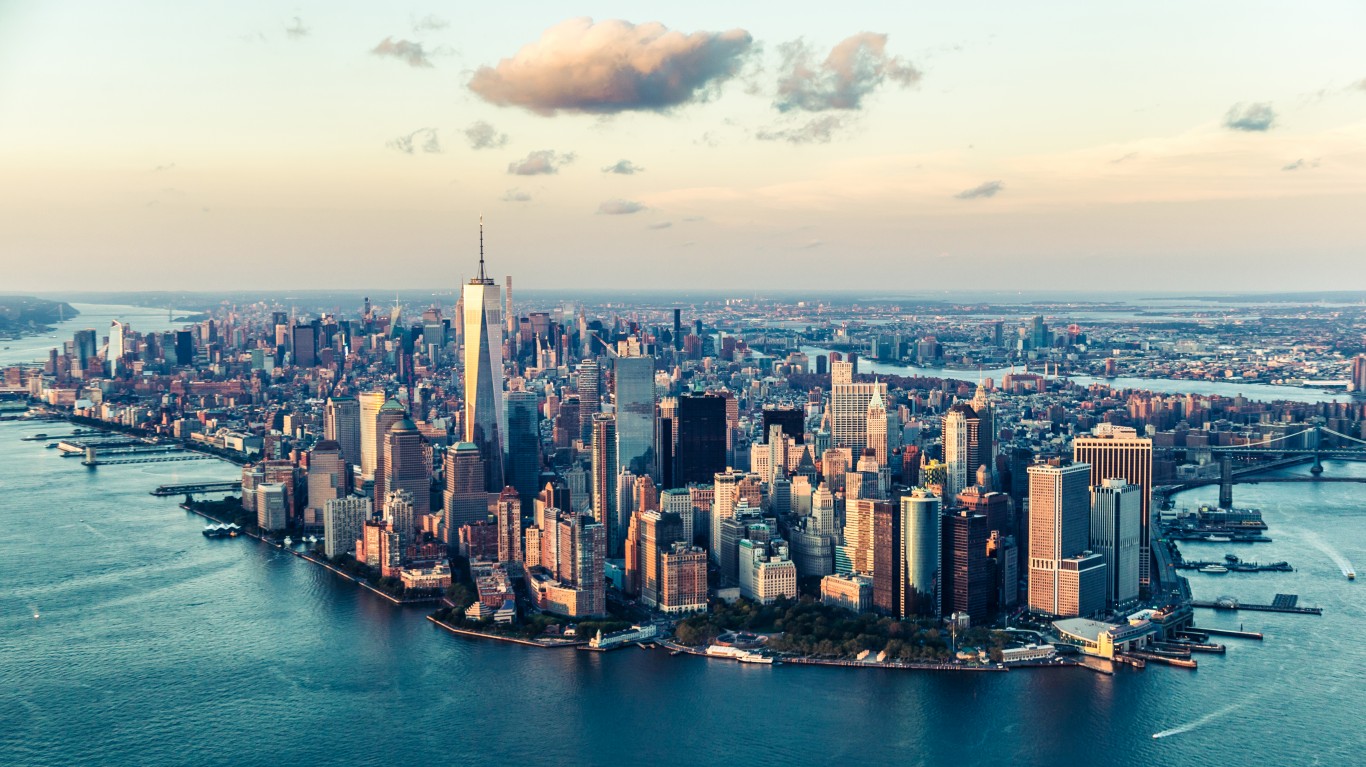
> 12. New York, New York
> Overall score: 22.00
> Drinking places: 13.6 per 100,000
> Total population: 8.4 million
[in-text-ad-2]
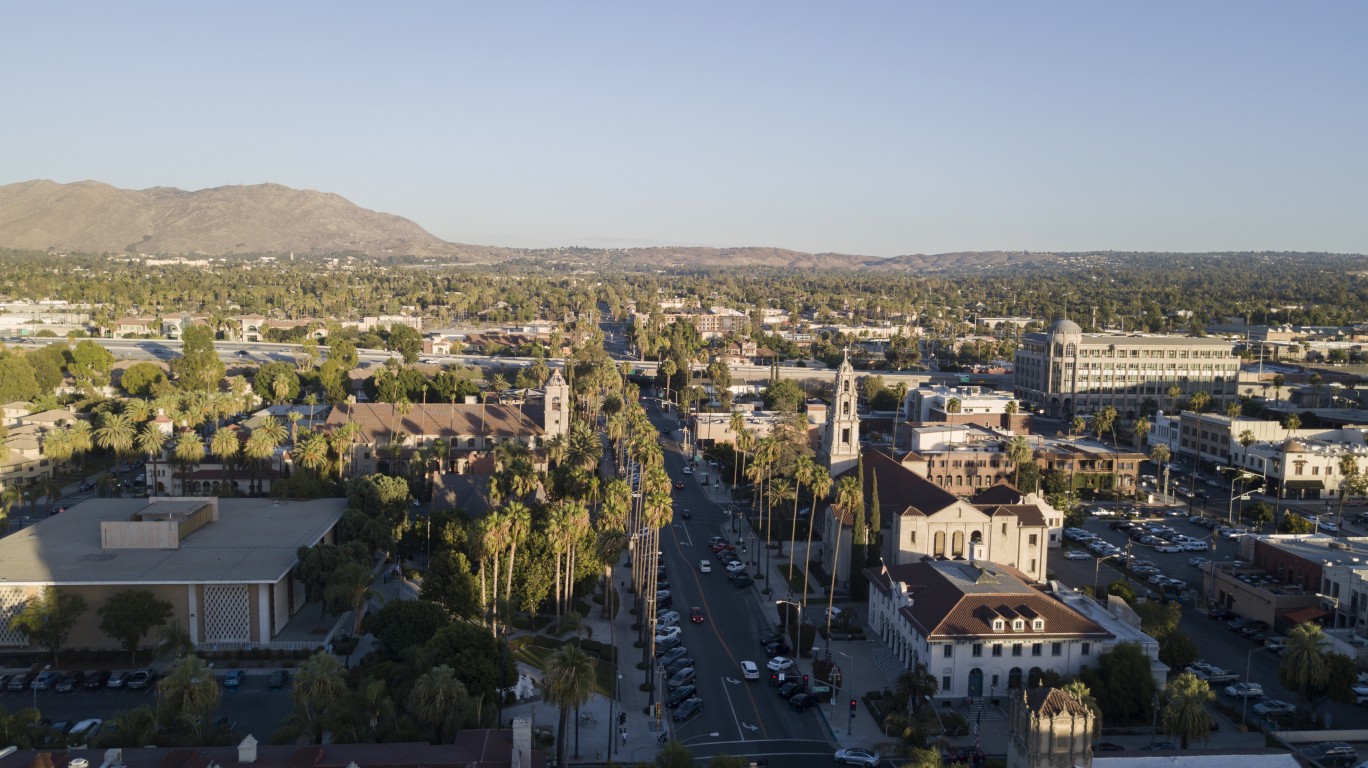
> 11. Riverside, California
> Overall score: 21.54
> Drinking places: 4.1 per 100,000
> Total population: 326,414
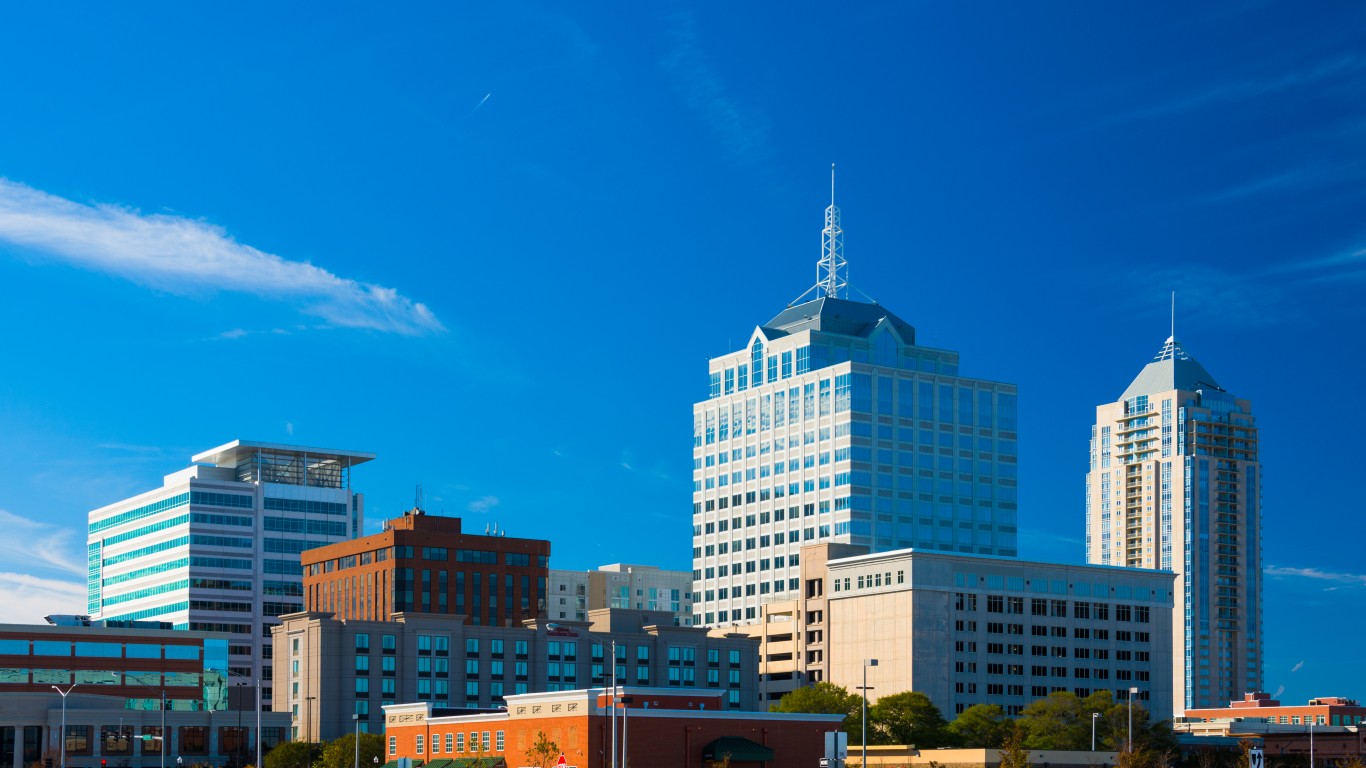
> 10. Virginia Beach, Virginia
> Overall score: 21.19
> Drinking places: 4.4 per 100,000
> Total population: 450,201
[in-text-ad]
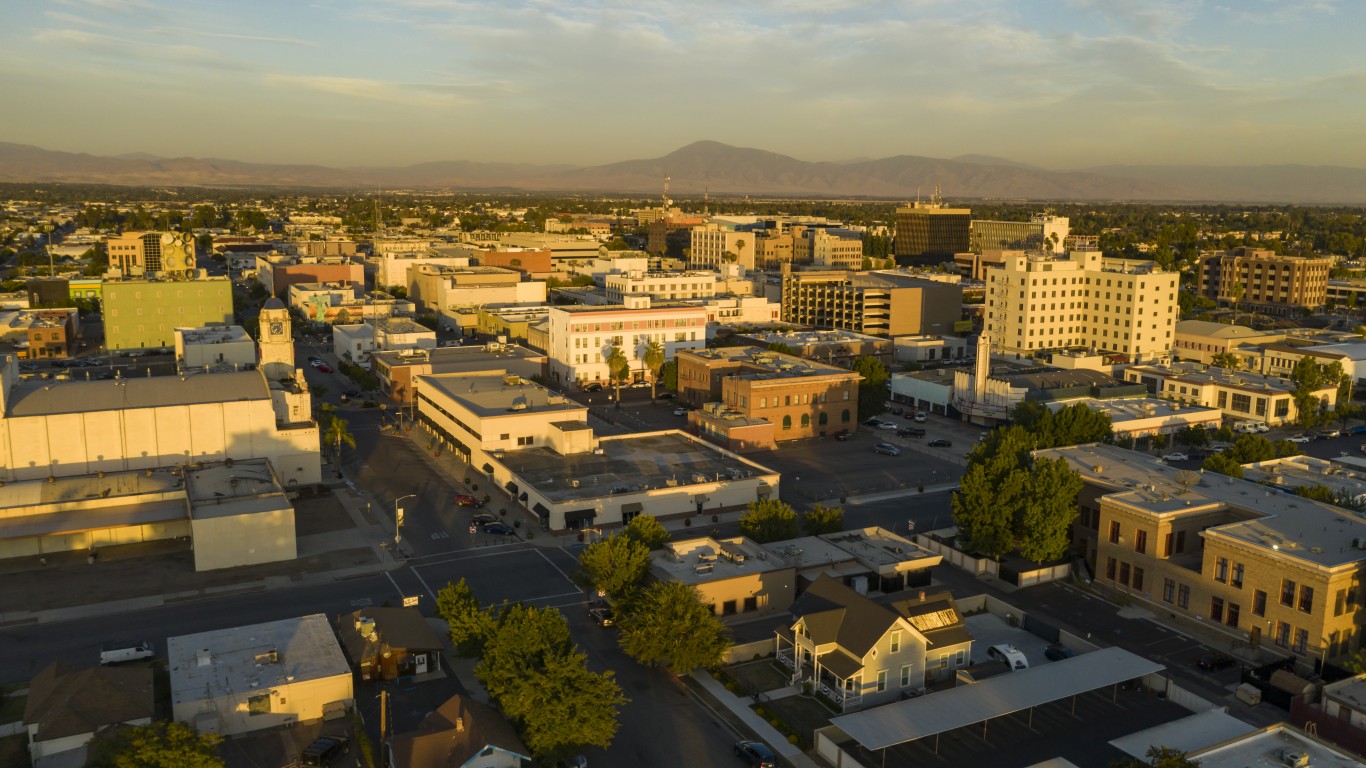
> 9. Bakersfield, California
> Overall score: 21.02
> Drinking places: 6.1 per 100,000
> Total population: 377,917
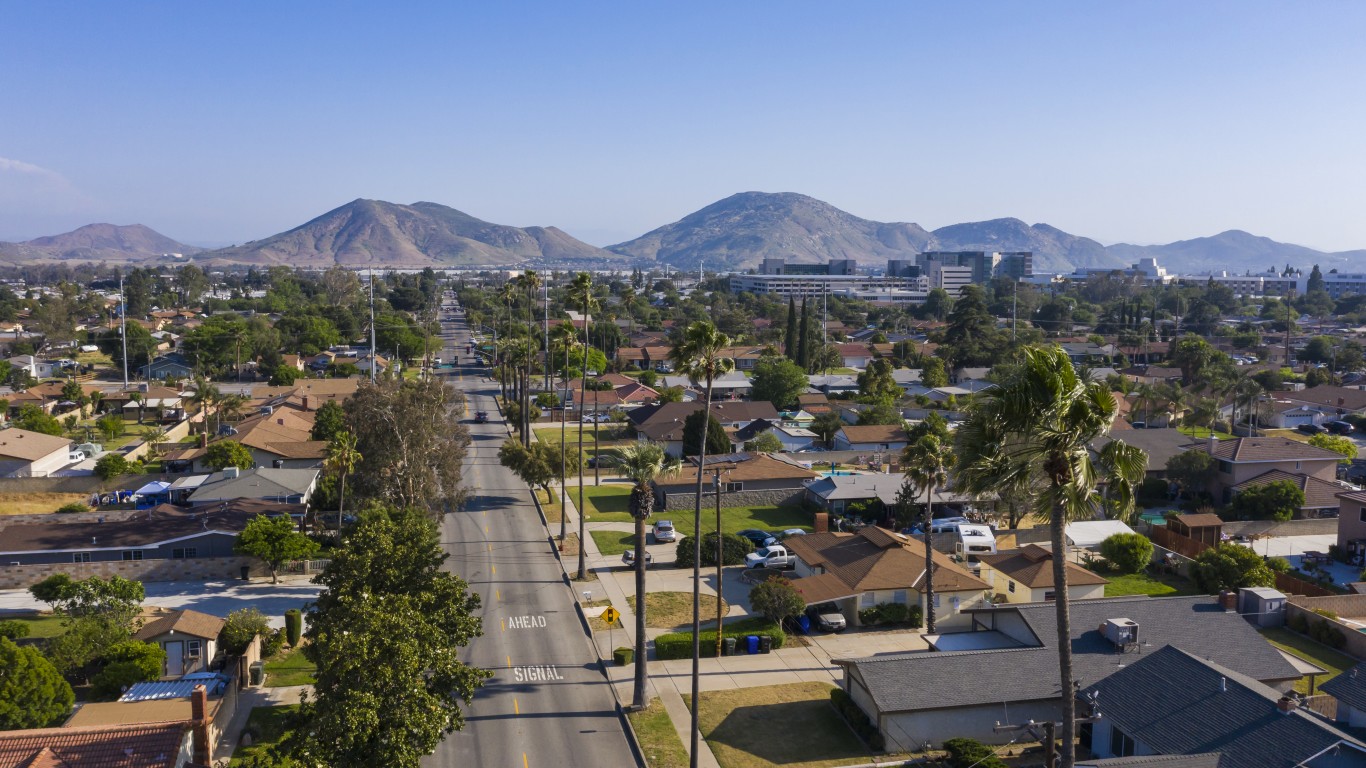
> 8. Fontana, California
> Overall score: 21.01
> Drinking places: 4.1 per 100,000
> Total population: 210,759
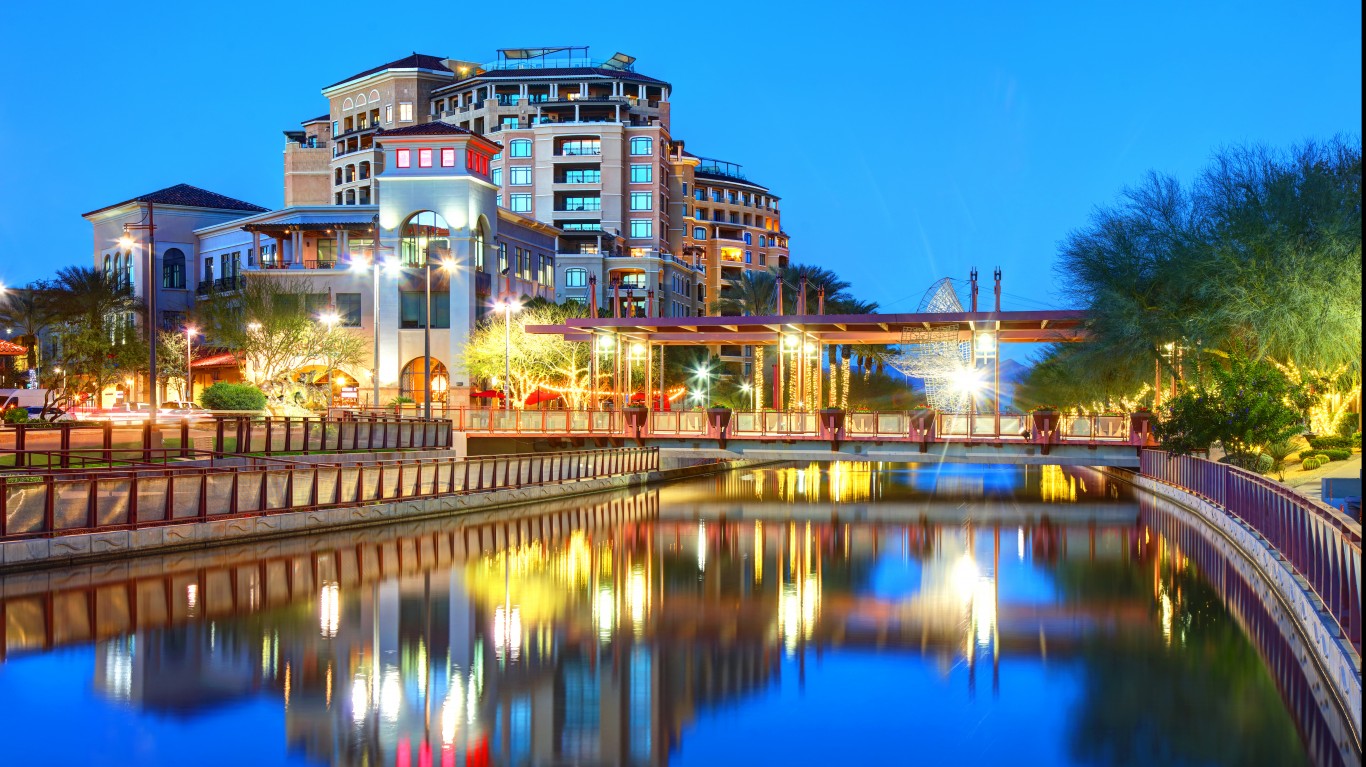
> 7. Scottsdale, Arizona
> Overall score: 20.96
> Drinking places: 7.9 per 100,000
> Total population: 250,602
[in-text-ad-2]
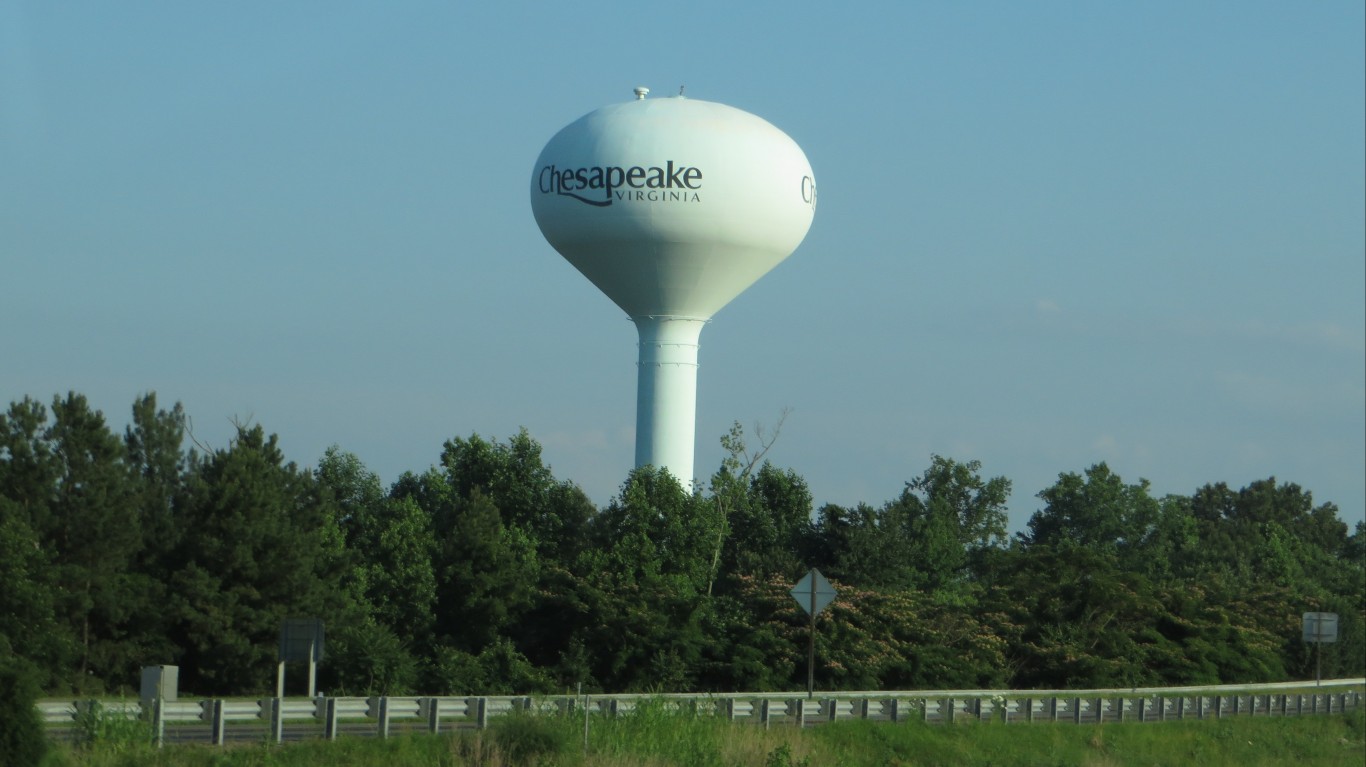
> 6. Chesapeake, Virginia
> Overall score: 20.55
> Drinking places: 2.5 per 100,000
> Total population: 239,982
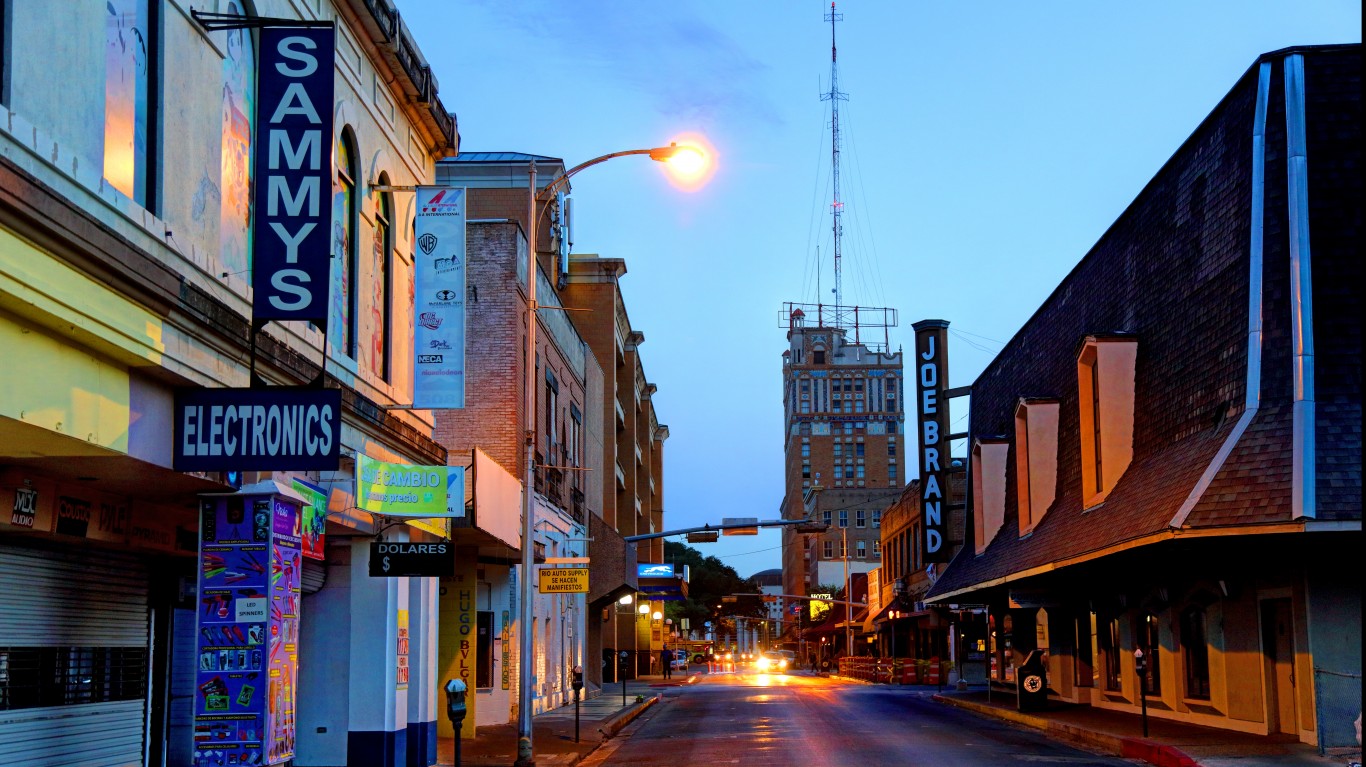
> 5. Laredo, Texas
> Overall score: 19.05
> Drinking places: 5.5 per 100,000
> Total population: 259,151
[in-text-ad]
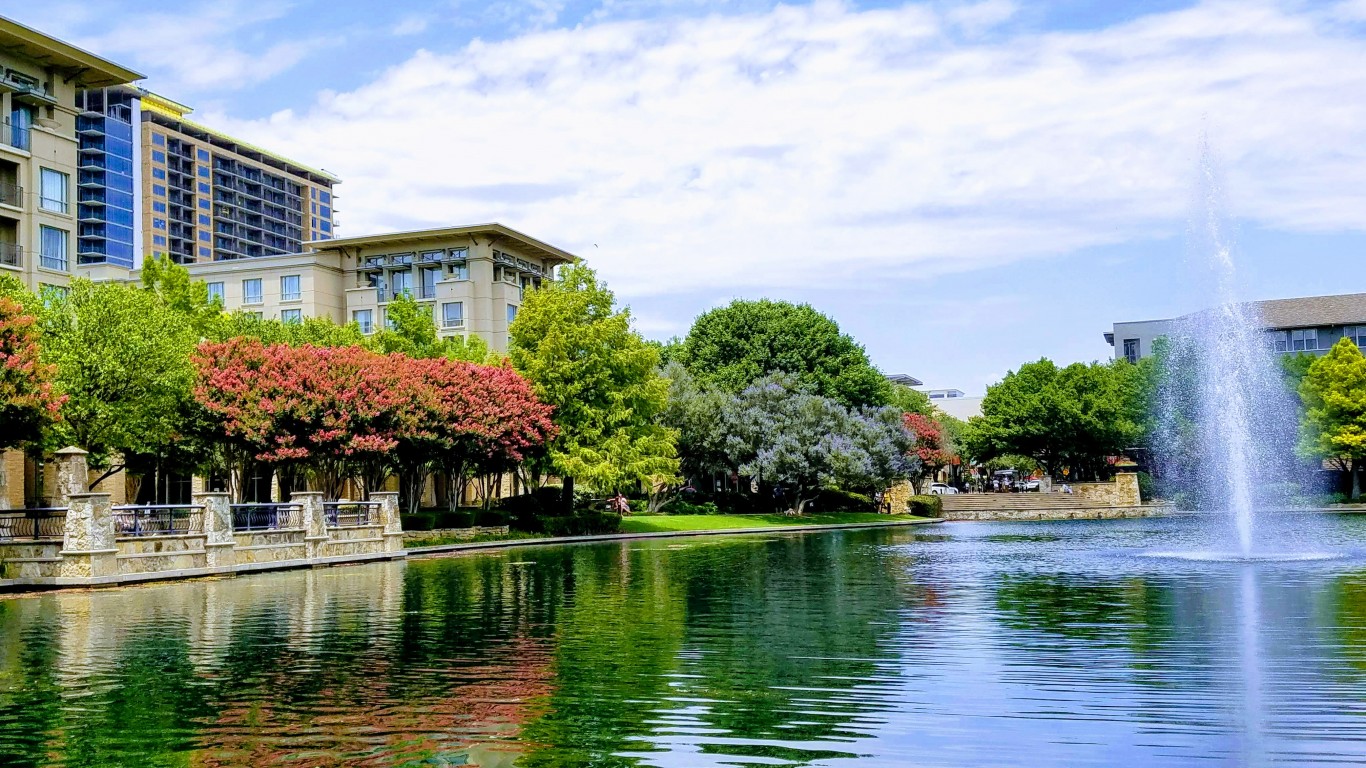
> 4. Plano, Texas
> Overall score: 18.38
> Drinking places: 2.8 per 100,000
> Total population: 287,064
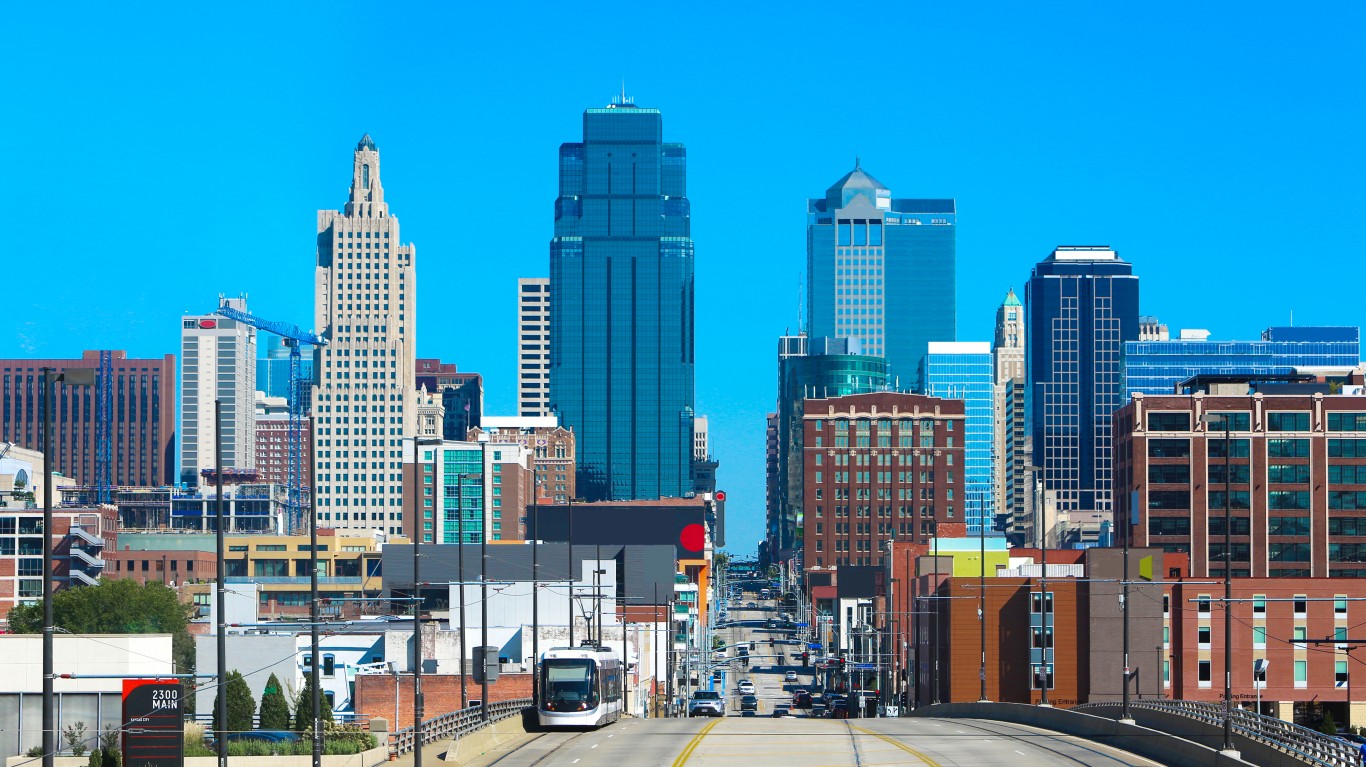
> 3. Kansas City, Kansas
> Overall score: 17.80
> Drinking places: 9.1 per 100,000
> Total population: 152,522
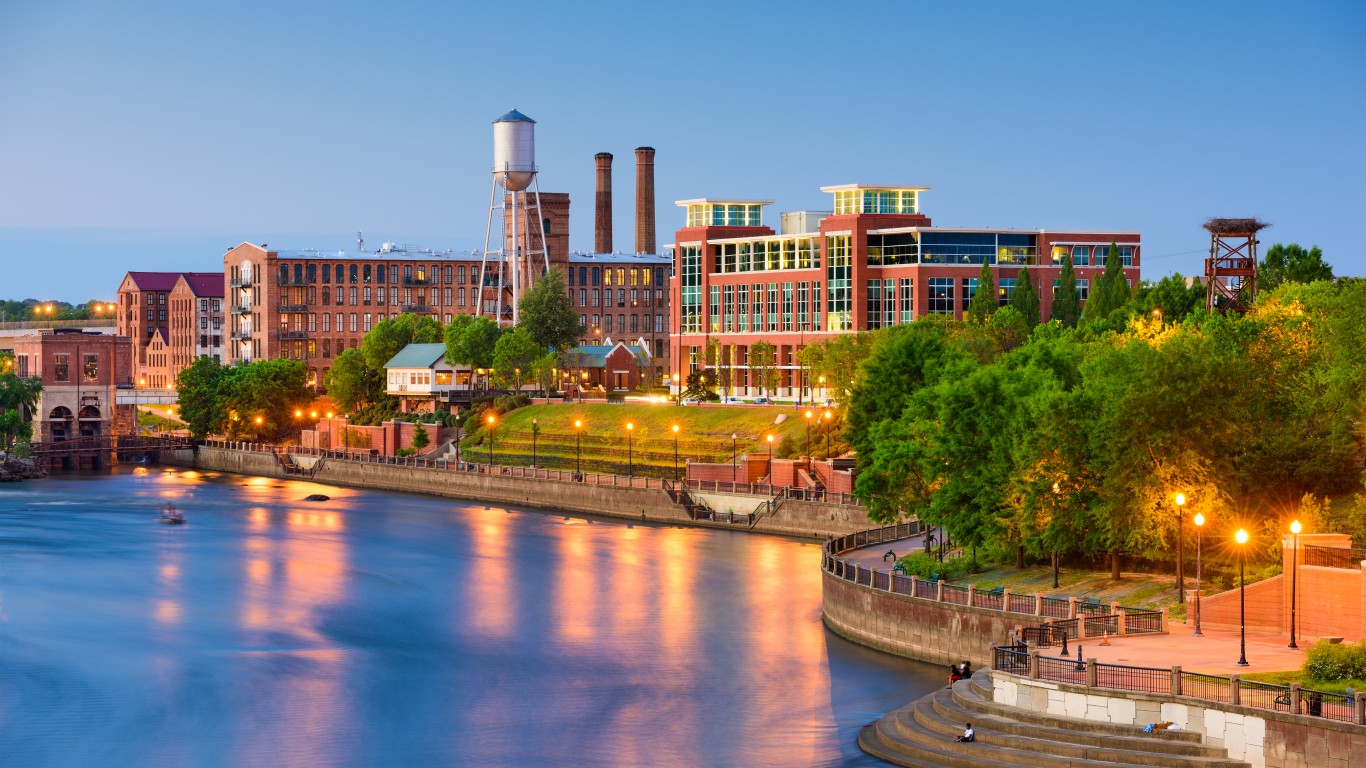
> 2. Columbus, Georgia
> Overall score: 17.07
> Drinking places: 9.7 per 100,000
> Total population: 195,739
[in-text-ad-2]
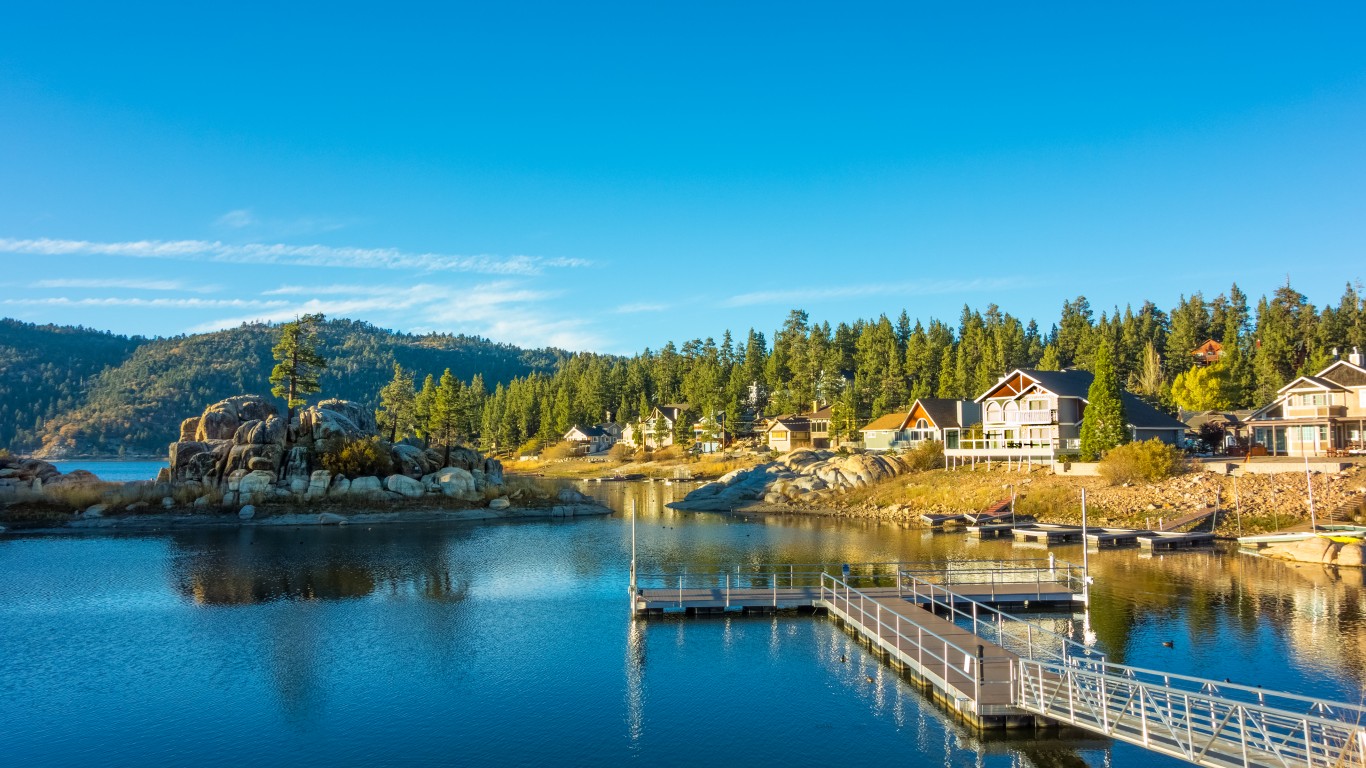
> 1. San Bernardino, California
> Overall score: 14.46
> Drinking places: 4.1 per 100,000
> Total population: 216,089
To determine the 50 worst American cities for beer lovers, 24/7 Tempo reviewed data from lawn care company Lawn Love’s 2021 Best Cities for Beer Lovers. The 180 largest U.S. cities were ranked based on 21 measures assessing the access to, quality of, and cost of beer and beer establishments, as well as community. 24/7 Tempo added data on the number of drinking places in the city and surrounding county from the U.S. Census Bureau’s 2019 County Business Patterns and was adjusted for population using five-year data from the Census Bureau’s 2019 American Community Survey.
Are You Still Paying With a Debit Card?
The average American spends $17,274 on debit cards a year, and it’s a HUGE mistake. First, debit cards don’t have the same fraud protections as credit cards. Once your money is gone, it’s gone. But more importantly you can actually get something back from this spending every time you swipe.
Issuers are handing out wild bonuses right now. With some you can earn up to 5% back on every purchase. That’s like getting a 5% discount on everything you buy!
Our top pick is kind of hard to imagine. Not only does it pay up to 5% back, it also includes a $200 cash back reward in the first six months, a 0% intro APR, and…. $0 annual fee. It’s quite literally free money for any one that uses a card regularly. Click here to learn more!
Flywheel Publishing has partnered with CardRatings to provide coverage of credit card products. Flywheel Publishing and CardRatings may receive a commission from card issuers.
Thank you for reading! Have some feedback for us?
Contact the 24/7 Wall St. editorial team.
 24/7 Wall St.
 24/7 Wall St.
 24/7 Wall St.
 24/7 Wall St.
 24/7 Wall St.