
The United States has some of the highest levels of income and wealth inequality in the world. U.S. Federal Reserve data shows that the wealthiest 10% of Americans control $93.8 trillion, more than double the $40.3 trillion in the hands of the remaining 90% of Americans.
The income and wealth divide only appears to be growing wider. A January 2020 report published by the Pew Research Center found that over the last four decades, income growth for the top 5% of families by earnings has far outpaced income growth for families in lower income strata.
While in a nation as large as the U.S. high levels of income inequality may be expected, there are small pockets of the country in which extreme wealth and extreme poverty exist side by side. Even at the town level, income inequality can be far more pronounced than it is on average nationwide.
Using data from the U.S. Census Bureau’s 2019 American Community Survey, 24/7 Wall St. identified the 50 U.S. towns with the widest income gaps. Towns are ranked by their Gini coefficient, a measure of income inequality based on the distribution of income across a population on a 0 to 1 scale — 0 representing perfect equality and 1 representing the highest possible level of inequality. For the purposes of this story, towns are defined as any place covered by the census with populations between 1,000 and 25,000.
Among the places on this list, Gini scores are as high as 0.771 — well above the national Gini coefficient of 0.482. These towns are largely concentrated in Southern states, including six in Florida and five in Georgia.
Causes behind rising inequality are complex and varied. A report published by the National Bureau of Economic Research ties the rising disparity to a range of economic factors, including globalization, technological advancement, a stagnant minimum wage, and the decline of labor unions.
Click here to see America’s towns with the widest income gaps
Click here to see our detailed methodology
50. Dyersburg, Tennessee
> Gini index: 0.584
> Avg. household income, top 20%: $207,983 — 2,277th highest of 7,632 towns
> Avg. household income, bottom 20%: $7,538 — 590th lowest of 7,632 towns
> Share of all income in Dyersburg that went to top 20%: 61.3% — 55th highest of 7,632 towns
> Share of all income in Dyersburg that went to bottom 20%: 2.2% — 240th lowest of 7,632 towns (tied)
> Median household income: $38,614 — 1,102nd lowest of 7,696 towns
[in-text-ad]
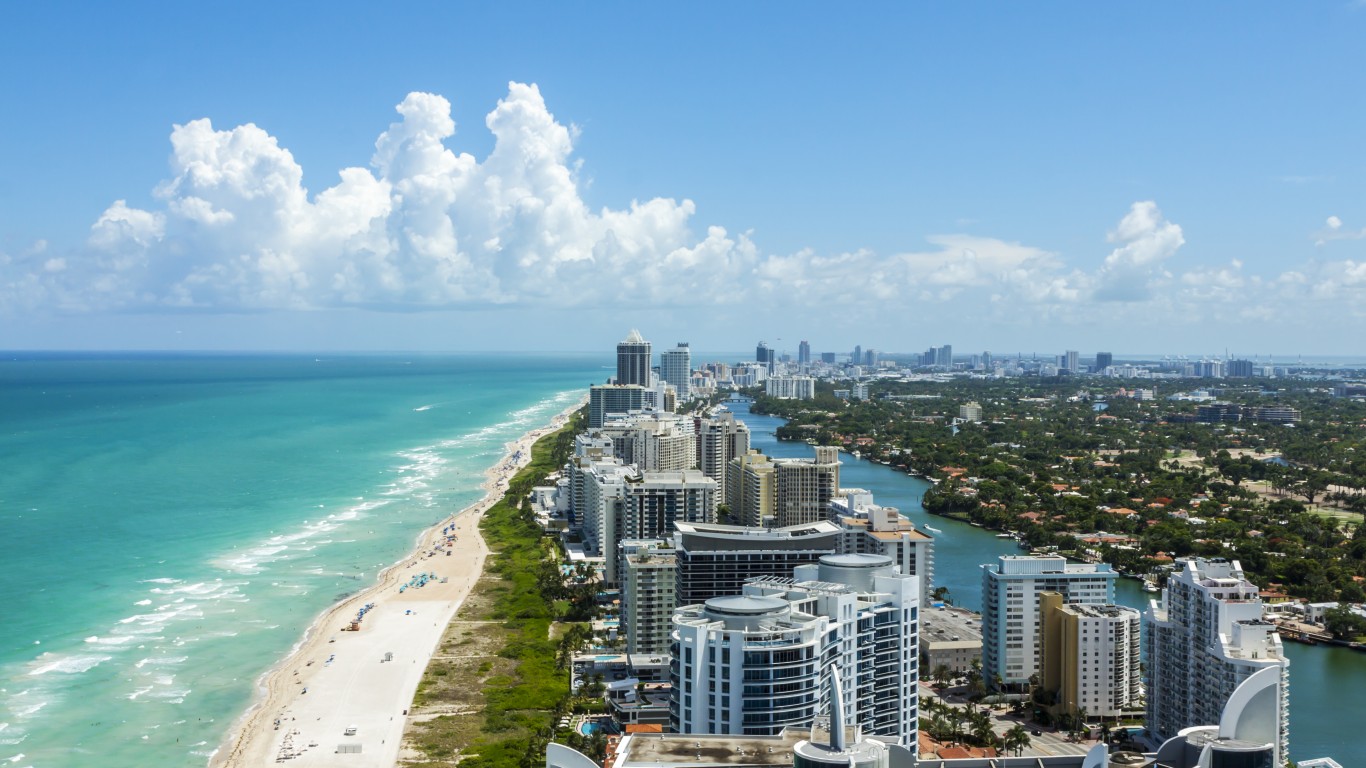
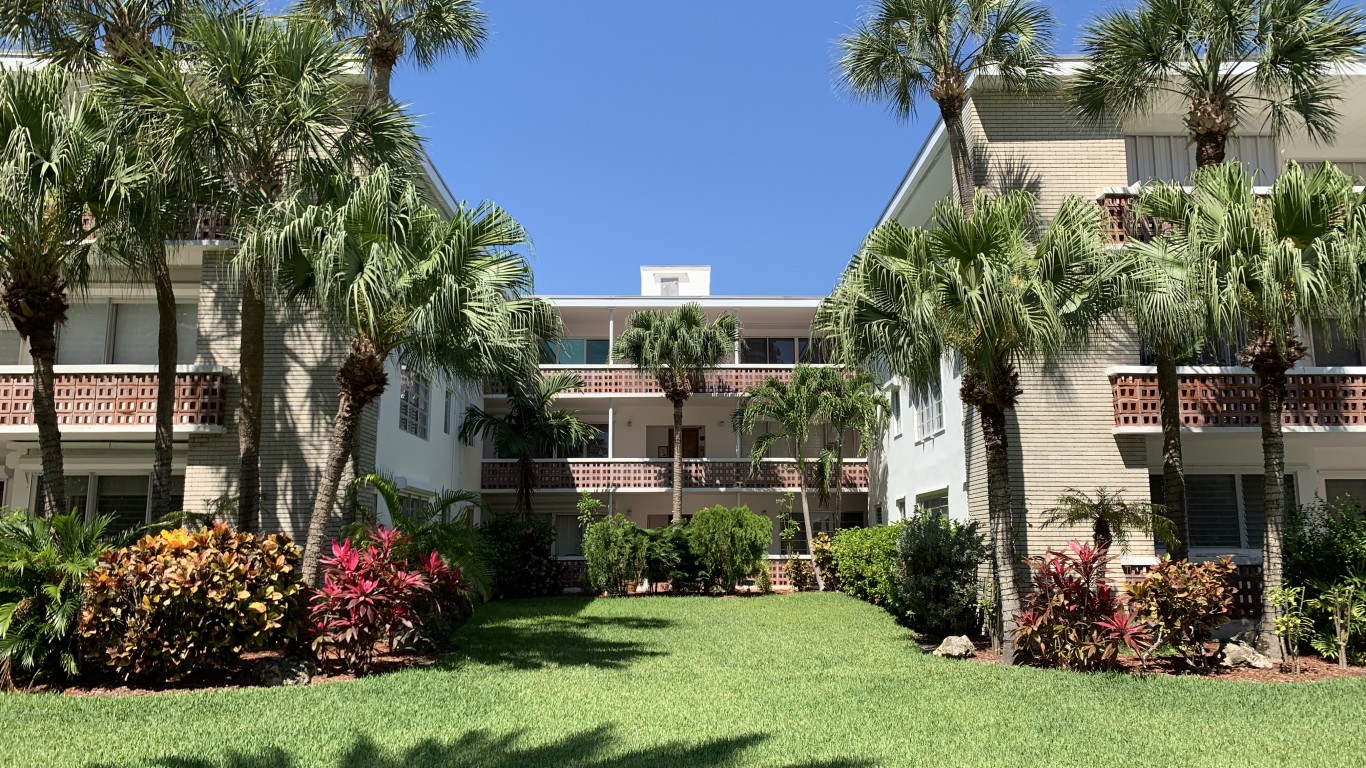
49. South Beach, Florida
> Gini index: 0.584
> Avg. household income, top 20%: $816,423 — 44th highest of 7,632 towns
> Avg. household income, bottom 20%: $26,856 — 1,089th highest of 7,632 towns (tied)
> Share of all income in South Beach that went to top 20%: 63.5% — 26th highest of 7,632 towns
> Share of all income in South Beach that went to bottom 20%: 2.1% — 184th lowest of 7,632 towns (tied)
> Median household income: $134,917 — 333rd highest of 7,696 towns

48. Duquesne, Pennsylvania
> Gini index: 0.586
> Avg. household income, top 20%: $150,460 — 3,000th lowest of 7,632 towns
> Avg. household income, bottom 20%: $4,993 — 132nd lowest of 7,632 towns
> Share of all income in Duquesne that went to top 20%: 60.7% — 66th highest of 7,632 towns
> Share of all income in Duquesne that went to bottom 20%: 2.0% — 156th lowest of 7,632 towns (tied)
> Median household income: $29,844 — 273rd lowest of 7,696 towns
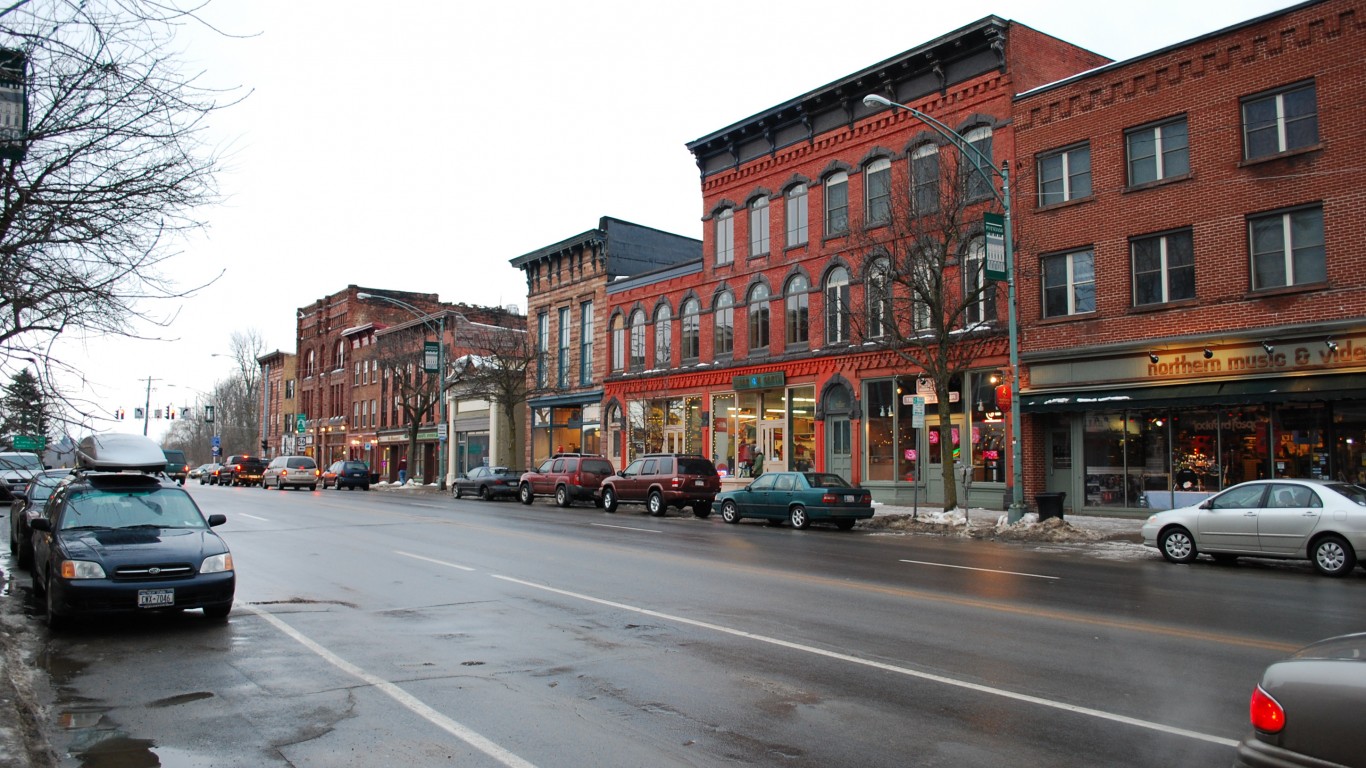
47. Potsdam, New York
> Gini index: 0.587
> Avg. household income, top 20%: $186,545 — 2,943rd highest of 7,632 towns
> Avg. household income, bottom 20%: $4,134 — 75th lowest of 7,632 towns (tied)
> Share of all income in Potsdam that went to top 20%: 59.3% — 113th highest of 7,632 towns
> Share of all income in Potsdam that went to bottom 20%: 1.3% — 38th lowest of 7,632 towns (tied)
> Median household income: $32,282 — 488th lowest of 7,696 towns
[in-text-ad-2]

46. Bradley Beach, New Jersey
> Gini index: 0.589
> Avg. household income, top 20%: $395,855 — 406th highest of 7,632 towns
> Avg. household income, bottom 20%: $14,200 — 3,437th lowest of 7,632 towns (tied)
> Share of all income in Bradley Beach that went to top 20%: 62.5% — 40th highest of 7,632 towns
> Share of all income in Bradley Beach that went to bottom 20%: 2.2% — 256th lowest of 7,632 towns (tied)
> Median household income: $64,246 — 3,176th highest of 7,696 towns (tied)

45. Byram, Connecticut
> Gini index: 0.593
> Avg. household income, top 20%: $558,660 — 172nd highest of 7,632 towns
> Avg. household income, bottom 20%: $23,165 — 1,651st highest of 7,632 towns
> Share of all income in Byram that went to top 20%: 63.9% — 22nd highest of 7,632 towns
> Share of all income in Byram that went to bottom 20%: 2.7% — 584th lowest of 7,632 towns (tied)
> Median household income: $81,324 — 1,867th highest of 7,696 towns
[in-text-ad]
44. Kosciusko, Mississippi
> Gini index: 0.593
> Avg. household income, top 20%: $167,960 — 3,698th highest of 7,632 towns
> Avg. household income, bottom 20%: $7,070 — 462nd lowest of 7,632 towns
> Share of all income in Kosciusko that went to top 20%: 63.2% — 28th highest of 7,632 towns (tied)
> Share of all income in Kosciusko that went to bottom 20%: 2.7% — 597th lowest of 7,632 towns (tied)
> Median household income: $26,632 — 135th lowest of 7,696 towns
43. Waynesboro, Mississippi
> Gini index: 0.594
> Avg. household income, top 20%: $137,829 — 2,175th lowest of 7,632 towns
> Avg. household income, bottom 20%: $3,997 — 65th lowest of 7,632 towns
> Share of all income in Waynesboro that went to top 20%: 60.7% — 65th highest of 7,632 towns
> Share of all income in Waynesboro that went to bottom 20%: 1.8% — 95th lowest of 7,632 towns
> Median household income: $26,773 — 141st lowest of 7,696 towns
42. Lewisburg, Pennsylvania
> Gini index: 0.594
> Avg. household income, top 20%: $242,111 — 1,575th highest of 7,632 towns
> Avg. household income, bottom 20%: $9,179 — 1,154th lowest of 7,632 towns (tied)
> Share of all income in Lewisburg that went to top 20%: 63.2% — 28th highest of 7,632 towns (tied)
> Share of all income in Lewisburg that went to bottom 20%: 2.4% — 347th lowest of 7,632 towns (tied)
> Median household income: $39,830 — 1,262nd lowest of 7,696 towns
[in-text-ad-2]
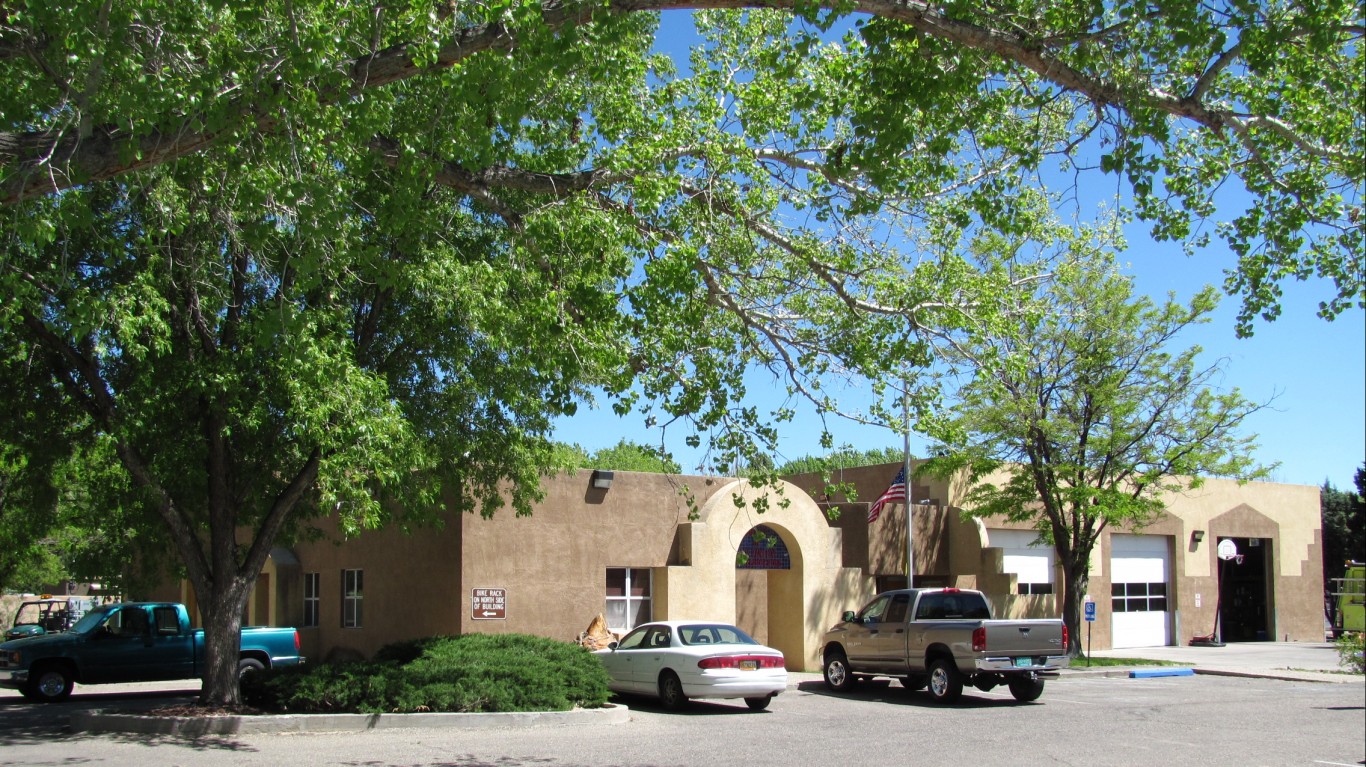
41. Los Ranchos de Albuquerque, New Mexico
> Gini index: 0.595
> Avg. household income, top 20%: $409,269 — 368th highest of 7,632 towns
> Avg. household income, bottom 20%: $11,664 — 2,279th lowest of 7,632 towns
> Share of all income in Los Ranchos de Albuquerque that went to top 20%: 61.4% — 53rd highest of 7,632 towns
> Share of all income in Los Ranchos de Albuquerque that went to bottom 20%: 1.8% — 94th lowest of 7,632 towns
> Median household income: $64,732 — 3,131st highest of 7,696 towns
40. Wildwood, New Jersey
> Gini index: 0.596
> Avg. household income, top 20%: $248,938 — 1,484th highest of 7,632 towns
> Avg. household income, bottom 20%: $9,761 — 1,385th lowest of 7,632 towns
> Share of all income in Wildwood that went to top 20%: 62.9% — 35th highest of 7,632 towns (tied)
> Share of all income in Wildwood that went to bottom 20%: 2.5% — 410th lowest of 7,632 towns (tied)
> Median household income: $41,888 — 1,563rd lowest of 7,696 towns
[in-text-ad]

39. Plymouth, North Carolina
> Gini index: 0.597
> Avg. household income, top 20%: $120,937 — 1,101st lowest of 7,632 towns (tied)
> Avg. household income, bottom 20%: $2,396 — 19th lowest of 7,632 towns
> Share of all income in Plymouth that went to top 20%: 59.9% — 86th highest of 7,632 towns (tied)
> Share of all income in Plymouth that went to bottom 20%: 1.2% — 32nd lowest of 7,632 towns
> Median household income: $18,490 — 8th lowest of 7,696 towns

38. Palm Beach, Florida
> Gini index: 0.598
> Avg. household income, top 20%: $1,017,261 — 15th highest of 7,632 towns
> Avg. household income, bottom 20%: $24,475 — 1,421st highest of 7,632 towns
> Share of all income in Palm Beach that went to top 20%: 61.9% — 43rd highest of 7,632 towns
> Share of all income in Palm Beach that went to bottom 20%: 1.5% — 50th lowest of 7,632 towns (tied)
> Median household income: $141,348 — 276th highest of 7,696 towns

37. Cordele, Georgia
> Gini index: 0.598
> Avg. household income, top 20%: $133,439 — 1,893rd lowest of 7,632 towns
> Avg. household income, bottom 20%: $4,703 — 110th lowest of 7,632 towns
> Share of all income in Cordele that went to top 20%: 63.1% — 30th highest of 7,632 towns
> Share of all income in Cordele that went to bottom 20%: 2.2% — 249th lowest of 7,632 towns (tied)
> Median household income: $21,350 — 25th lowest of 7,696 towns
[in-text-ad-2]
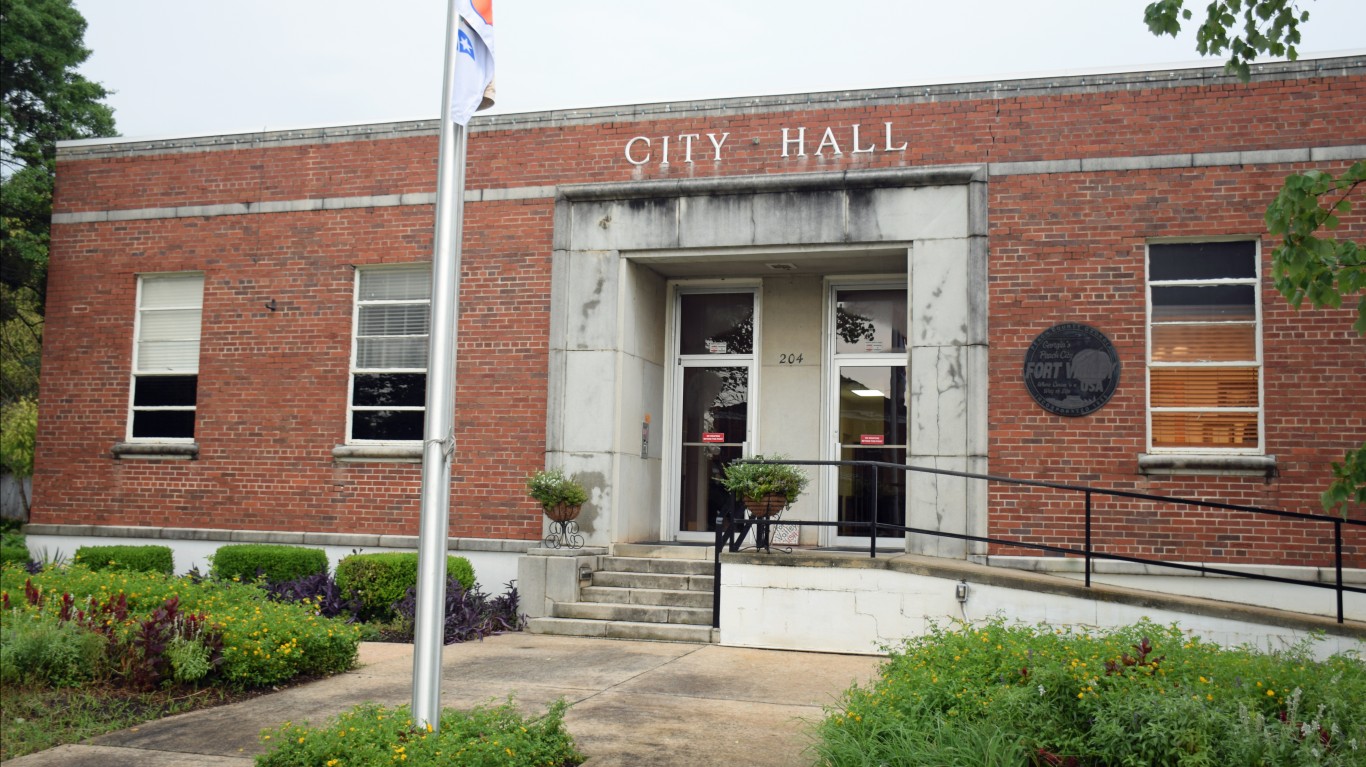
36. Fort Valley, Georgia
> Gini index: 0.598
> Avg. household income, top 20%: $127,703 — 1,514th lowest of 7,632 towns
> Avg. household income, bottom 20%: $2,457 — 20th lowest of 7,632 towns
> Share of all income in Fort Valley that went to top 20%: 61.3% — 54th highest of 7,632 towns
> Share of all income in Fort Valley that went to bottom 20%: 1.2% — 30th lowest of 7,632 towns (tied)
> Median household income: $22,613 — 45th lowest of 7,696 towns

35. Natchitoches, Louisiana
> Gini index: 0.598
> Avg. household income, top 20%: $133,362 — 1,886th lowest of 7,632 towns
> Avg. household income, bottom 20%: $2,179 — 15th lowest of 7,632 towns
> Share of all income in Natchitoches that went to top 20%: 62.5% — 39th highest of 7,632 towns
> Share of all income in Natchitoches that went to bottom 20%: 1.0% — 19th lowest of 7,632 towns (tied)
> Median household income: $21,715 — 30th lowest of 7,696 towns
[in-text-ad]
34. Indian Wells, California
> Gini index: 0.599
> Avg. household income, top 20%: $645,129 — 112th highest of 7,632 towns
> Avg. household income, bottom 20%: $15,427 — 3,687th highest of 7,632 towns
> Share of all income in Indian Wells that went to top 20%: 63.0% — 31st highest of 7,632 towns
> Share of all income in Indian Wells that went to bottom 20%: 1.5% — 53rd lowest of 7,632 towns
> Median household income: $107,500 — 815th highest of 7,696 towns (tied)

33. Lancaster, South Carolina
> Gini index: 0.599
> Avg. household income, top 20%: $187,594 — 2,906th highest of 7,632 towns
> Avg. household income, bottom 20%: $6,759 — 396th lowest of 7,632 towns
> Share of all income in Lancaster that went to top 20%: 62.6% — 37th highest of 7,632 towns
> Share of all income in Lancaster that went to bottom 20%: 2.3% — 273rd lowest of 7,632 towns (tied)
> Median household income: $30,122 — 288th lowest of 7,696 towns
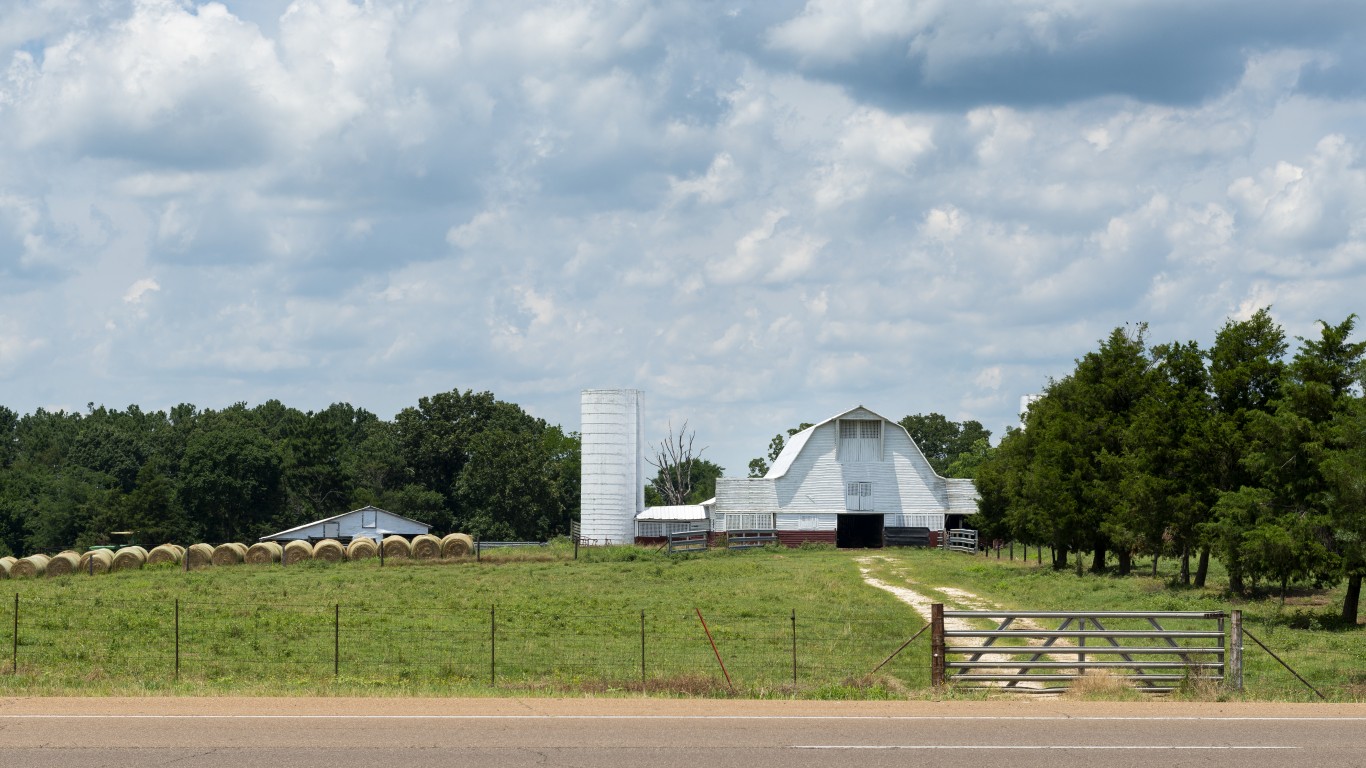
32. Somerville, Tennessee
> Gini index: 0.6
> Avg. household income, top 20%: $179,100 — 3,247th highest of 7,632 towns
> Avg. household income, bottom 20%: $5,031 — 136th lowest of 7,632 towns
> Share of all income in Somerville that went to top 20%: 65.7% — 6th highest of 7,632 towns
> Share of all income in Somerville that went to bottom 20%: 1.9% — 114th lowest of 7,632 towns (tied)
> Median household income: $24,266 — 69th lowest of 7,696 towns
[in-text-ad-2]
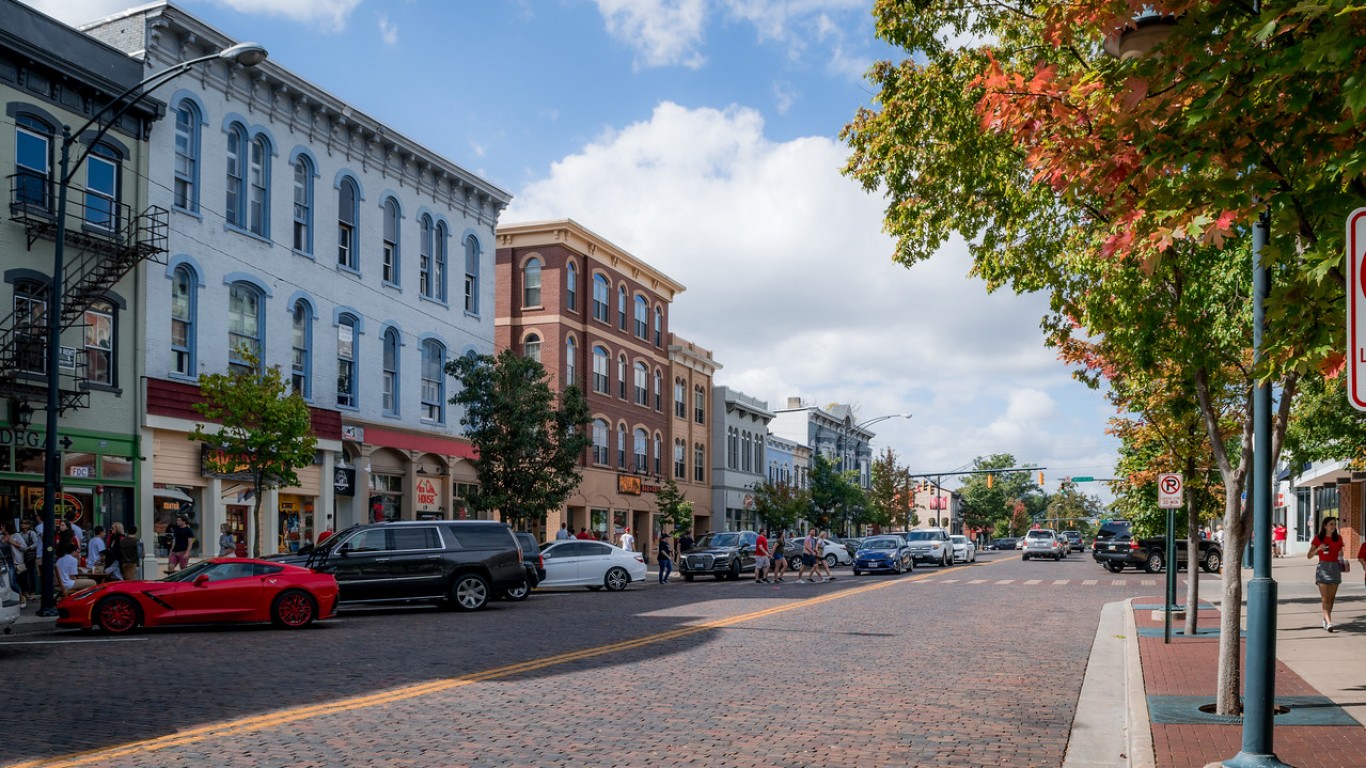
31. Oxford, Ohio
> Gini index: 0.6
> Avg. household income, top 20%: $173,500 — 3,471st highest of 7,632 towns
> Avg. household income, bottom 20%: $849 — 6th lowest of 7,632 towns
> Share of all income in Oxford that went to top 20%: 60.9% — 63rd highest of 7,632 towns
> Share of all income in Oxford that went to bottom 20%: 0.3% — the lowest of 7,632 towns
> Median household income: $31,546 — 400th lowest of 7,696 towns
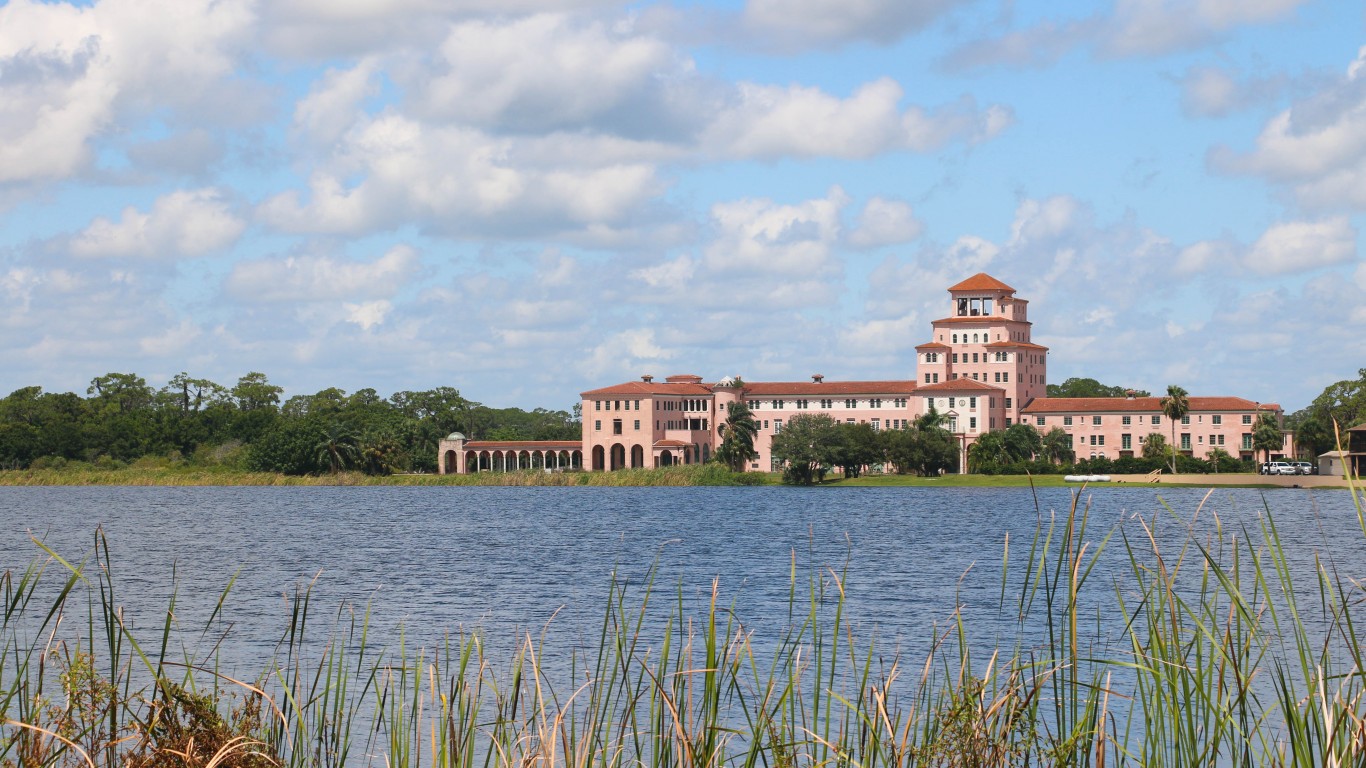
30. Sebring, Florida
> Gini index: 0.601
> Avg. household income, top 20%: $172,651 — 3,519th highest of 7,632 towns
> Avg. household income, bottom 20%: $7,395 — 550th lowest of 7,632 towns
> Share of all income in Sebring that went to top 20%: 63.7% — 24th highest of 7,632 towns
> Share of all income in Sebring that went to bottom 20%: 2.7% — 673rd lowest of 7,632 towns (tied)
> Median household income: $25,737 — 111th lowest of 7,696 towns
[in-text-ad]
29. Bal Harbour, Florida
> Gini index: 0.601
> Avg. household income, top 20%: $469,911 — 253rd highest of 7,632 towns
> Avg. household income, bottom 20%: $11,188 — 2,068th lowest of 7,632 towns
> Share of all income in Bal Harbour that went to top 20%: 64.7% — 13th highest of 7,632 towns
> Share of all income in Bal Harbour that went to bottom 20%: 1.5% — 55th lowest of 7,632 towns (tied)
> Median household income: $76,962 — 2,159th highest of 7,696 towns
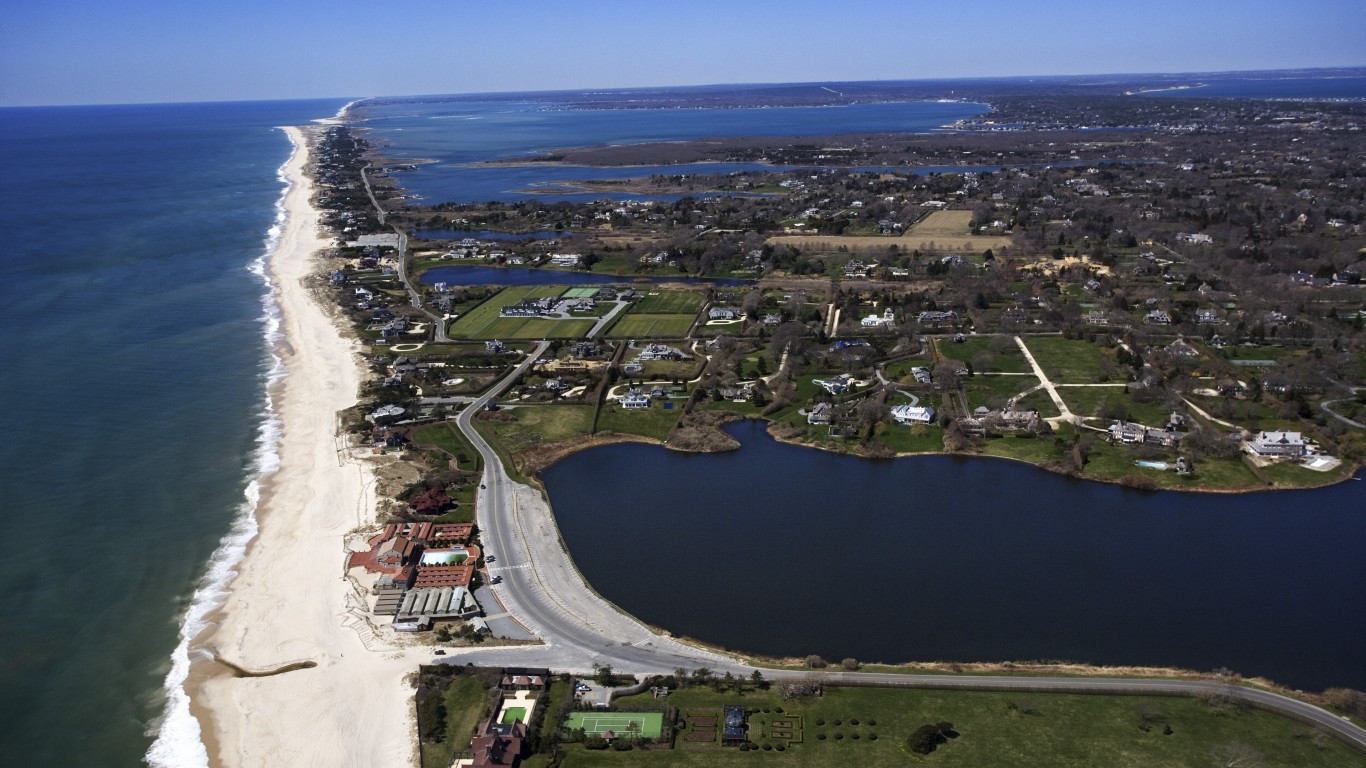
28. Southampton, New York
> Gini index: 0.602
> Avg. household income, top 20%: $689,055 — 82nd highest of 7,632 towns
> Avg. household income, bottom 20%: $25,711 — 1,259th highest of 7,632 towns
> Share of all income in Southampton that went to top 20%: 64.9% — 12th highest of 7,632 towns
> Share of all income in Southampton that went to bottom 20%: 2.4% — 369th lowest of 7,632 towns (tied)
> Median household income: $122,614 — 518th highest of 7,696 towns
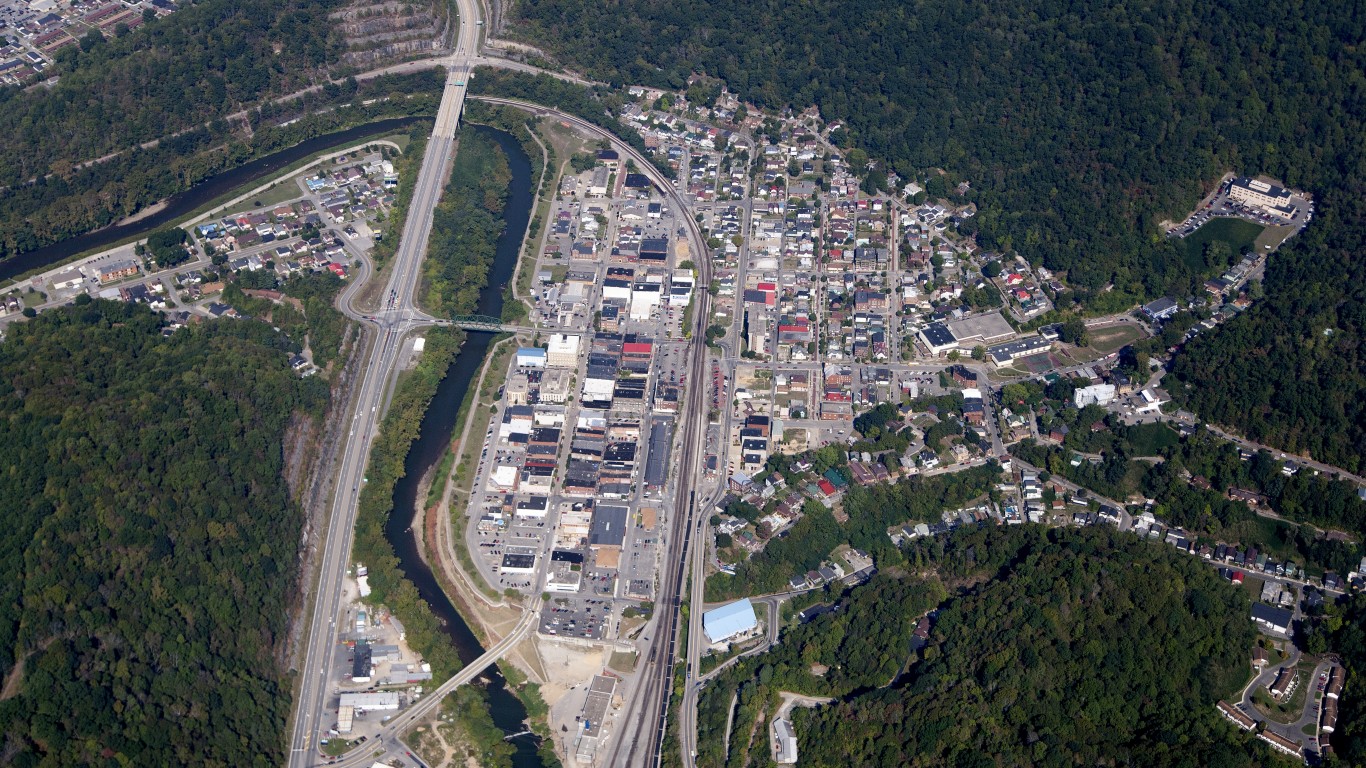
27. Williamson, West Virginia
> Gini index: 0.602
> Avg. household income, top 20%: $157,944 — 3,428th lowest of 7,632 towns
> Avg. household income, bottom 20%: $6,138 — 282nd lowest of 7,632 towns (tied)
> Share of all income in Williamson that went to top 20%: 63.2% — 27th highest of 7,632 towns
> Share of all income in Williamson that went to bottom 20%: 2.5% — 410th lowest of 7,632 towns (tied)
> Median household income: $24,058 — 64th lowest of 7,696 towns
[in-text-ad-2]
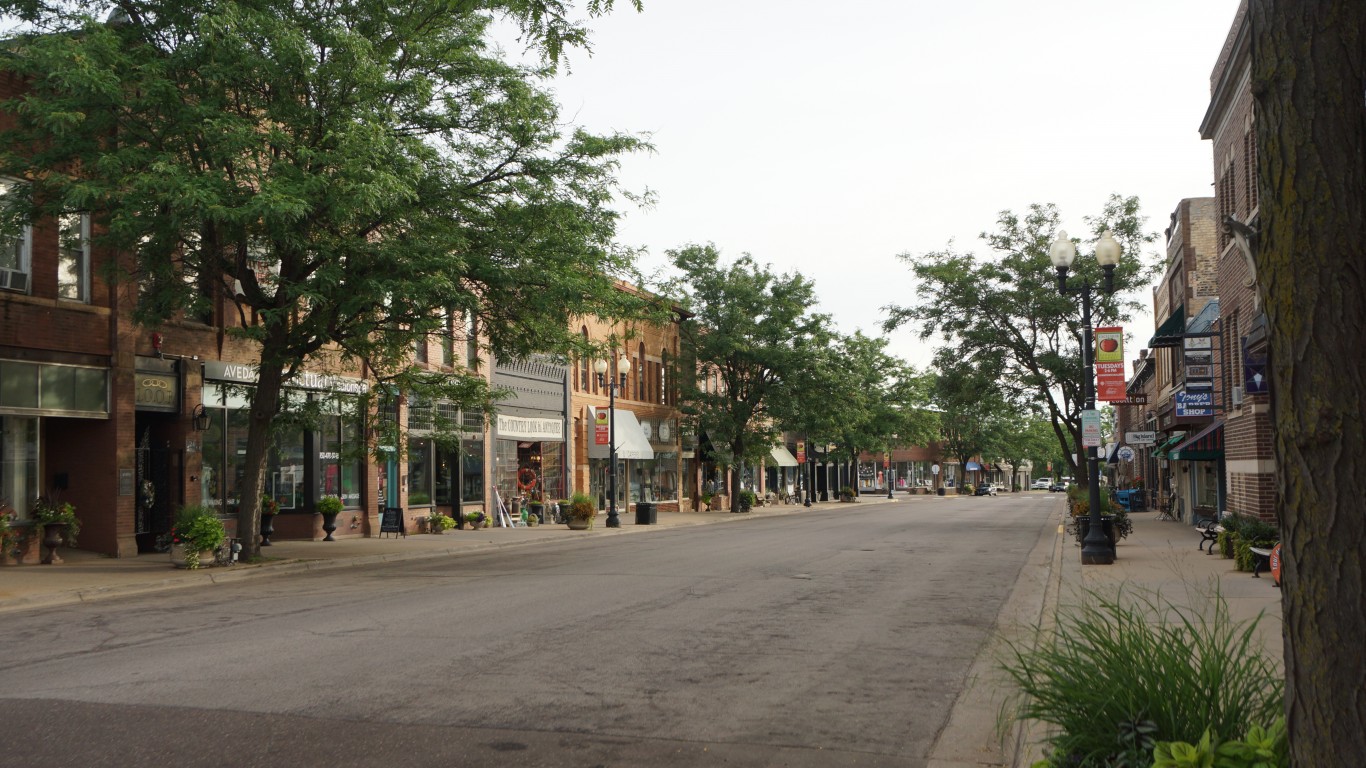
26. Excelsior, Minnesota
> Gini index: 0.602
> Avg. household income, top 20%: $403,676 — 386th highest of 7,632 towns
> Avg. household income, bottom 20%: $13,454 — 3,129th lowest of 7,632 towns
> Share of all income in Excelsior that went to top 20%: 63.8% — 23rd highest of 7,632 towns
> Share of all income in Excelsior that went to bottom 20%: 2.1% — 207th lowest of 7,632 towns (tied)
> Median household income: $70,000 — 2,689th highest of 7,696 towns (tied)
25. Wayzata, Minnesota
> Gini index: 0.603
> Avg. household income, top 20%: $590,010 — 142nd highest of 7,632 towns
> Avg. household income, bottom 20%: $20,286 — 2,214th highest of 7,632 towns
> Share of all income in Wayzata that went to top 20%: 65.3% — 8th highest of 7,632 towns
> Share of all income in Wayzata that went to bottom 20%: 2.3% — 265th lowest of 7,632 towns (tied)
> Median household income: $86,852 — 1,571st highest of 7,696 towns
[in-text-ad]
24. Storrs, Connecticut
> Gini index: 0.604
> Avg. household income, top 20%: $199,260 — 2,526th highest of 7,632 towns
> Avg. household income, bottom 20%: $3,425 — 43rd lowest of 7,632 towns
> Share of all income in Storrs that went to top 20%: 61.8% — 47th highest of 7,632 towns
> Share of all income in Storrs that went to bottom 20%: 1.1% — 23rd lowest of 7,632 towns
> Median household income: $27,035 — 153rd lowest of 7,696 towns
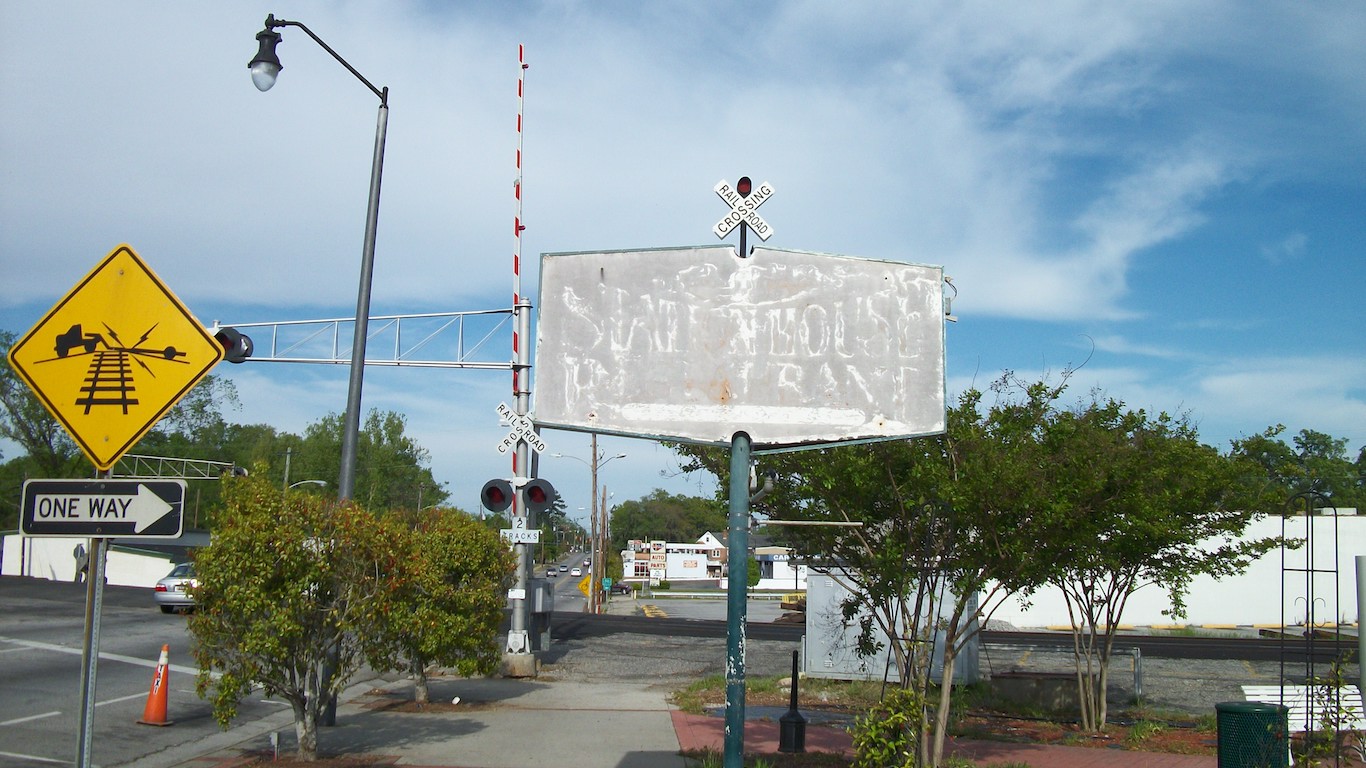
23. Kingstree, South Carolina
> Gini index: 0.607
> Avg. household income, top 20%: $140,426 — 2,363rd lowest of 7,632 towns (tied)
> Avg. household income, bottom 20%: $2,670 — 28th lowest of 7,632 towns
> Share of all income in Kingstree that went to top 20%: 61.8% — 49th highest of 7,632 towns
> Share of all income in Kingstree that went to bottom 20%: 1.2% — 29th lowest of 7,632 towns
> Median household income: $27,697 — 189th lowest of 7,696 towns
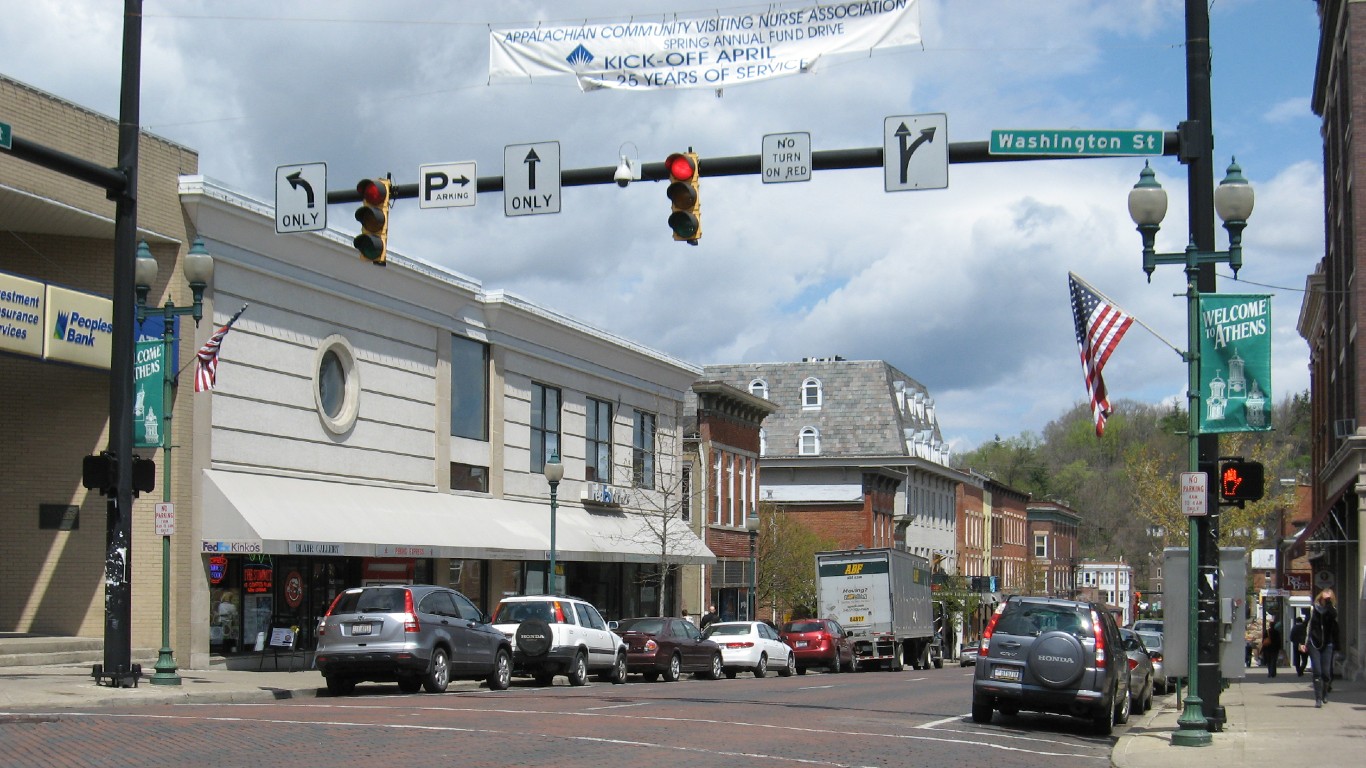
22. The Plains, Ohio
> Gini index: 0.608
> Avg. household income, top 20%: $185,622 — 2,985th highest of 7,632 towns
> Avg. household income, bottom 20%: $6,132 — 280th lowest of 7,632 towns
> Share of all income in The Plains that went to top 20%: 61.8% — 46th highest of 7,632 towns
> Share of all income in The Plains that went to bottom 20%: 2.0% — 162nd lowest of 7,632 towns (tied)
> Median household income: $36,250 — 855th lowest of 7,696 towns (tied)
[in-text-ad-2]
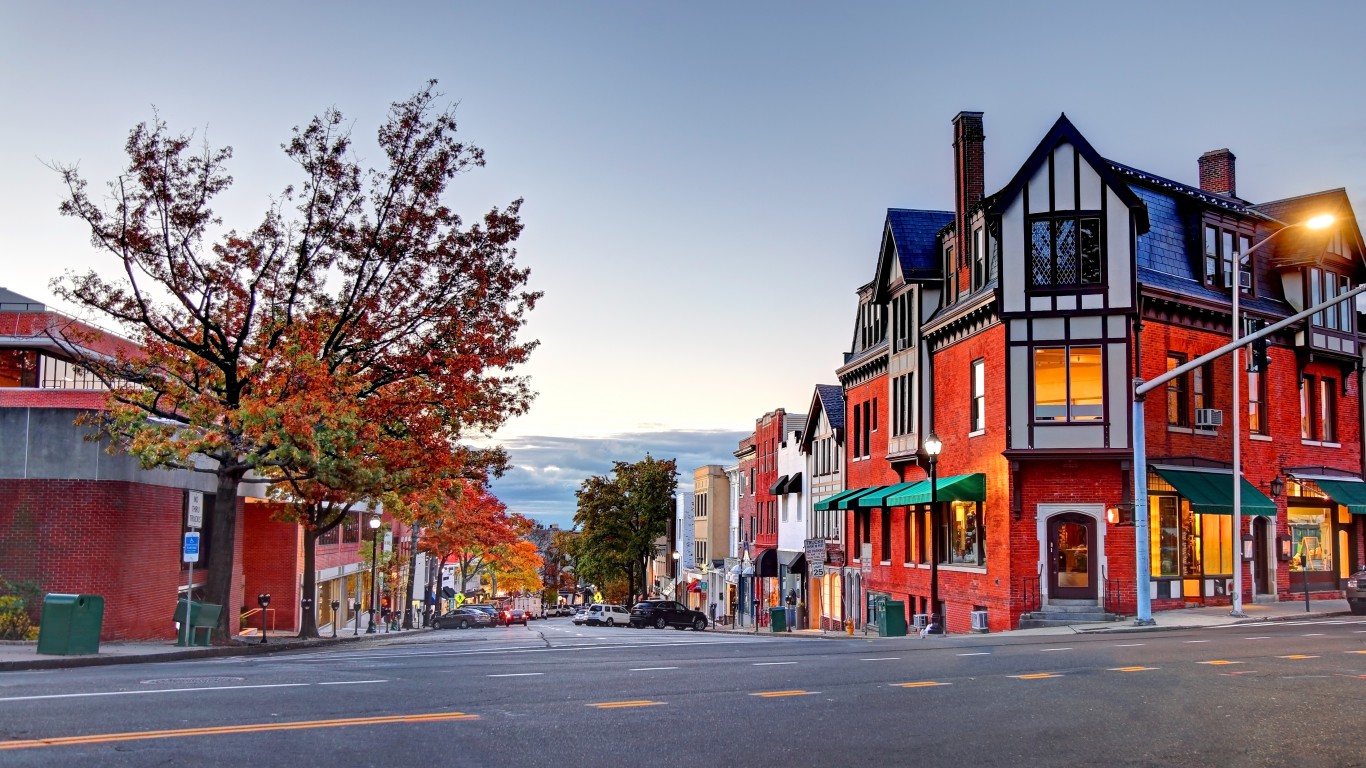
21. Greenwich, Connecticut
> Gini index: 0.608
> Avg. household income, top 20%: $671,005 — 92nd highest of 7,632 towns
> Avg. household income, bottom 20%: $15,104 — 3,814th lowest of 7,632 towns (tied)
> Share of all income in Greenwich that went to top 20%: 63.9% — 21st highest of 7,632 towns
> Share of all income in Greenwich that went to bottom 20%: 1.5% — 46th lowest of 7,632 towns
> Median household income: $109,500 — 759th highest of 7,696 towns
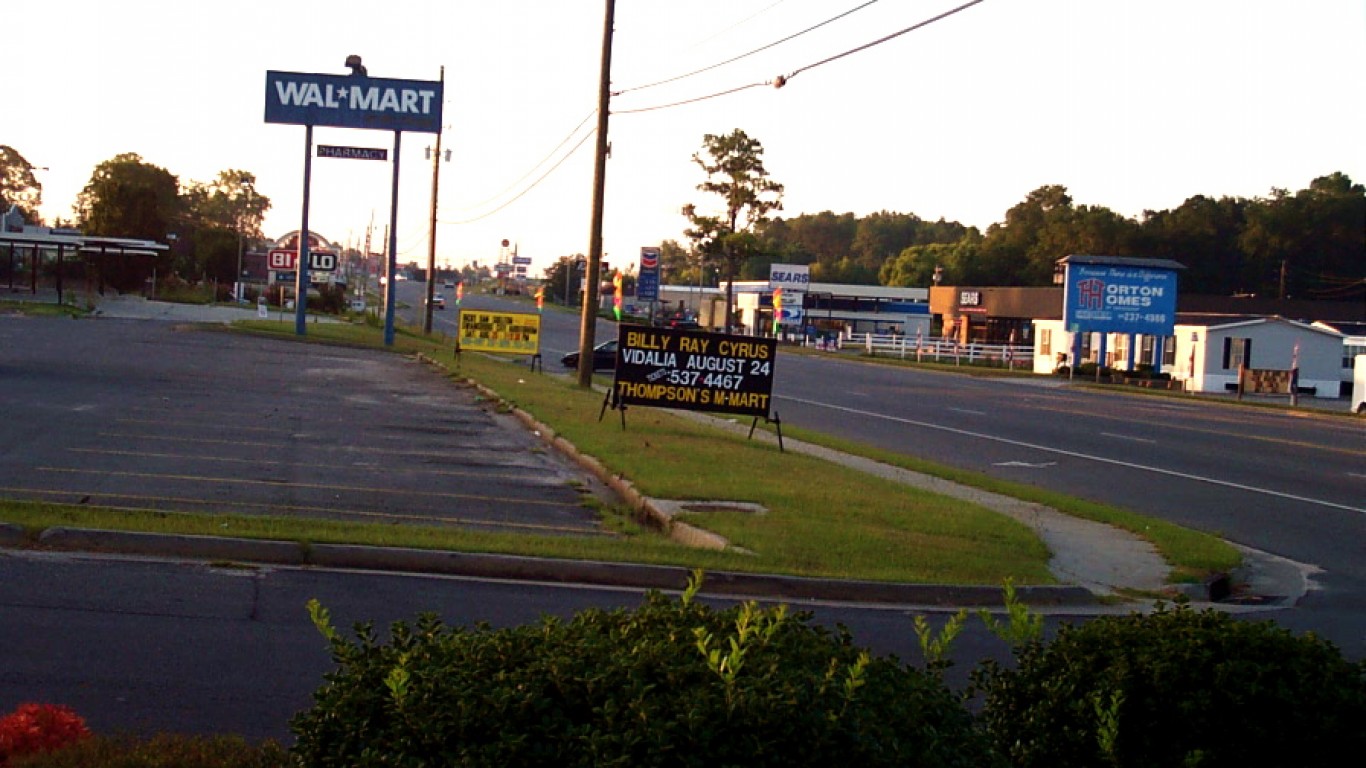
20. Vidalia, Georgia
> Gini index: 0.609
> Avg. household income, top 20%: $244,314 — 1,549th highest of 7,632 towns
> Avg. household income, bottom 20%: $7,696 — 638th lowest of 7,632 towns
> Share of all income in Vidalia that went to top 20%: 63.5% — 25th highest of 7,632 towns
> Share of all income in Vidalia that went to bottom 20%: 2.0% — 152nd lowest of 7,632 towns (tied)
> Median household income: $40,621 — 1,382nd lowest of 7,696 towns
[in-text-ad]

19. Eastland, Texas
> Gini index: 0.609
> Avg. household income, top 20%: $231,527 — 1,761st highest of 7,632 towns
> Avg. household income, bottom 20%: $10,507 — 1,719th lowest of 7,632 towns (tied)
> Share of all income in Eastland that went to top 20%: 65.2% — 9th highest of 7,632 towns
> Share of all income in Eastland that went to bottom 20%: 3.0% — 1,002nd lowest of 7,632 towns (tied)
> Median household income: $33,375 — 576th lowest of 7,696 towns
18. Perryman, Maryland
> Gini index: 0.611
> Avg. household income, top 20%: $282,182 — 1,085th highest of 7,632 towns
> Avg. household income, bottom 20%: $5,620 — 203rd lowest of 7,632 towns
> Share of all income in Perryman that went to top 20%: 63.0% — 33rd highest of 7,632 towns
> Share of all income in Perryman that went to bottom 20%: 1.3% — 35th lowest of 7,632 towns
> Median household income: $56,830 — 3,709th lowest of 7,696 towns (tied)

17. Macon, Mississippi
> Gini index: 0.612
> Avg. household income, top 20%: $181,406 — 3,162nd highest of 7,632 towns
> Avg. household income, bottom 20%: $6,237 — 296th lowest of 7,632 towns
> Share of all income in Macon that went to top 20%: 64.7% — 16th highest of 7,632 towns
> Share of all income in Macon that went to bottom 20%: 2.2% — 240th lowest of 7,632 towns (tied)
> Median household income: $26,750 — 140th lowest of 7,696 towns
[in-text-ad-2]

16. Dadeville, Alabama
> Gini index: 0.612
> Avg. household income, top 20%: $148,454 — 2,875th lowest of 7,632 towns
> Avg. household income, bottom 20%: $2,911 — 32nd lowest of 7,632 towns
> Share of all income in Dadeville that went to top 20%: 63.0% — 32nd highest of 7,632 towns
> Share of all income in Dadeville that went to bottom 20%: 1.2% — 34th lowest of 7,632 towns
> Median household income: $24,279 — 70th lowest of 7,696 towns
15. Skaneateles, New York
> Gini index: 0.613
> Avg. household income, top 20%: $622,843 — 124th highest of 7,632 towns
> Avg. household income, bottom 20%: $18,737 — 2,610th highest of 7,632 towns
> Share of all income in Skaneateles that went to top 20%: 64.6% — 17th highest of 7,632 towns
> Share of all income in Skaneateles that went to bottom 20%: 1.9% — 135th lowest of 7,632 towns (tied)
> Median household income: $95,724 — 1,189th highest of 7,696 towns
[in-text-ad]

14. Forsyth, Georgia
> Gini index: 0.613
> Avg. household income, top 20%: $202,438 — 2,444th highest of 7,632 towns
> Avg. household income, bottom 20%: $3,389 — 41st lowest of 7,632 towns
> Share of all income in Forsyth that went to top 20%: 62.9% — 34th highest of 7,632 towns
> Share of all income in Forsyth that went to bottom 20%: 1.0% — 22nd lowest of 7,632 towns
> Median household income: $32,173 — 468th lowest of 7,696 towns
13. Palmyra, New York
> Gini index: 0.613
> Avg. household income, top 20%: $353,496 — 554th highest of 7,632 towns
> Avg. household income, bottom 20%: $14,836 — 3,705th lowest of 7,632 towns
> Share of all income in Palmyra that went to top 20%: 64.7% — 15th highest of 7,632 towns
> Share of all income in Palmyra that went to bottom 20%: 2.7% — 655th lowest of 7,632 towns (tied)
> Median household income: $60,500 — 3,565th highest of 7,696 towns

12. Naples, Florida
> Gini index: 0.613
> Avg. household income, top 20%: $706,858 — 76th highest of 7,632 towns
> Avg. household income, bottom 20%: $16,886 — 3,154th highest of 7,632 towns (tied)
> Share of all income in Naples that went to top 20%: 64.9% — 11th highest of 7,632 towns
> Share of all income in Naples that went to bottom 20%: 1.5% — 58th lowest of 7,632 towns
> Median household income: $107,013 — 832nd highest of 7,696 towns
[in-text-ad-2]

11. Spring Lake, New Jersey
> Gini index: 0.614
> Avg. household income, top 20%: $550,856 — 181st highest of 7,632 towns
> Avg. household income, bottom 20%: $14,488 — 3,553rd lowest of 7,632 towns (tied)
> Share of all income in Spring Lake that went to top 20%: 65.6% — 7th highest of 7,632 towns
> Share of all income in Spring Lake that went to bottom 20%: 1.7% — 89th lowest of 7,632 towns (tied)
> Median household income: $86,200 — 1,597th highest of 7,696 towns
10. North Wilkesboro, North Carolina
> Gini index: 0.618
> Avg. household income, top 20%: $193,064 — 2,722nd highest of 7,632 towns
> Avg. household income, bottom 20%: $7,323 — 531st lowest of 7,632 towns
> Share of all income in North Wilkesboro that went to top 20%: 64.5% — 19th highest of 7,632 towns
> Share of all income in North Wilkesboro that went to bottom 20%: 2.5% — 401st lowest of 7,632 towns (tied)
> Median household income: $24,479 — 74th lowest of 7,696 towns
[in-text-ad]
9. Greenwood, Mississippi
> Gini index: 0.626
> Avg. household income, top 20%: $175,345 — 3,393rd highest of 7,632 towns
> Avg. household income, bottom 20%: $2,852 — 31st lowest of 7,632 towns
> Share of all income in Greenwood that went to top 20%: 64.0% — 20th highest of 7,632 towns
> Share of all income in Greenwood that went to bottom 20%: 1.0% — 21st lowest of 7,632 towns
> Median household income: $26,965 — 149th lowest of 7,696 towns
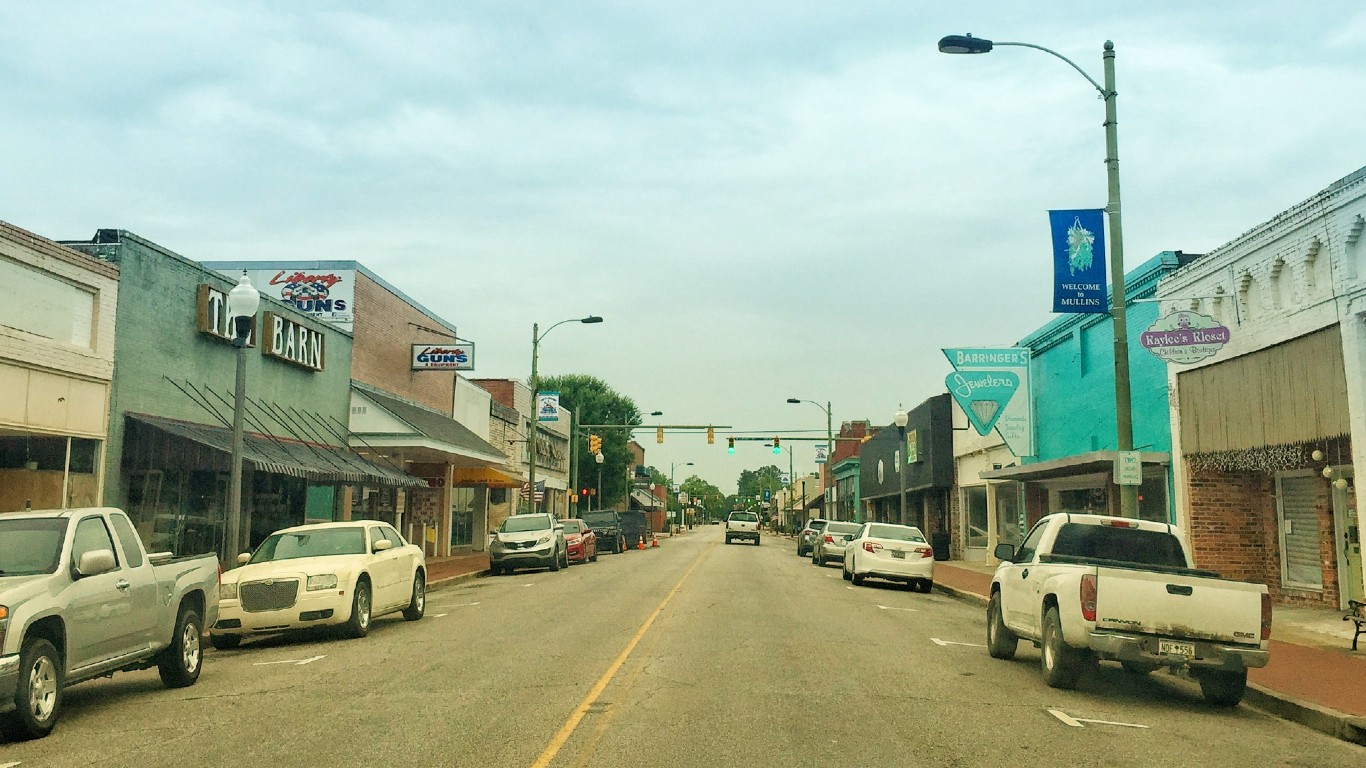
8. Mullins, South Carolina
> Gini index: 0.626
> Avg. household income, top 20%: $190,056 — 2,826th highest of 7,632 towns
> Avg. household income, bottom 20%: $4,780 — 116th lowest of 7,632 towns
> Share of all income in Mullins that went to top 20%: 64.5% — 18th highest of 7,632 towns
> Share of all income in Mullins that went to bottom 20%: 1.6% — 66th lowest of 7,632 towns (tied)
> Median household income: $31,022 — 351st lowest of 7,696 towns
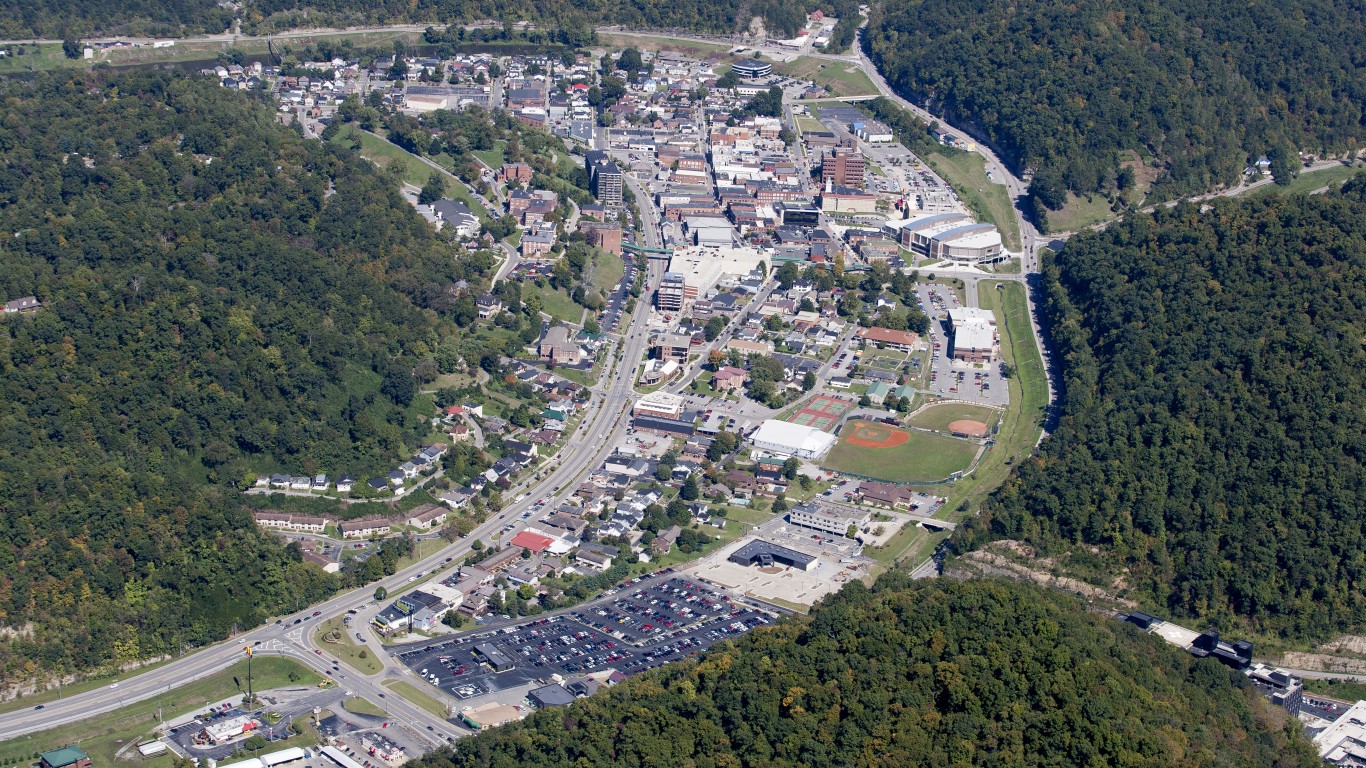
7. Pikeville, Kentucky
> Gini index: 0.626
> Avg. household income, top 20%: $244,679 — 1,540th highest of 7,632 towns
> Avg. household income, bottom 20%: $5,244 — 155th lowest of 7,632 towns
> Share of all income in Pikeville that went to top 20%: 64.7% — 14th highest of 7,632 towns
> Share of all income in Pikeville that went to bottom 20%: 1.4% — 42nd lowest of 7,632 towns
> Median household income: $32,281 — 487th lowest of 7,696 towns
[in-text-ad-2]

6. Stanford, California
> Gini index: 0.627
> Avg. household income, top 20%: $462,450 — 262nd highest of 7,632 towns
> Avg. household income, bottom 20%: $5,042 — 137th lowest of 7,632 towns
> Share of all income in Stanford that went to top 20%: 66.4% — 5th highest of 7,632 towns
> Share of all income in Stanford that went to bottom 20%: 0.7% — 11th lowest of 7,632 towns
> Median household income: $58,906 — 3,755th highest of 7,696 towns

5. Boone, North Carolina
> Gini index: 0.634
> Avg. household income, top 20%: $162,934 — 3,687th lowest of 7,632 towns
> Avg. household income, bottom 20%: $2,551 — 23rd lowest of 7,632 towns (tied)
> Share of all income in Boone that went to top 20%: 65.0% — 10th highest of 7,632 towns
> Share of all income in Boone that went to bottom 20%: 1.0% — 19th lowest of 7,632 towns (tied)
> Median household income: $22,434 — 43rd lowest of 7,696 towns
[in-text-ad]

4. Livingston, Alabama
> Gini index: 0.636
> Avg. household income, top 20%: $111,573 — 639th lowest of 7,632 towns
> Avg. household income, bottom 20%: $858 — 7th lowest of 7,632 towns
> Share of all income in Livingston that went to top 20%: 67.3% — 4th highest of 7,632 towns
> Share of all income in Livingston that went to bottom 20%: 0.5% — 8th lowest of 7,632 towns
> Median household income: $11,969 — the lowest of 7,696 towns

3. Crystal River, Florida
> Gini index: 0.655
> Avg. household income, top 20%: $207,971 — 2,278th highest of 7,632 towns
> Avg. household income, bottom 20%: $3,936 — 64th lowest of 7,632 towns
> Share of all income in Crystal River that went to top 20%: 67.9% — 3rd highest of 7,632 towns
> Share of all income in Crystal River that went to bottom 20%: 1.3% — 37th lowest of 7,632 towns
> Median household income: $24,225 — 67th lowest of 7,696 towns

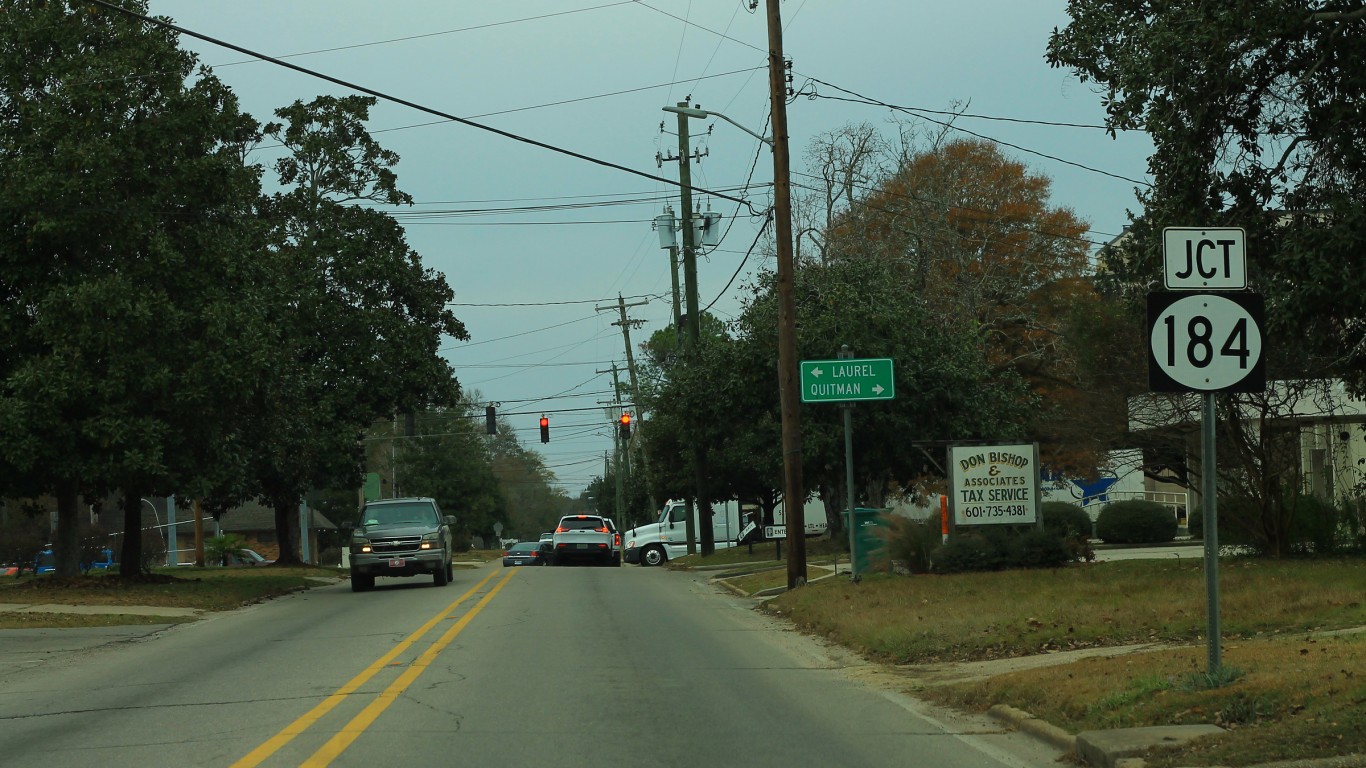
2. Quitman, Georgia
> Gini index: 0.677
> Avg. household income, top 20%: $241,262 — 1,599th highest of 7,632 towns
> Avg. household income, bottom 20%: $2,994 — 35th lowest of 7,632 towns
> Share of all income in Quitman that went to top 20%: 71.7% — 2nd highest of 7,632 towns
> Share of all income in Quitman that went to bottom 20%: 0.9% — 14th lowest of 7,632 towns
> Median household income: $30,269 — 297th lowest of 7,696 towns
[in-text-ad-2]
1. Lake Providence, Louisiana
> Gini index: 0.771
> Avg. household income, top 20%: $251,217 — 1,456th highest of 7,632 towns
> Avg. household income, bottom 20%: $1,586 — 9th lowest of 7,632 towns
> Share of all income in Lake Providence that went to top 20%: 79.2% — the highest of 7,632 towns
> Share of all income in Lake Providence that went to bottom 20%: 0.5% — 7th lowest of 7,632 towns
> Median household income: $18,316 — 6th lowest of 7,696 towns
Methodology
To determine the towns with the widest income gaps in the nation, 24/7 Wall St. reviewed five-year estimates of the Gini Index of income inequality from the U.S. Census Bureau’s 2019 American Community Survey.
The Gini Index of income inequality summarizes income dispersion in an area on a scale from 0 to 1. A value of 0 indicates perfect equality — everyone in the area receives an equal share of income. A value of 1 indicates perfect inequality — only one recipient receives all the income.
We used census “place” geographies — a category that includes 29,573 incorporated legal entities and census-designated statistical entities. Of those, 29,320 had boundaries that fell within one of the 50 states or the District of Columbia.
We defined towns based on population thresholds — having at least 1,000 people and less than 25,000 people — and 13,332 of the places fell within these thresholds.
Towns were excluded if the Gini Index was not available in the 2019 ACS, if there were fewer than 1,000 housing units, or if the sampling error associated with a town’s data was deemed too high.
The sampling error was defined as too high if the coefficient of variation — a statistical assessment of how reliable an estimate is — for a town’s Gini Index was above 15% and greater than two standard deviations above the mean CV for all towns’ Gini Indices. We similarly excluded towns that had a sampling error too high for their population, using the same definition.
The remaining 7,698 places were ranked based on their Gini Index. To break ties, we used the share of aggregate household income earned by the top 20% of households.
Additional information on average household income by quintile, share of aggregate household income by quintile, and median household income are also five-year estimates from the 2019 ACS.
Get Ready To Retire (Sponsored)
Start by taking a quick retirement quiz from SmartAsset that will match you with up to 3 financial advisors that serve your area and beyond in 5 minutes, or less.
Each advisor has been vetted by SmartAsset and is held to a fiduciary standard to act in your best interests.
Here’s how it works:
1. Answer SmartAsset advisor match quiz
2. Review your pre-screened matches at your leisure. Check out the advisors’ profiles.
3. Speak with advisors at no cost to you. Have an introductory call on the phone or introduction in person and choose whom to work with in the future
Thank you for reading! Have some feedback for us?
Contact the 24/7 Wall St. editorial team.
 24/7 Wall St.

 24/7 Wall St.



 24/7 Wall St.


