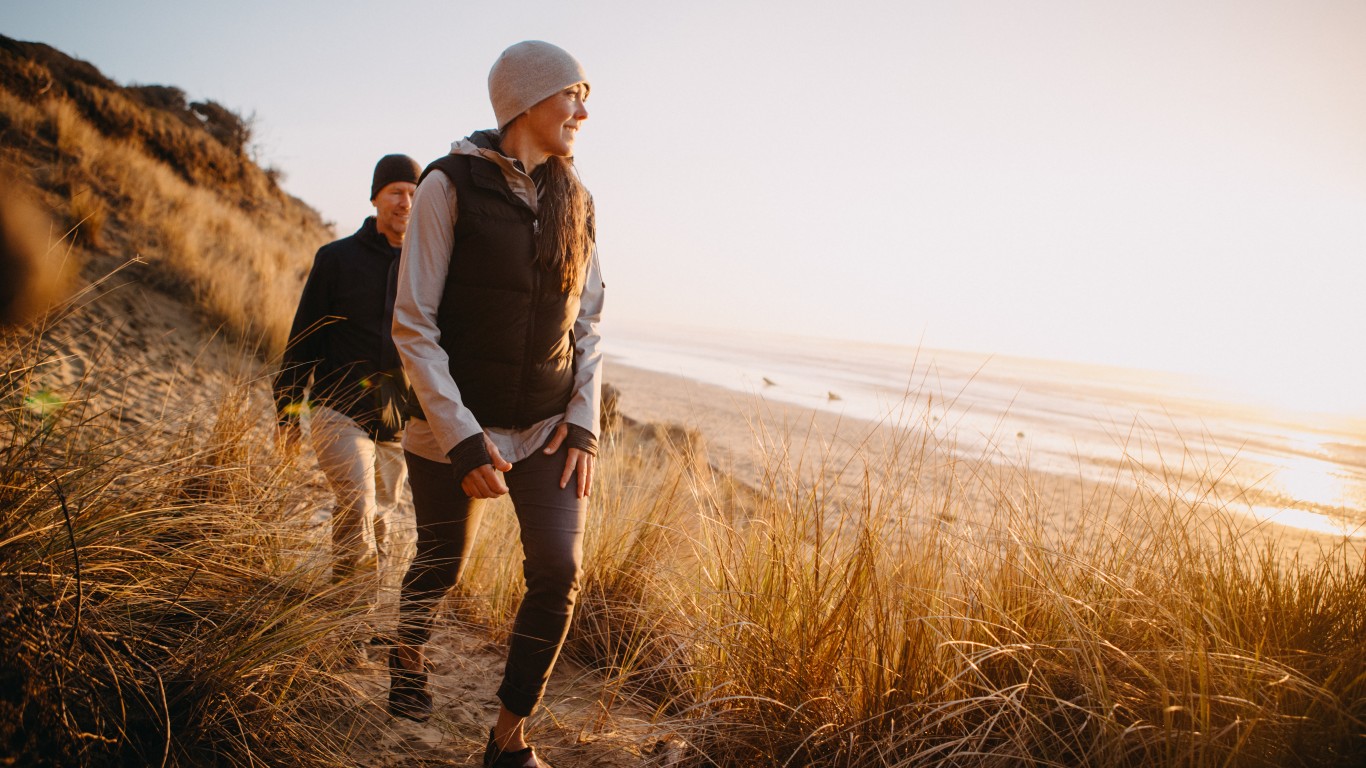
Exercise is one of the most effective ways for people to improve their overall health. Regular exercise has been shown to reduce the risk of depression, weight gain, and certain chronic diseases, while improving cognitive function, sleep quality, and physical balance — among many other benefits.
Though the importance of physical activity is well established, over 55 million American adults lead completely sedentary lifestyles. Physical inactivity accounts for about one in every 10 premature deaths in the U.S. and also has broader social costs — presenting an estimated $117 billion burden on the health care system annually, according to the Centers for Disease Control and Prevention.
While insufficient exercise is a major public health challenge in the United States, there are parts of the country where adults are far more likely than average to lead active lifestyles.
Using data from County Health Rankings & Roadmaps, a Robert Wood Johnson Foundation and University of Wisconsin Population Health Institute joint program, 24/7 Wall St. identified the 50 most physically active counties in the United States.
In every county on this list, the share of adults who exercise is higher than 85%, compared to 77.3% of adults nationwide. The vast majority of these counties are located in Western states, including 15 in Colorado alone.
Given the benefits associated with regular exercise, it is perhaps not surprising that overall health outcomes are often better in places where larger shares of the population are physically active. For example, in the vast majority of counties on this list, both the obesity rate and the share of adults who report being in fair or poor health are lower than the respective national averages of 29.7% and 16.5%. Here is a look at the most obese states in America.
Click here to see America’s most active counties
Click here to read our detailed methodology

50. Wayne County, Utah
> Adults who exercise: 85.3%
> Pop. with access to places for physical activity: 43.8% — 598th lowest of 3,100 counties
> Adult obesity rate: 22.4% — 111th lowest of 3,106 counties
> Adults with diabetes: 7.8% — 234th lowest of 3,106 counties
> Adults reporting poor or fair health: 15.2% — 567th lowest of 3,106 counties
> Physically unhealthy days per month: 3.8 — 792nd lowest of 3,106 counties
[in-text-ad]

49. Alameda County, California
> Adults who exercise: 85.4%
> Pop. with access to places for physical activity: 99.7% — 69th highest of 3,100 counties
> Adult obesity rate: 22.2% — 102nd lowest of 3,106 counties
> Adults with diabetes: 7.0% — 119th lowest of 3,106 counties (tied)
> Adults reporting poor or fair health: 15.0% — 519th lowest of 3,106 counties
> Physically unhealthy days per month: 3.8 — 746th lowest of 3,106 counties

48. San Francisco County, California
> Adults who exercise: 85.4%
> Pop. with access to places for physical activity: 100.0% — the highest of 3,100 counties (tied)
> Adult obesity rate: 16.9% — 18th lowest of 3,106 counties
> Adults with diabetes: 6.1% — 54th lowest of 3,106 counties
> Adults reporting poor or fair health: 12.6% — 119th lowest of 3,106 counties
> Physically unhealthy days per month: 3.2 — 144th lowest of 3,106 counties

47. Tompkins County, New York
> Adults who exercise: 85.4%
> Pop. with access to places for physical activity: 86.2% — 490th highest of 3,100 counties
> Adult obesity rate: 23.0% — 134th lowest of 3,106 counties
> Adults with diabetes: 6.5% — 80th lowest of 3,106 counties
> Adults reporting poor or fair health: 13.5% — 219th lowest of 3,106 counties
> Physically unhealthy days per month: 3.5 — 432nd lowest of 3,106 counties
[in-text-ad-2]

46. Orange County, California
> Adults who exercise: 85.5%
> Pop. with access to places for physical activity: 99.7% — 68th highest of 3,100 counties
> Adult obesity rate: 19.9% — 42nd lowest of 3,106 counties (tied)
> Adults with diabetes: 8.6% — 447th lowest of 3,106 counties (tied)
> Adults reporting poor or fair health: 16.9% — 924th lowest of 3,106 counties
> Physically unhealthy days per month: 4 — 1,016th lowest of 3,106 counties

45. Thurston County, Washington
> Adults who exercise: 85.6%
> Pop. with access to places for physical activity: 74.6% — 1,089th highest of 3,100 counties
> Adult obesity rate: 30.1% — 838th lowest of 3,106 counties (tied)
> Adults with diabetes: 10.2% — 963rd lowest of 3,106 counties (tied)
> Adults reporting poor or fair health: 15.4% — 608th lowest of 3,106 counties
> Physically unhealthy days per month: 3.8 — 787th lowest of 3,106 counties
[in-text-ad]
44. Ozaukee County, Wisconsin
> Adults who exercise: 85.6%
> Pop. with access to places for physical activity: 89.2% — 394th highest of 3,100 counties
> Adult obesity rate: 23.6% — 158th lowest of 3,106 counties
> Adults with diabetes: 7.6% — 211th lowest of 3,106 counties
> Adults reporting poor or fair health: 10.9% — 15th lowest of 3,106 counties
> Physically unhealthy days per month: 3 — 43rd lowest of 3,106 counties

43. Washington County, Oregon
> Adults who exercise: 85.7%
> Pop. with access to places for physical activity: 97.7% — 122nd highest of 3,100 counties
> Adult obesity rate: 29.0% — 666th lowest of 3,106 counties
> Adults with diabetes: 8.4% — 394th lowest of 3,106 counties (tied)
> Adults reporting poor or fair health: 14.7% — 456th lowest of 3,106 counties
> Physically unhealthy days per month: 3.8 — 762nd lowest of 3,106 counties

42. Kane County, Illinois
> Adults who exercise: 85.7%
> Pop. with access to places for physical activity: 96.4% — 162nd highest of 3,100 counties
> Adult obesity rate: 28.3% — 560th lowest of 3,106 counties
> Adults with diabetes: 10.1% — 924th lowest of 3,106 counties (tied)
> Adults reporting poor or fair health: 16.3% — 810th lowest of 3,106 counties
> Physically unhealthy days per month: 3.7 — 639th lowest of 3,106 counties
[in-text-ad-2]

41. Blaine County, Idaho
> Adults who exercise: 85.8%
> Pop. with access to places for physical activity: 78.4% — 864th highest of 3,100 counties
> Adult obesity rate: 16.5% — 16th lowest of 3,106 counties
> Adults with diabetes: 5.9% — 44th lowest of 3,106 counties
> Adults reporting poor or fair health: 16.1% — 753rd lowest of 3,106 counties
> Physically unhealthy days per month: 3.8 — 722nd lowest of 3,106 counties

40. Clear Creek County, Colorado
> Adults who exercise: 85.8%
> Pop. with access to places for physical activity: 81.8% — 697th highest of 3,100 counties
> Adult obesity rate: 21.2% — 68th lowest of 3,106 counties
> Adults with diabetes: 6.3% — 67th lowest of 3,106 counties
> Adults reporting poor or fair health: 10.8% — 12th lowest of 3,106 counties
> Physically unhealthy days per month: 3 — 47th lowest of 3,106 counties
[in-text-ad]

39. Multnomah County, Oregon
> Adults who exercise: 85.9%
> Pop. with access to places for physical activity: 97.5% — 129th highest of 3,100 counties
> Adult obesity rate: 23.9% — 180th lowest of 3,106 counties
> Adults with diabetes: 7.9% — 261st lowest of 3,106 counties
> Adults reporting poor or fair health: 16.6% — 872nd lowest of 3,106 counties
> Physically unhealthy days per month: 4.5 — 1,415th highest of 3,106 counties
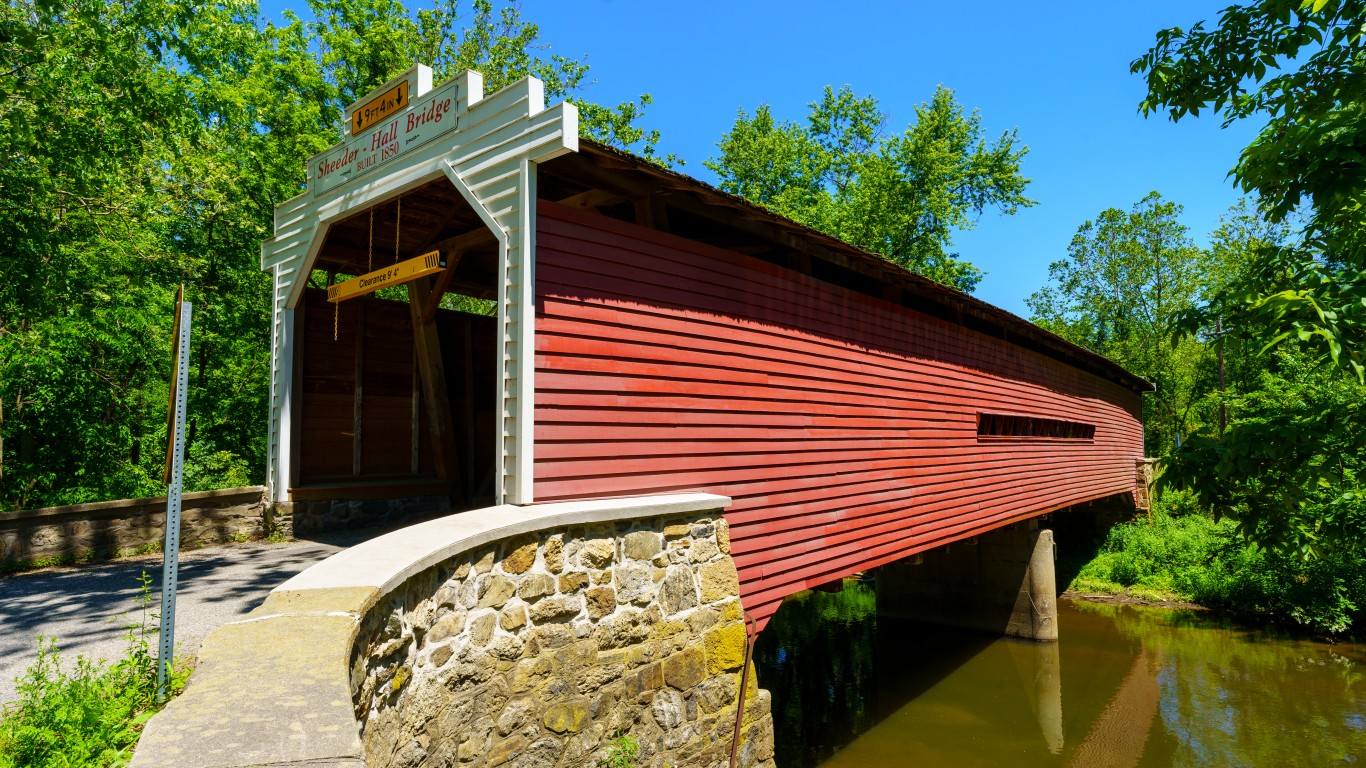
38. Chester County, Pennsylvania
> Adults who exercise: 85.9%
> Pop. with access to places for physical activity: 85.5% — 526th highest of 3,100 counties
> Adult obesity rate: 22.1% — 96th lowest of 3,106 counties (tied)
> Adults with diabetes: 8.9% — 540th lowest of 3,106 counties (tied)
> Adults reporting poor or fair health: 12.9% — 140th lowest of 3,106 counties
> Physically unhealthy days per month: 3.1 — 74th lowest of 3,106 counties

37. San Juan County, Washington
> Adults who exercise: 85.9%
> Pop. with access to places for physical activity: 86.4% — 483rd highest of 3,100 counties
> Adult obesity rate: 20.1% — 46th lowest of 3,106 counties
> Adults with diabetes: 6.1% — 53rd lowest of 3,106 counties
> Adults reporting poor or fair health: 13.0% — 157th lowest of 3,106 counties
> Physically unhealthy days per month: 3.4 — 350th lowest of 3,106 counties
[in-text-ad-2]

36. Santa Barbara County, California
> Adults who exercise: 86.0%
> Pop. with access to places for physical activity: 92.2% — 276th highest of 3,100 counties
> Adult obesity rate: 24.2% — 202nd lowest of 3,106 counties
> Adults with diabetes: 8.0% — 281st lowest of 3,106 counties (tied)
> Adults reporting poor or fair health: 19.3% — 1,490th lowest of 3,106 counties
> Physically unhealthy days per month: 4.2 — 1,269th lowest of 3,106 counties
35. Pierce County, Wisconsin
> Adults who exercise: 86.1%
> Pop. with access to places for physical activity: 74.8% — 1,068th highest of 3,100 counties
> Adult obesity rate: 30.7% — 945th lowest of 3,106 counties
> Adults with diabetes: 7.5% — 199th lowest of 3,106 counties
> Adults reporting poor or fair health: 13.8% — 275th lowest of 3,106 counties
> Physically unhealthy days per month: 3.5 — 423rd lowest of 3,106 counties
[in-text-ad]
34. Benton County, Oregon
> Adults who exercise: 86.1%
> Pop. with access to places for physical activity: 90.3% — 350th highest of 3,100 counties
> Adult obesity rate: 21.6% — 82nd lowest of 3,106 counties
> Adults with diabetes: 5.7% — 36th lowest of 3,106 counties
> Adults reporting poor or fair health: 16.1% — 736th lowest of 3,106 counties
> Physically unhealthy days per month: 4.1 — 1,057th lowest of 3,106 counties
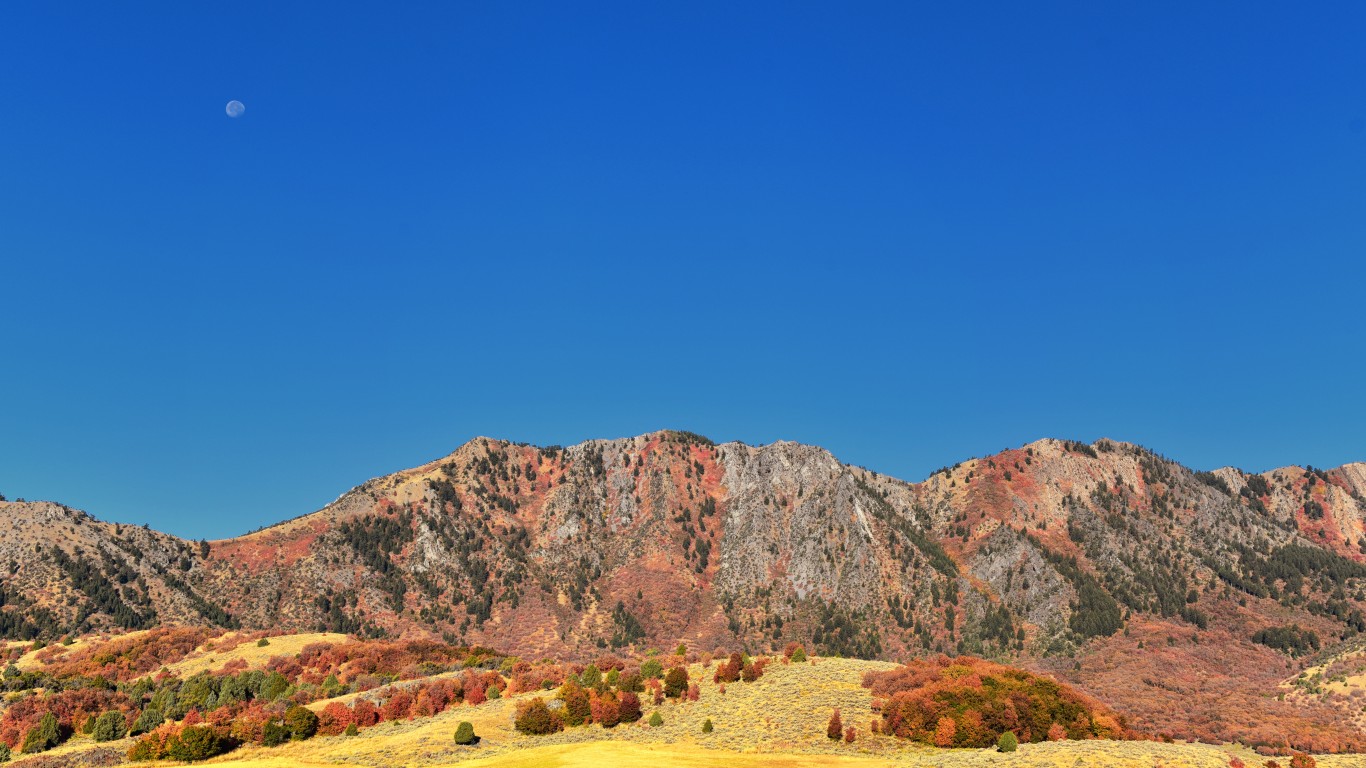
33. Cache County, Utah
> Adults who exercise: 86.1%
> Pop. with access to places for physical activity: 86.0% — 502nd highest of 3,100 counties
> Adult obesity rate: 24.5% — 220th lowest of 3,106 counties
> Adults with diabetes: 5.9% — 45th lowest of 3,106 counties
> Adults reporting poor or fair health: 15.0% — 520th lowest of 3,106 counties
> Physically unhealthy days per month: 4 — 994th lowest of 3,106 counties

32. Nevada County, California
> Adults who exercise: 86.2%
> Pop. with access to places for physical activity: 81.1% — 732nd highest of 3,100 counties
> Adult obesity rate: 18.1% — 24th lowest of 3,106 counties
> Adults with diabetes: 5.5% — 25th lowest of 3,106 counties
> Adults reporting poor or fair health: 13.9% — 302nd lowest of 3,106 counties
> Physically unhealthy days per month: 3.8 — 759th lowest of 3,106 counties
[in-text-ad-2]

31. Grand County, Colorado
> Adults who exercise: 86.3%
> Pop. with access to places for physical activity: 74.7% — 1,083rd highest of 3,100 counties
> Adult obesity rate: 18.0% — 23rd lowest of 3,106 counties
> Adults with diabetes: 6.5% — 77th lowest of 3,106 counties (tied)
> Adults reporting poor or fair health: 13.1% — 177th lowest of 3,106 counties
> Physically unhealthy days per month: 3.4 — 300th lowest of 3,106 counties
30. Dane County, Wisconsin
> Adults who exercise: 86.3%
> Pop. with access to places for physical activity: 94.1% — 216th highest of 3,100 counties
> Adult obesity rate: 23.2% — 140th lowest of 3,106 counties
> Adults with diabetes: 5.8% — 39th lowest of 3,106 counties
> Adults reporting poor or fair health: 12.1% — 71st lowest of 3,106 counties
> Physically unhealthy days per month: 3.3 — 236th lowest of 3,106 counties
[in-text-ad]

29. Placer County, California
> Adults who exercise: 86.3%
> Pop. with access to places for physical activity: 93.9% — 221st highest of 3,100 counties
> Adult obesity rate: 20.2% — 50th lowest of 3,106 counties (tied)
> Adults with diabetes: 7.0% — 118th lowest of 3,106 counties
> Adults reporting poor or fair health: 12.5% — 109th lowest of 3,106 counties
> Physically unhealthy days per month: 3.7 — 589th lowest of 3,106 counties

28. Mono County, California
> Adults who exercise: 86.4%
> Pop. with access to places for physical activity: 92.5% — 266th highest of 3,100 counties
> Adult obesity rate: 28.5% — 586th lowest of 3,106 counties
> Adults with diabetes: 10.7% — 1,150th lowest of 3,106 counties
> Adults reporting poor or fair health: 15.9% — 718th lowest of 3,106 counties
> Physically unhealthy days per month: 4 — 1,001st lowest of 3,106 counties
27. Chittenden County, Vermont
> Adults who exercise: 86.4%
> Pop. with access to places for physical activity: 87.5% — 452nd highest of 3,100 counties
> Adult obesity rate: 22.4% — 107th lowest of 3,106 counties
> Adults with diabetes: 6.7% — 94th lowest of 3,106 counties
> Adults reporting poor or fair health: 11.2% — 25th lowest of 3,106 counties
> Physically unhealthy days per month: 3.7 — 609th lowest of 3,106 counties
[in-text-ad-2]
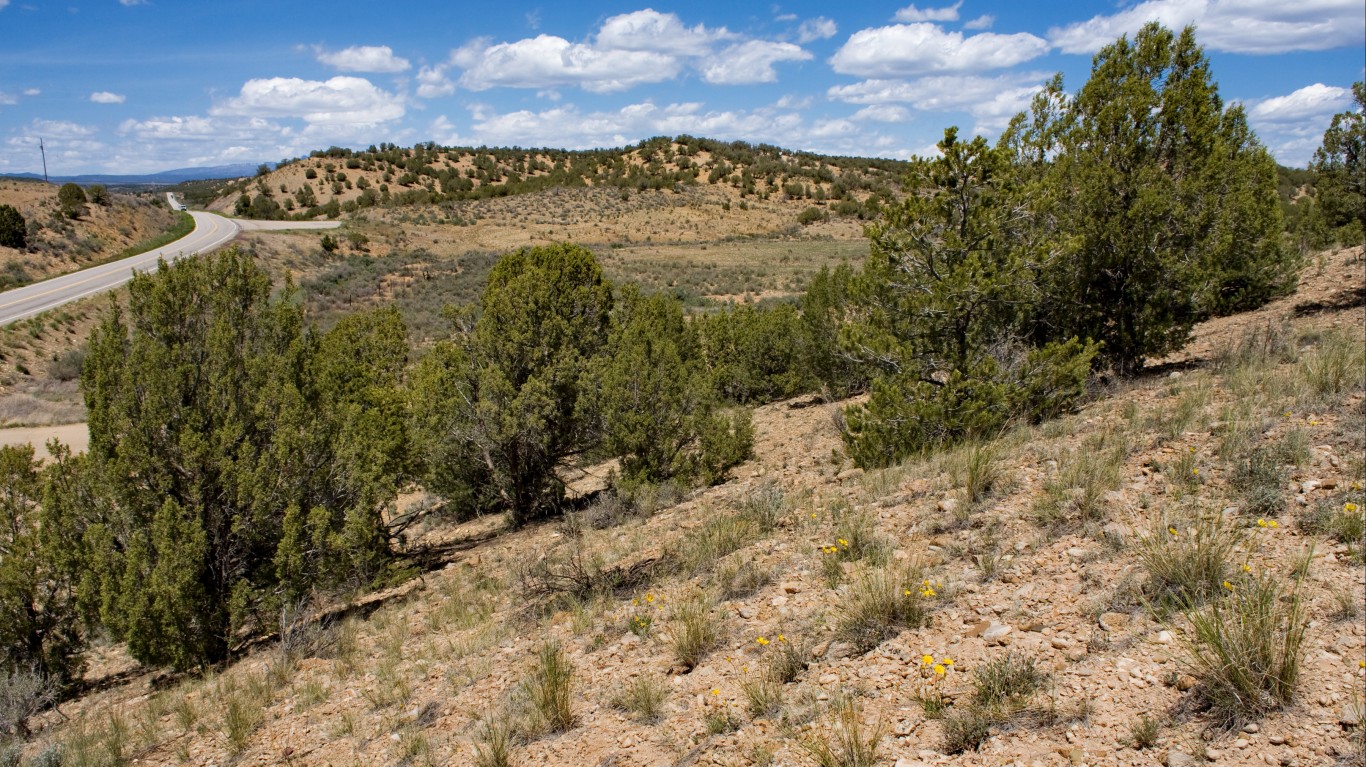
26. La Plata County, Colorado
> Adults who exercise: 86.5%
> Pop. with access to places for physical activity: 75.4% — 1,039th highest of 3,100 counties
> Adult obesity rate: 18.2% — 25th lowest of 3,106 counties
> Adults with diabetes: 5.4% — 22nd lowest of 3,106 counties
> Adults reporting poor or fair health: 12.7% — 121st lowest of 3,106 counties
> Physically unhealthy days per month: 3.3 — 204th lowest of 3,106 counties
25. Jefferson County, Iowa
> Adults who exercise: 86.6%
> Pop. with access to places for physical activity: 66.6% — 1,521st highest of 3,100 counties
> Adult obesity rate: 30.3% — 882nd lowest of 3,106 counties (tied)
> Adults with diabetes: 8.9% — 553rd lowest of 3,106 counties
> Adults reporting poor or fair health: 14.1% — 331st lowest of 3,106 counties
> Physically unhealthy days per month: 3.2 — 130th lowest of 3,106 counties
[in-text-ad]
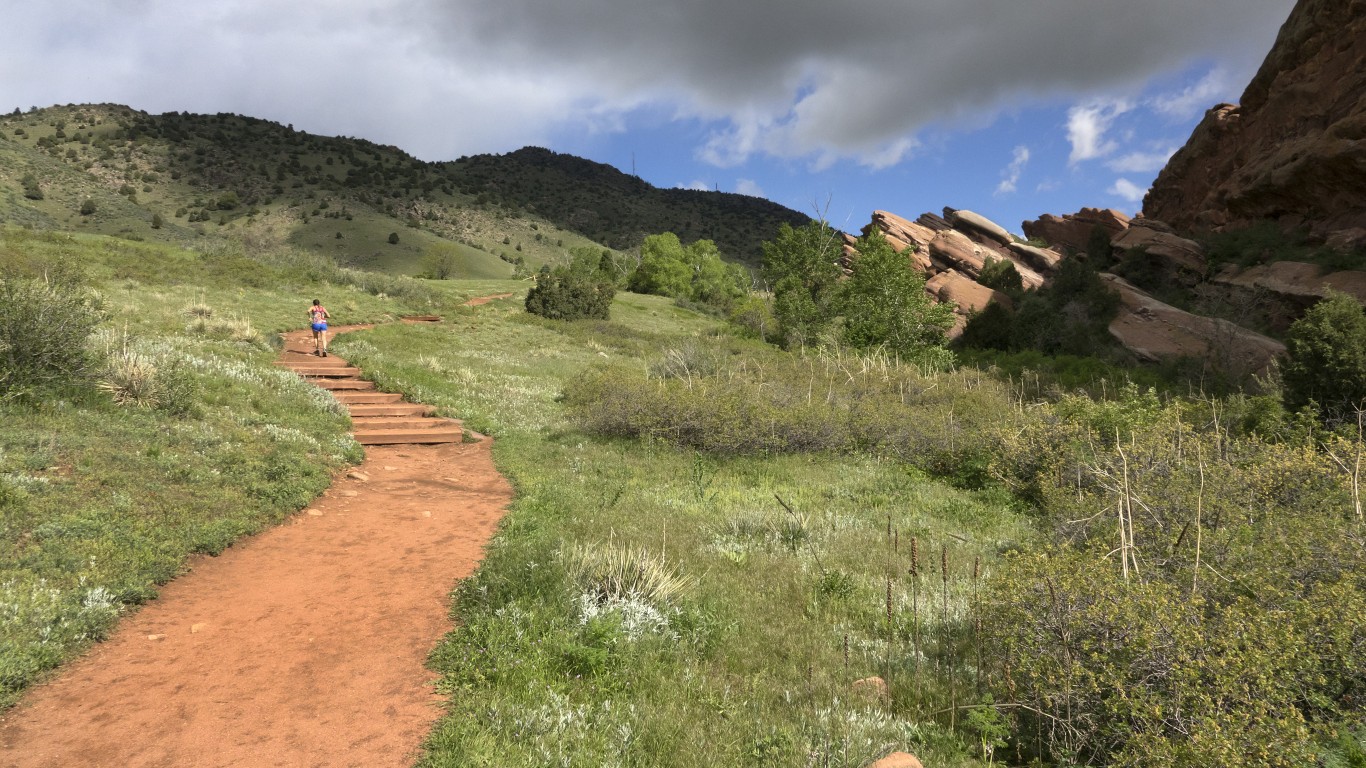
24. Jefferson County, Colorado
> Adults who exercise: 86.7%
> Pop. with access to places for physical activity: 99.2% — 85th highest of 3,100 counties
> Adult obesity rate: 21.2% — 66th lowest of 3,106 counties
> Adults with diabetes: 6.2% — 60th lowest of 3,106 counties
> Adults reporting poor or fair health: 11.6% — 46th lowest of 3,106 counties
> Physically unhealthy days per month: 3.3 — 210th lowest of 3,106 counties

23. King County, Washington
> Adults who exercise: 86.8%
> Pop. with access to places for physical activity: 97.4% — 130th highest of 3,100 counties
> Adult obesity rate: 22.5% — 114th lowest of 3,106 counties
> Adults with diabetes: 7.7% — 224th lowest of 3,106 counties (tied)
> Adults reporting poor or fair health: 12.4% — 93rd lowest of 3,106 counties
> Physically unhealthy days per month: 3.2 — 184th lowest of 3,106 counties

22. Marin County, California
> Adults who exercise: 86.9%
> Pop. with access to places for physical activity: 97.2% — 134th highest of 3,100 counties
> Adult obesity rate: 17.6% — 20th lowest of 3,106 counties
> Adults with diabetes: 8.2% — 329th lowest of 3,106 counties (tied)
> Adults reporting poor or fair health: 11.8% — 55th lowest of 3,106 counties
> Physically unhealthy days per month: 3.3 — 275th lowest of 3,106 counties
[in-text-ad-2]
21. Gallatin County, Montana
> Adults who exercise: 87.2%
> Pop. with access to places for physical activity: 81.8% — 698th highest of 3,100 counties
> Adult obesity rate: 19.1% — 34th lowest of 3,106 counties
> Adults with diabetes: 5.1% — 15th lowest of 3,106 counties
> Adults reporting poor or fair health: 11.3% — 31st lowest of 3,106 counties
> Physically unhealthy days per month: 3.3 — 208th lowest of 3,106 counties

20. Whatcom County, Washington
> Adults who exercise: 87.3%
> Pop. with access to places for physical activity: 85.1% — 543rd highest of 3,100 counties
> Adult obesity rate: 28.0% — 521st lowest of 3,106 counties (tied)
> Adults with diabetes: 7.9% — 262nd lowest of 3,106 counties (tied)
> Adults reporting poor or fair health: 15.0% — 523rd lowest of 3,106 counties
> Physically unhealthy days per month: 4.2 — 1,310th lowest of 3,106 counties
[in-text-ad]

19. Santa Fe County, New Mexico
> Adults who exercise: 87.3%
> Pop. with access to places for physical activity: 78.7% — 847th highest of 3,100 counties
> Adult obesity rate: 16.1% — 11th lowest of 3,106 counties
> Adults with diabetes: 6.1% — 55th lowest of 3,106 counties
> Adults reporting poor or fair health: 17.8% — 1,144th lowest of 3,106 counties
> Physically unhealthy days per month: 4 — 995th lowest of 3,106 counties

18. Denver County, Colorado
> Adults who exercise: 87.4%
> Pop. with access to places for physical activity: 99.5% — 81st highest of 3,100 counties
> Adult obesity rate: 17.3% — 19th lowest of 3,106 counties
> Adults with diabetes: 5.1% — 14th lowest of 3,106 counties
> Adults reporting poor or fair health: 15.5% — 628th lowest of 3,106 counties
> Physically unhealthy days per month: 3.4 — 284th lowest of 3,106 counties

17. Pitkin County, Colorado
> Adults who exercise: 87.7%
> Pop. with access to places for physical activity: 92.7% — 260th highest of 3,100 counties
> Adult obesity rate: 14.7% — 6th lowest of 3,106 counties
> Adults with diabetes: 3.9% — 4th lowest of 3,106 counties
> Adults reporting poor or fair health: 9.8% — 4th lowest of 3,106 counties
> Physically unhealthy days per month: 2.7 — 7th lowest of 3,106 counties
[in-text-ad-2]

16. Taos County, New Mexico
> Adults who exercise: 87.7%
> Pop. with access to places for physical activity: 82.9% — 643rd highest of 3,100 counties
> Adult obesity rate: 16.3% — 15th lowest of 3,106 counties
> Adults with diabetes: 7.2% — 152nd lowest of 3,106 counties (tied)
> Adults reporting poor or fair health: 21.4% — 1,175th highest of 3,106 counties
> Physically unhealthy days per month: 4.4 — 1,550th highest of 3,106 counties

15. Arlington County, Virginia
> Adults who exercise: 87.8%
> Pop. with access to places for physical activity: 100.0% — 55th highest of 3,100 counties
> Adult obesity rate: 18.6% — 28th lowest of 3,106 counties
> Adults with diabetes: 5.1% — 12th lowest of 3,106 counties (tied)
> Adults reporting poor or fair health: 11.2% — 28th lowest of 3,106 counties
> Physically unhealthy days per month: 2.8 — 14th lowest of 3,106 counties
[in-text-ad]

14. Summit County, Utah
> Adults who exercise: 87.8%
> Pop. with access to places for physical activity: 95.3% — 188th highest of 3,100 counties
> Adult obesity rate: 14.5% — 5th lowest of 3,106 counties
> Adults with diabetes: 4.8% — 9th lowest of 3,106 counties
> Adults reporting poor or fair health: 10.9% — 16th lowest of 3,106 counties
> Physically unhealthy days per month: 2.9 — 36th lowest of 3,106 counties
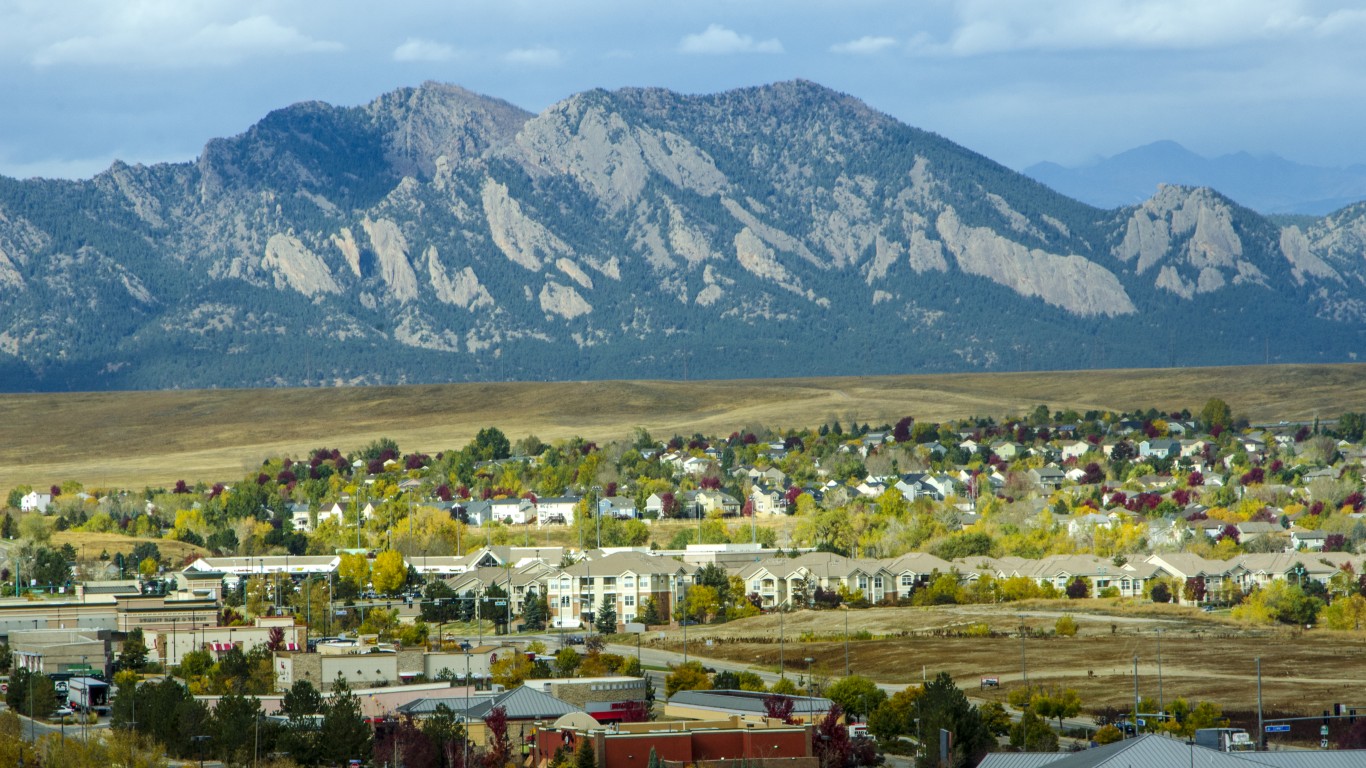
13. Broomfield County, Colorado
> Adults who exercise: 87.9%
> Pop. with access to places for physical activity: 99.5% — 82nd highest of 3,100 counties
> Adult obesity rate: 19.5% — 36th lowest of 3,106 counties
> Adults with diabetes: 6.9% — 107th lowest of 3,106 counties
> Adults reporting poor or fair health: 10.0% — 6th lowest of 3,106 counties
> Physically unhealthy days per month: 2.9 — 27th lowest of 3,106 counties

12. Gunnison County, Colorado
> Adults who exercise: 88.0%
> Pop. with access to places for physical activity: 90.9% — 330th highest of 3,100 counties
> Adult obesity rate: 14.2% — 3rd lowest of 3,106 counties
> Adults with diabetes: 3.1% — 2nd lowest of 3,106 counties
> Adults reporting poor or fair health: 12.3% — 82nd lowest of 3,106 counties
> Physically unhealthy days per month: 3.3 — 203rd lowest of 3,106 counties
[in-text-ad-2]

11. Archuleta County, Colorado
> Adults who exercise: 88.0%
> Pop. with access to places for physical activity: 89.4% — 383rd highest of 3,100 counties
> Adult obesity rate: 24.2% — 205th lowest of 3,106 counties
> Adults with diabetes: 5.8% — 43rd lowest of 3,106 counties
> Adults reporting poor or fair health: 13.7% — 262nd lowest of 3,106 counties
> Physically unhealthy days per month: 3.3 — 244th lowest of 3,106 counties
10. Larimer County, Colorado
> Adults who exercise: 88.4%
> Pop. with access to places for physical activity: 92.8% — 257th highest of 3,100 counties
> Adult obesity rate: 20.9% — 59th lowest of 3,106 counties
> Adults with diabetes: 5.4% — 21st lowest of 3,106 counties
> Adults reporting poor or fair health: 11.2% — 29th lowest of 3,106 counties
> Physically unhealthy days per month: 3.2 — 159th lowest of 3,106 counties
[in-text-ad]

9. Eagle County, Colorado
> Adults who exercise: 88.4%
> Pop. with access to places for physical activity: 97.8% — 114th highest of 3,100 counties
> Adult obesity rate: 16.1% — 12th lowest of 3,106 counties
> Adults with diabetes: 4.3% — 6th lowest of 3,106 counties
> Adults reporting poor or fair health: 12.9% — 143rd lowest of 3,106 counties
> Physically unhealthy days per month: 3 — 53rd lowest of 3,106 counties

8. Jefferson County, Washington
> Adults who exercise: 88.5%
> Pop. with access to places for physical activity: 85.1% — 545th highest of 3,100 counties
> Adult obesity rate: 21.3% — 69th lowest of 3,106 counties
> Adults with diabetes: 7.9% — 255th lowest of 3,106 counties
> Adults reporting poor or fair health: 14.5% — 409th lowest of 3,106 counties
> Physically unhealthy days per month: 3.8 — 777th lowest of 3,106 counties

7. Los Alamos County, New Mexico
> Adults who exercise: 88.9%
> Pop. with access to places for physical activity: 99.2% — 86th highest of 3,100 counties
> Adult obesity rate: 23.4% — 147th lowest of 3,106 counties
> Adults with diabetes: 6.8% — 104th lowest of 3,106 counties
> Adults reporting poor or fair health: 9.4% — 3rd lowest of 3,106 counties
> Physically unhealthy days per month: 2.7 — 8th lowest of 3,106 counties
[in-text-ad-2]

6. Santa Cruz County, California
> Adults who exercise: 88.9%
> Pop. with access to places for physical activity: 94.0% — 217th highest of 3,100 counties
> Adult obesity rate: 19.3% — 35th lowest of 3,106 counties
> Adults with diabetes: 6.2% — 61st lowest of 3,106 counties (tied)
> Adults reporting poor or fair health: 16.3% — 790th lowest of 3,106 counties
> Physically unhealthy days per month: 4 — 945th lowest of 3,106 counties

5. Teton County, Wyoming
> Adults who exercise: 89.2%
> Pop. with access to places for physical activity: 99.7% — 65th highest of 3,100 counties
> Adult obesity rate: 11.0% — the lowest of 3,106 counties
> Adults with diabetes: 2.4% — the lowest of 3,106 counties
> Adults reporting poor or fair health: 11.4% — 36th lowest of 3,106 counties
> Physically unhealthy days per month: 2.9 — 38th lowest of 3,106 counties
[in-text-ad]
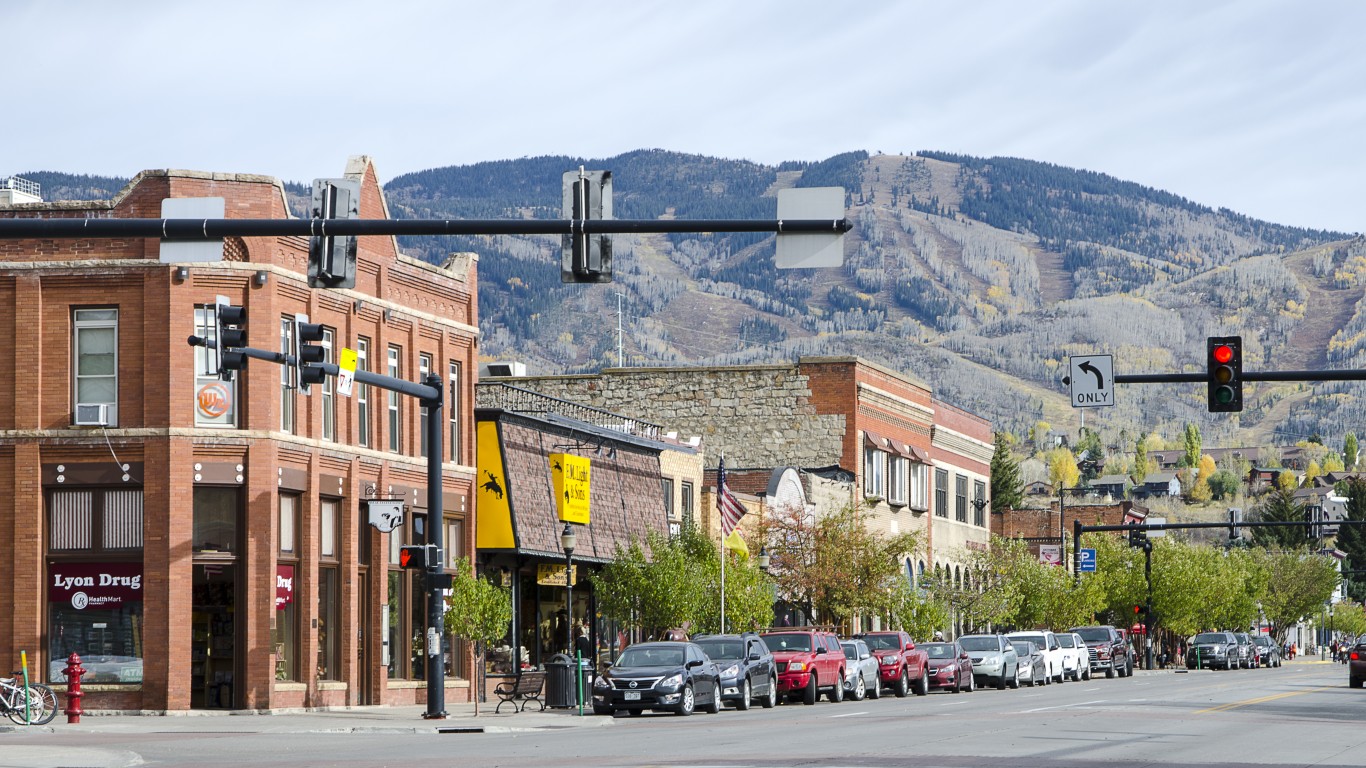
4. Routt County, Colorado
> Adults who exercise: 89.8%
> Pop. with access to places for physical activity: 86.4% — 484th highest of 3,100 counties
> Adult obesity rate: 16.1% — 10th lowest of 3,106 counties
> Adults with diabetes: 5.3% — 18th lowest of 3,106 counties
> Adults reporting poor or fair health: 11.2% — 26th lowest of 3,106 counties
> Physically unhealthy days per month: 3.1 — 73rd lowest of 3,106 counties

3. Summit County, Colorado
> Adults who exercise: 89.8%
> Pop. with access to places for physical activity: 100.0% — the highest of 3,100 counties (tied)
> Adult obesity rate: 15.4% — 7th lowest of 3,106 counties
> Adults with diabetes: 4.0% — 5th lowest of 3,106 counties
> Adults reporting poor or fair health: 11.9% — 59th lowest of 3,106 counties
> Physically unhealthy days per month: 3 — 54th lowest of 3,106 counties
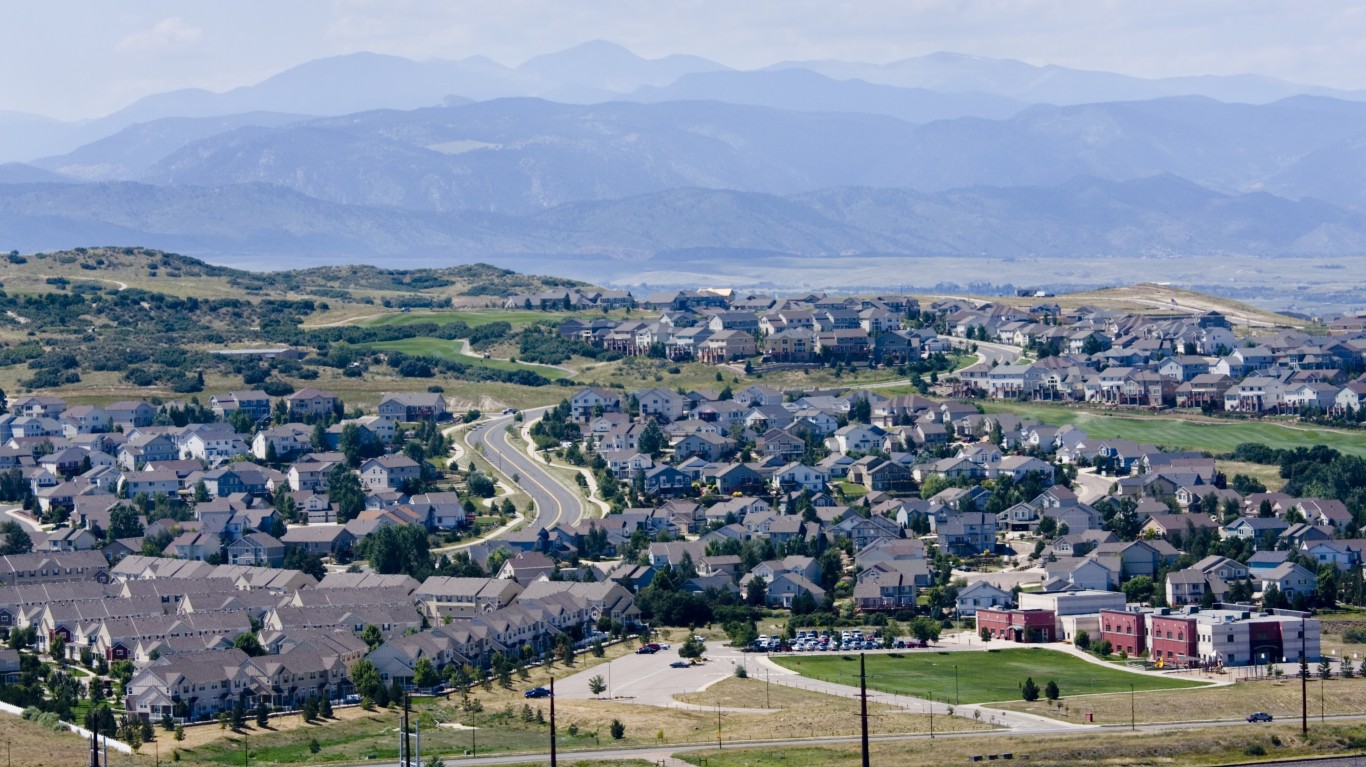
2. Douglas County, Colorado
> Adults who exercise: 91.0%
> Pop. with access to places for physical activity: 93.4% — 237th highest of 3,100 counties
> Adult obesity rate: 20.1% — 48th lowest of 3,106 counties
> Adults with diabetes: 5.6% — 28th lowest of 3,106 counties (tied)
> Adults reporting poor or fair health: 8.6% — the lowest of 3,106 counties
> Physically unhealthy days per month: 2.6 — 4th lowest of 3,106 counties
[in-text-ad-2]
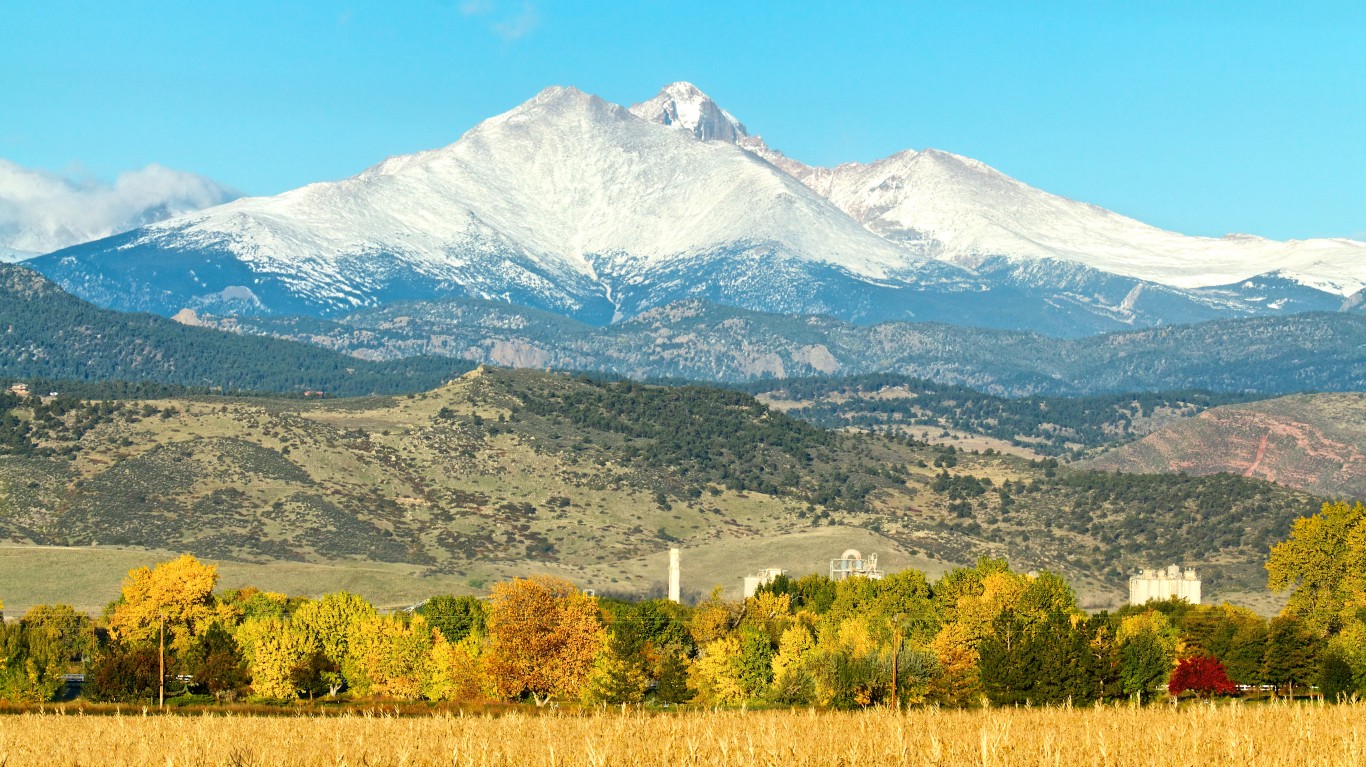
1. Boulder County, Colorado
> Adults who exercise: 91.1%
> Pop. with access to places for physical activity: 96.2% — 171st highest of 3,100 counties
> Adult obesity rate: 14.3% — 4th lowest of 3,106 counties
> Adults with diabetes: 5.5% — 24th lowest of 3,106 counties
> Adults reporting poor or fair health: 11.2% — 27th lowest of 3,106 counties
> Physically unhealthy days per month: 3 — 67th lowest of 3,106 counties
To determine America’s most active counties, 24/7 Wall St. reviewed adult physical inactivity rates from the Robert Wood Johnson Foundation and the University of Wisconsin Population Health Institute joint program’s 2021 County Health Rankings & Roadmaps report.
The physical inactivity rate is defined as the share of adults 20 years and older who report no leisure-time physical activity. While the CHR report is from 2021, physical inactivity figures published in the report are from 2017.
Of the 3,220 counties or county equivalents, 3,142 had boundaries that fell within one of the 50 states or the District of Columbia.
Counties with a 2019 five-year population estimate from the U.S. Census Bureau of less than 1,000 were excluded.
The remaining 3,106 places were ranked based on the adult physical inactivity rate. Additional information on the share of the population with adequate access to locations for physical activity, the share of adults 20 years and older who report a body mass index of 30 kg/m2 or higher (considered obese), the share of adults 20 years and older with diagnosed diabetes, the share of adults reporting poor or fair health, and the average number of physically unhealthy days reported in the past 30 days also came from the 2021 CHR.
Cash Back Credit Cards Have Never Been This Good
Credit card companies are at war, handing out free rewards and benefits to win the best customers. A good cash back card can be worth thousands of dollars a year in free money, not to mention other perks like travel, insurance, and access to fancy lounges. See our top picks for the best credit cards today. You won’t want to miss some of these offers.
Flywheel Publishing has partnered with CardRatings for our coverage of credit card products. Flywheel Publishing and CardRatings may receive a commission from card issuers.
Thank you for reading! Have some feedback for us?
Contact the 24/7 Wall St. editorial team.
 24/7 Wall St.
 24/7 Wall St.
 24/7 Wall St.


 24/7 Wall St.


