
Life expectancy is one of the most important and commonly cited indicators of population health — and in the United States, life expectancy is falling at a historic rate. According to the Centers for Disease Control and Prevention, life expectancy at birth declined by 1.5 years in 2020, the largest one-year decline since World War II.
The CDC attributes the decline to the COVID-19 pandemic and 93,000 drug overdose deaths — an all-time one-year high. Homicide, diabetes, and liver disease were also contributing factors. Here is a look at the states with the most drug overdose deaths in 2020.
While the national trend is alarming, there are parts of the country where life expectancy is far higher than the national average. Using data from County Health Rankings & Roadmaps, a Robert Wood Johnson Foundation and University of Wisconsin Population Health Institute joint program, 24/7 Tempo identified the 50 U.S. metro areas with the longest average life expectancy at birth. It is important to note that life expectancy figures are averages for the years 2017 through 2019 — the most recent period for which metro-level data is available — so they are pre-pandemic.
Among the metro areas on this list, average life expectancy at birth ranges from 81 years to over 86 years — compared to the national average of 79.2 years. Half of the metro areas on this list are located in Western states, including a dozen in California alone.
Variations in life expectancy are tied to a number of both economic and behavioral factors. For example, tobacco use is the leading cause of preventable death in the U.S., and in the majority of metro areas on this list, the share of adults who smoke is below the 16.6% national average. Here is a look at the American cities where the most people smoke.
Income levels are also linked to life expectancy. Poverty, for example, presents challenges and stressors that can take a cumulative toll on both physical and mental health. Additionally, lower-income Americans are less able to afford adequate health care or a range of healthy options related to diet and lifestyle. Recent studies have shown that life expectancy among the wealthiest 1% of Americans exceeds that of the poorest 1% by well over a decade. In most metro areas on this list, the poverty rate is below the 12.3% national average.
Click here to see the metros with the longest life expectancy
Click here to read our detailed methodology
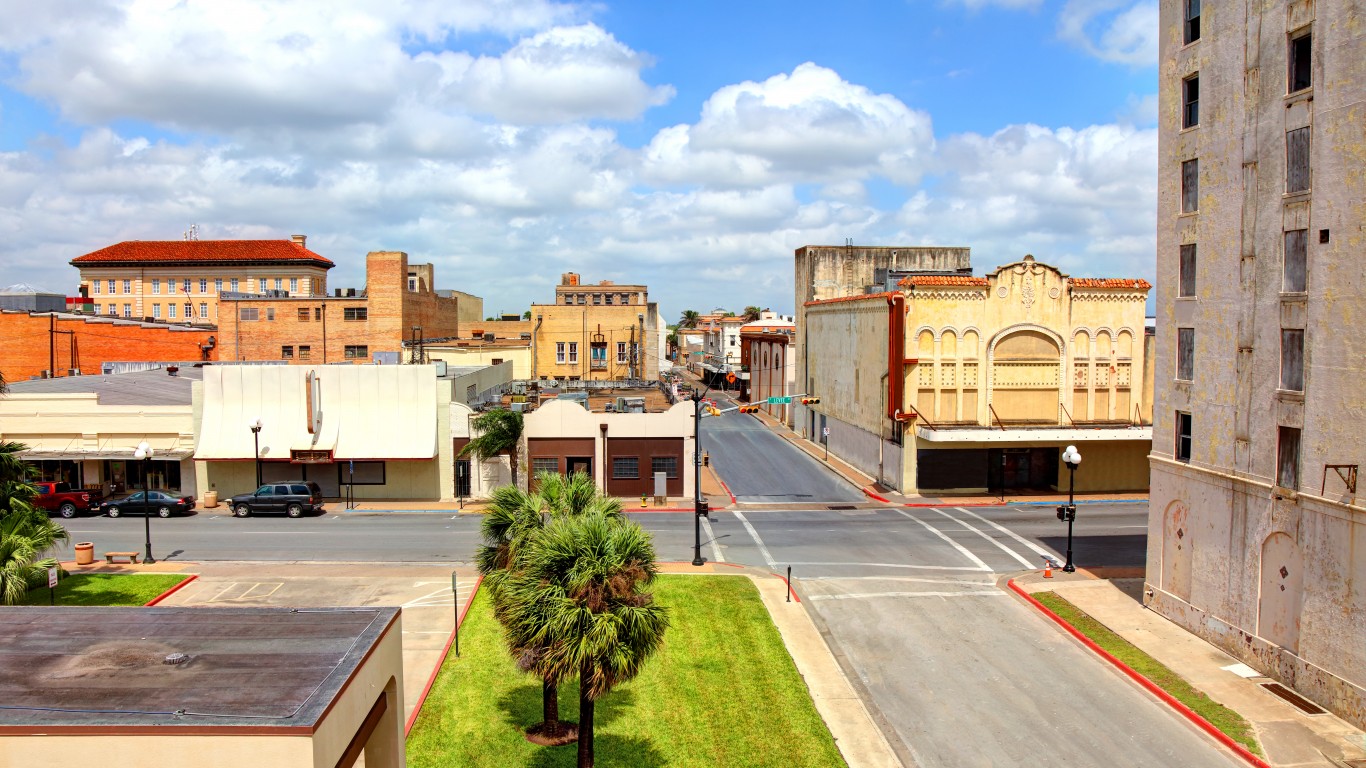
50. Brownsville-Harlingen, TX
> Life expectancy at birth (years): 81.0
> Adults reporting poor or fair health: 34.1% — 2nd highest of 384 metros
> Adult obesity rate: 31.2% — 166th lowest of 384 metros
> Smoking rate: 17.8% — 139th lowest of 384 metros
> Population without health insurance: 30.0% — 2nd highest of 384 metros
> Median household income: $41,123 — 3rd lowest of 384 metros
> Poverty rate: 25.6% — 4th highest of 384 metros
[in-text-ad]

49. Raleigh-Cary, NC
> Life expectancy at birth (years): 81.1
> Adults reporting poor or fair health: 14.9% — 53rd lowest of 384 metros
> Adult obesity rate: 29.3% — 108th lowest of 384 metros
> Smoking rate: 15.6% — 55th lowest of 384 metros
> Population without health insurance: 9.3% — 153rd highest of 384 metros
> Median household income: $80,096 — 28th highest of 384 metros
> Poverty rate: 8.9% — 42nd lowest of 384 metros
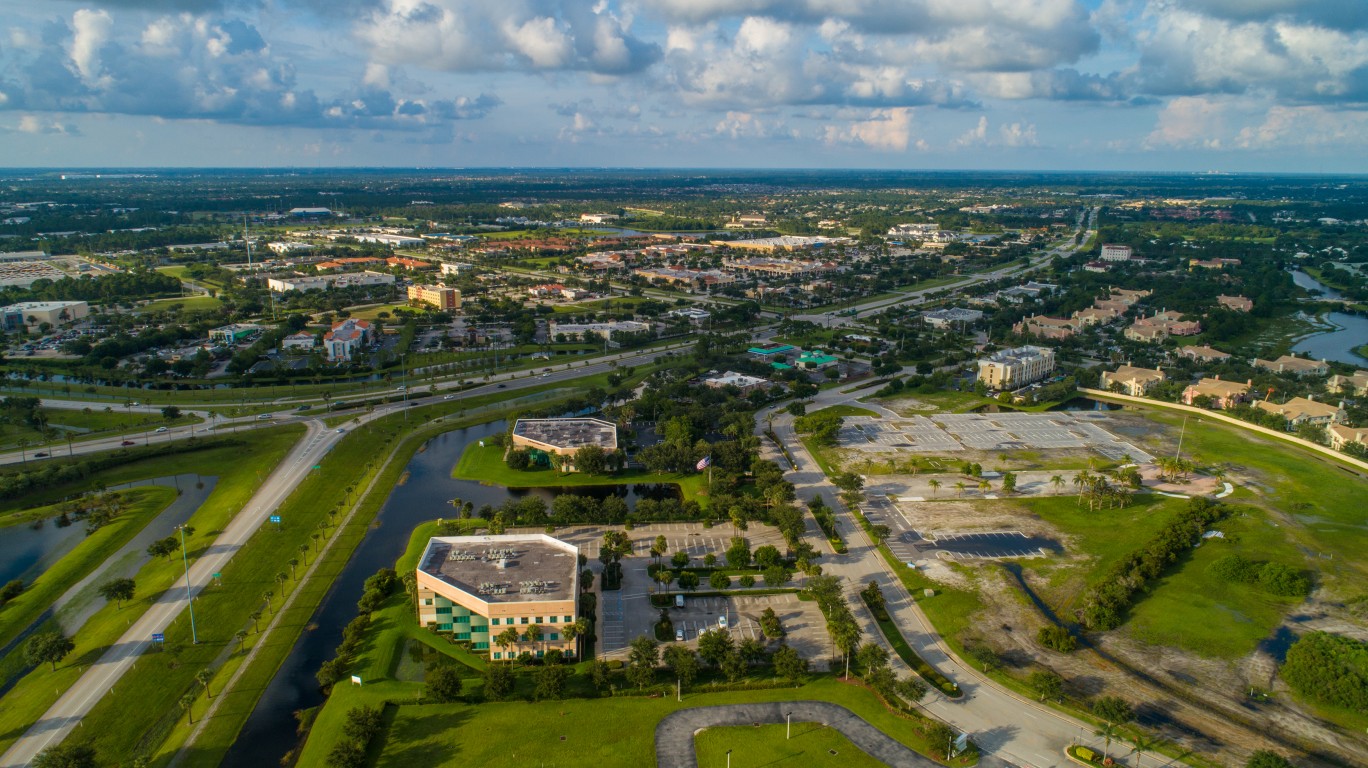
48. Port St. Lucie, FL
> Life expectancy at birth (years): 81.1
> Adults reporting poor or fair health: 19.7% — 139th highest of 384 metros
> Adult obesity rate: 27.3% — 63rd lowest of 384 metros
> Smoking rate: 19.7% — 166th highest of 384 metros
> Population without health insurance: 12.4% — 65th highest of 384 metros
> Median household income: $62,608 — 133rd highest of 384 metros
> Poverty rate: 8.9% — 43rd lowest of 384 metros

47. Punta Gorda, FL
> Life expectancy at birth (years): 81.1
> Adults reporting poor or fair health: 18.1% — 173rd lowest of 384 metros
> Adult obesity rate: 27.6% — 67th lowest of 384 metros
> Smoking rate: 21.3% — 88th highest of 384 metros
> Population without health insurance: 10.9% — 109th highest of 384 metros
> Median household income: $54,652 — 121st lowest of 384 metros
> Poverty rate: 12.0% — 153rd lowest of 384 metros
[in-text-ad-2]

46. Logan, UT-ID
> Life expectancy at birth (years): 81.1
> Adults reporting poor or fair health: 15.2% — 63rd lowest of 384 metros
> Adult obesity rate: 25.0% — 33rd lowest of 384 metros
> Smoking rate: 11.0% — 6th lowest of 384 metros
> Population without health insurance: 6.3% — 118th lowest of 384 metros
> Median household income: $61,467 — 153rd highest of 384 metros
> Poverty rate: 14.7% — 122nd highest of 384 metros

45. Sebastian-Vero Beach, FL
> Life expectancy at birth (years): 81.2
> Adults reporting poor or fair health: 18.6% — 188th highest of 384 metros
> Adult obesity rate: 26.6% — 51st lowest of 384 metros
> Smoking rate: 20.6% — 119th highest of 384 metros
> Population without health insurance: 13.2% — 46th highest of 384 metros
> Median household income: $59,782 — 189th highest of 384 metros
> Poverty rate: 12.3% — 168th lowest of 384 metros
[in-text-ad]
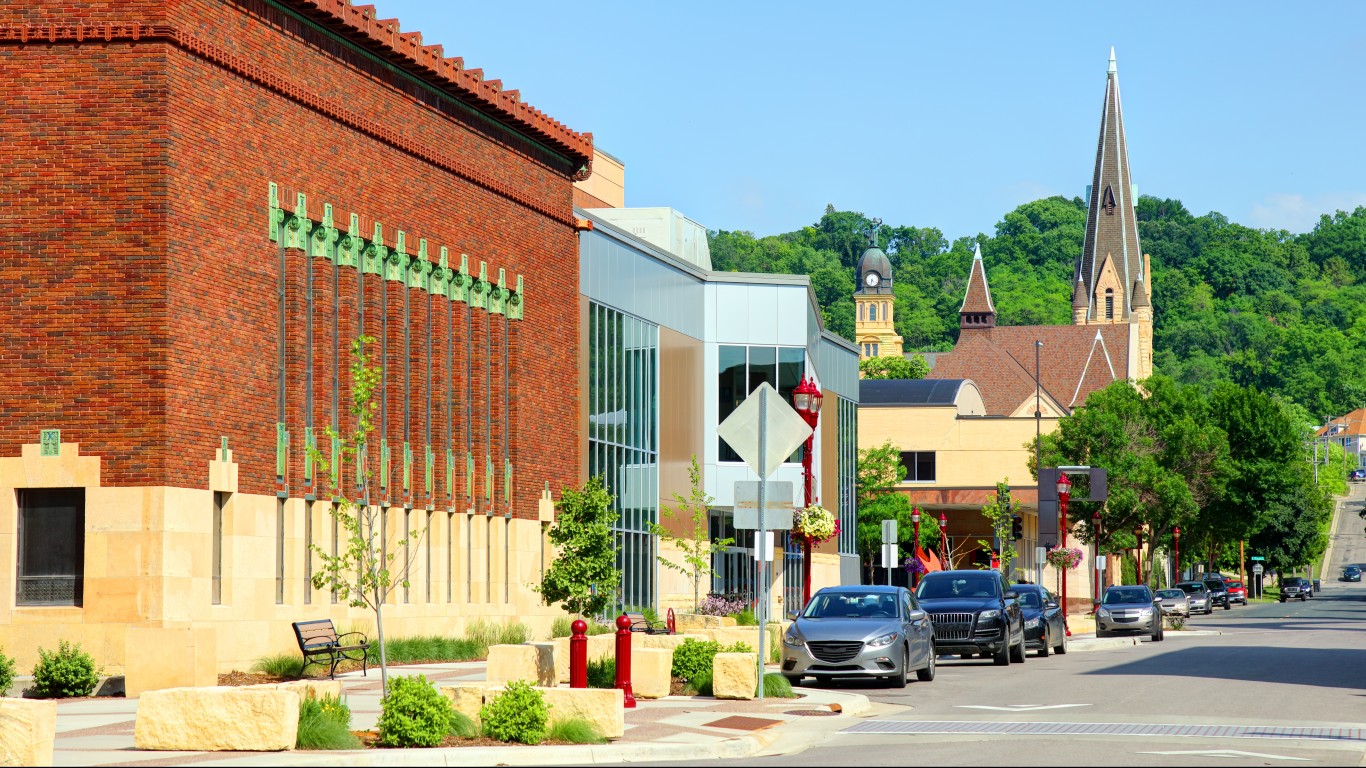
44. Mankato, MN
> Life expectancy at birth (years): 81.2
> Adults reporting poor or fair health: 14.1% — 37th lowest of 384 metros
> Adult obesity rate: 32.6% — 169th highest of 384 metros
> Smoking rate: 18.7% — 178th lowest of 384 metros
> Population without health insurance: 5.0% — 61st lowest of 384 metros
> Median household income: $63,126 — 126th highest of 384 metros
> Poverty rate: 16.1% — 84th highest of 384 metros

43. Seattle-Tacoma-Bellevue, WA
> Life expectancy at birth (years): 81.3
> Adults reporting poor or fair health: 14.0% — 32nd lowest of 384 metros
> Adult obesity rate: 26.1% — 47th lowest of 384 metros
> Smoking rate: 11.9% — 9th lowest of 384 metros
> Population without health insurance: 5.9% — 100th lowest of 384 metros
> Median household income: $94,027 — 6th highest of 384 metros
> Poverty rate: 7.8% — 21st lowest of 384 metros

42. Minneapolis-St. Paul-Bloomington, MN-WI
> Life expectancy at birth (years): 81.3
> Adults reporting poor or fair health: 12.0% — 6th lowest of 384 metros
> Adult obesity rate: 27.1% — 61st lowest of 384 metros
> Smoking rate: 15.0% — 42nd lowest of 384 metros
> Population without health insurance: 4.5% — 40th lowest of 384 metros
> Median household income: $83,698 — 19th highest of 384 metros
> Poverty rate: 8.2% — 30th lowest of 384 metros
[in-text-ad-2]

41. Bellingham, WA
> Life expectancy at birth (years): 81.3
> Adults reporting poor or fair health: 15.0% — 56th lowest of 384 metros
> Adult obesity rate: 28.0% — 74th lowest of 384 metros
> Smoking rate: 13.8% — 25th lowest of 384 metros
> Population without health insurance: 6.8% — 139th lowest of 384 metros
> Median household income: $69,372 — 78th highest of 384 metros
> Poverty rate: 12.9% — 187th highest of 384 metros

40. Boston-Cambridge-Newton, MA-NH
> Life expectancy at birth (years): 81.4
> Adults reporting poor or fair health: 13.3% — 22nd lowest of 384 metros
> Adult obesity rate: 23.9% — 22nd lowest of 384 metros
> Smoking rate: 14.2% — 28th lowest of 384 metros
> Population without health insurance: 3.2% — 7th lowest of 384 metros
> Median household income: $94,430 — 5th highest of 384 metros
> Poverty rate: 8.6% — 33rd lowest of 384 metros
[in-text-ad]

39. Wenatchee, WA
> Life expectancy at birth (years): 81.4
> Adults reporting poor or fair health: 18.8% — 180th highest of 384 metros
> Adult obesity rate: 32.2% — 181st highest of 384 metros
> Smoking rate: 15.0% — 43rd lowest of 384 metros
> Population without health insurance: 11.0% — 102nd highest of 384 metros
> Median household income: $60,532 — 176th highest of 384 metros
> Poverty rate: 13.0% — 183rd highest of 384 metros
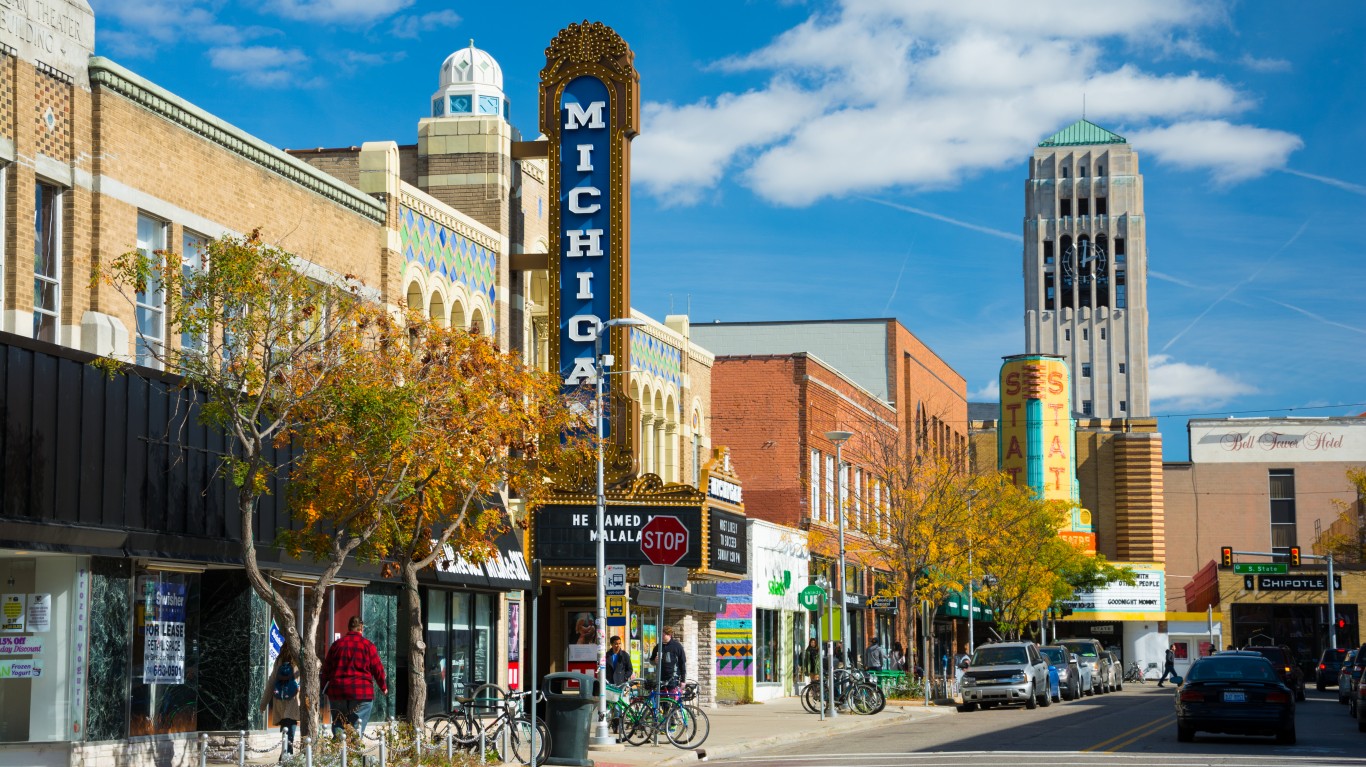
38. Ann Arbor, MI
> Life expectancy at birth (years): 81.4
> Adults reporting poor or fair health: 14.4% — 43rd lowest of 384 metros
> Adult obesity rate: 25.5% — 38th lowest of 384 metros
> Smoking rate: 14.8% — 38th lowest of 384 metros
> Population without health insurance: 3.7% — 15th lowest of 384 metros
> Median household income: $76,576 — 42nd highest of 384 metros
> Poverty rate: 13.4% — 170th highest of 384 metros
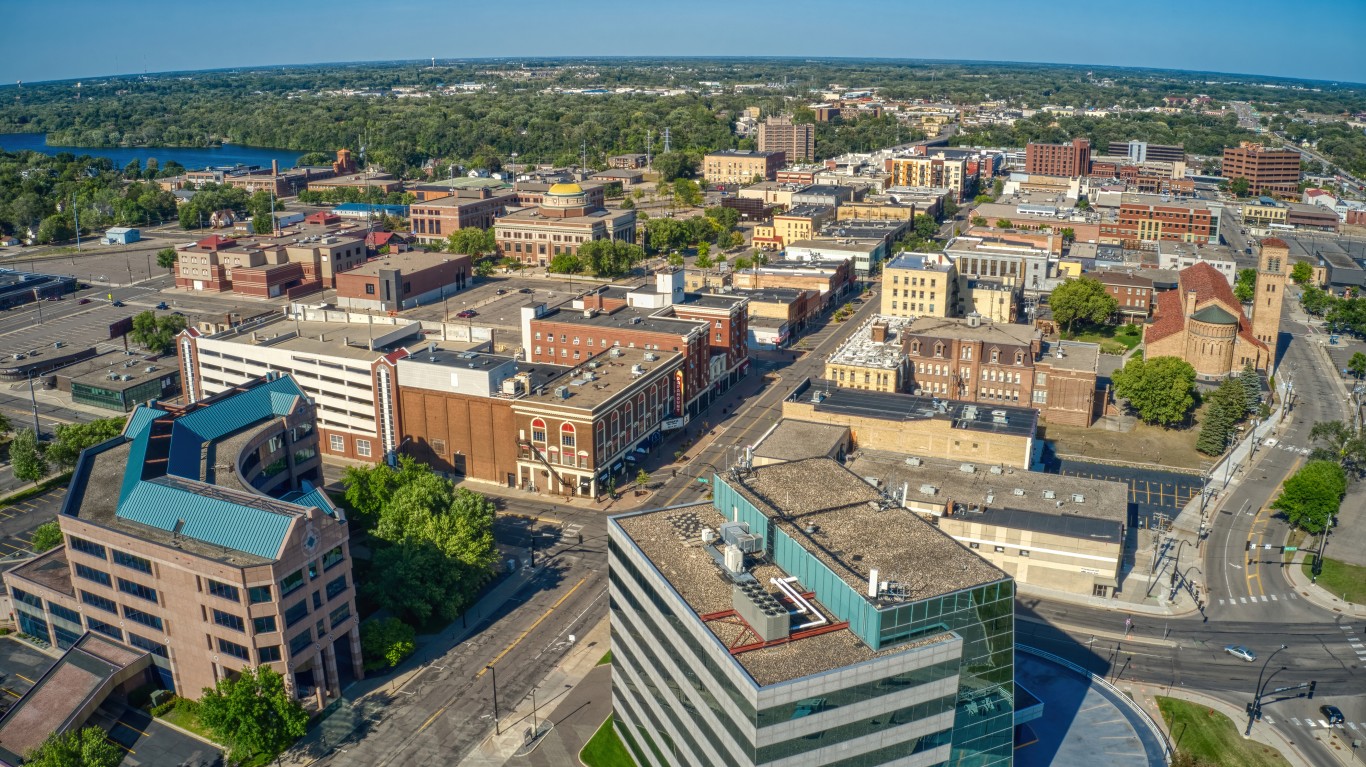
37. St. Cloud, MN
> Life expectancy at birth (years): 81.5
> Adults reporting poor or fair health: 13.6% — 26th lowest of 384 metros
> Adult obesity rate: 30.0% — 124th lowest of 384 metros
> Smoking rate: 18.9% — 188th lowest of 384 metros
> Population without health insurance: 5.4% — 72nd lowest of 384 metros
> Median household income: $66,076 — 101st highest of 384 metros
> Poverty rate: 11.3% — 124th lowest of 384 metros
[in-text-ad-2]

36. Madison, WI
> Life expectancy at birth (years): 81.5
> Adults reporting poor or fair health: 12.5% — 9th lowest of 384 metros
> Adult obesity rate: 25.9% — 44th lowest of 384 metros
> Smoking rate: 15.1% — 47th lowest of 384 metros
> Population without health insurance: 3.7% — 19th lowest of 384 metros
> Median household income: $75,545 — 49th highest of 384 metros
> Poverty rate: 8.9% — 44th lowest of 384 metros

35. Santa Fe, NM
> Life expectancy at birth (years): 81.5
> Adults reporting poor or fair health: 17.8% — 165th lowest of 384 metros
> Adult obesity rate: 16.1% — 2nd lowest of 384 metros
> Smoking rate: 14.2% — 30th lowest of 384 metros
> Population without health insurance: 12.0% — 77th highest of 384 metros
> Median household income: $61,298 — 155th highest of 384 metros
> Poverty rate: 13.0% — 184th highest of 384 metros
[in-text-ad]
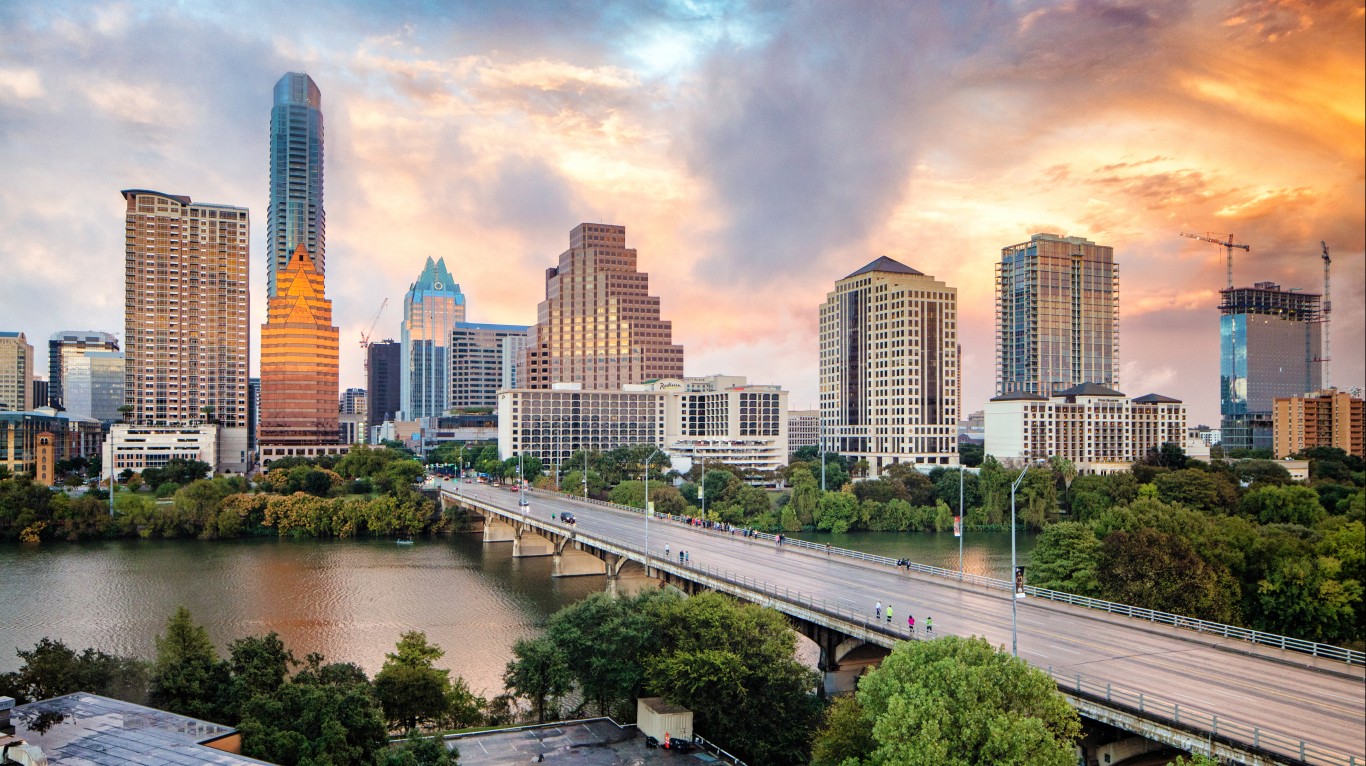
34. Austin-Round Rock-Georgetown, TX
> Life expectancy at birth (years): 81.6
> Adults reporting poor or fair health: 16.3% — 100th lowest of 384 metros
> Adult obesity rate: 26.9% — 56th lowest of 384 metros
> Smoking rate: 13.0% — 17th lowest of 384 metros
> Population without health insurance: 13.6% — 40th highest of 384 metros
> Median household income: $80,954 — 24th highest of 384 metros
> Poverty rate: 10.1% — 78th lowest of 384 metros

33. Bend, OR
> Life expectancy at birth (years): 81.7
> Adults reporting poor or fair health: 15.1% — 58th lowest of 384 metros
> Adult obesity rate: 25.5% — 37th lowest of 384 metros
> Smoking rate: 16.3% — 81st lowest of 384 metros
> Population without health insurance: 7.0% — 145th lowest of 384 metros
> Median household income: $71,643 — 62nd highest of 384 metros
> Poverty rate: 9.7% — 60th lowest of 384 metros

32. San Luis Obispo-Paso Robles, CA
> Life expectancy at birth (years): 81.7
> Adults reporting poor or fair health: 15.2% — 64th lowest of 384 metros
> Adult obesity rate: 28.6% — 87th lowest of 384 metros
> Smoking rate: 13.6% — 23rd lowest of 384 metros
> Population without health insurance: 5.8% — 96th lowest of 384 metros
> Median household income: $77,265 — 38th highest of 384 metros
> Poverty rate: 11.9% — 152nd lowest of 384 metros
[in-text-ad-2]
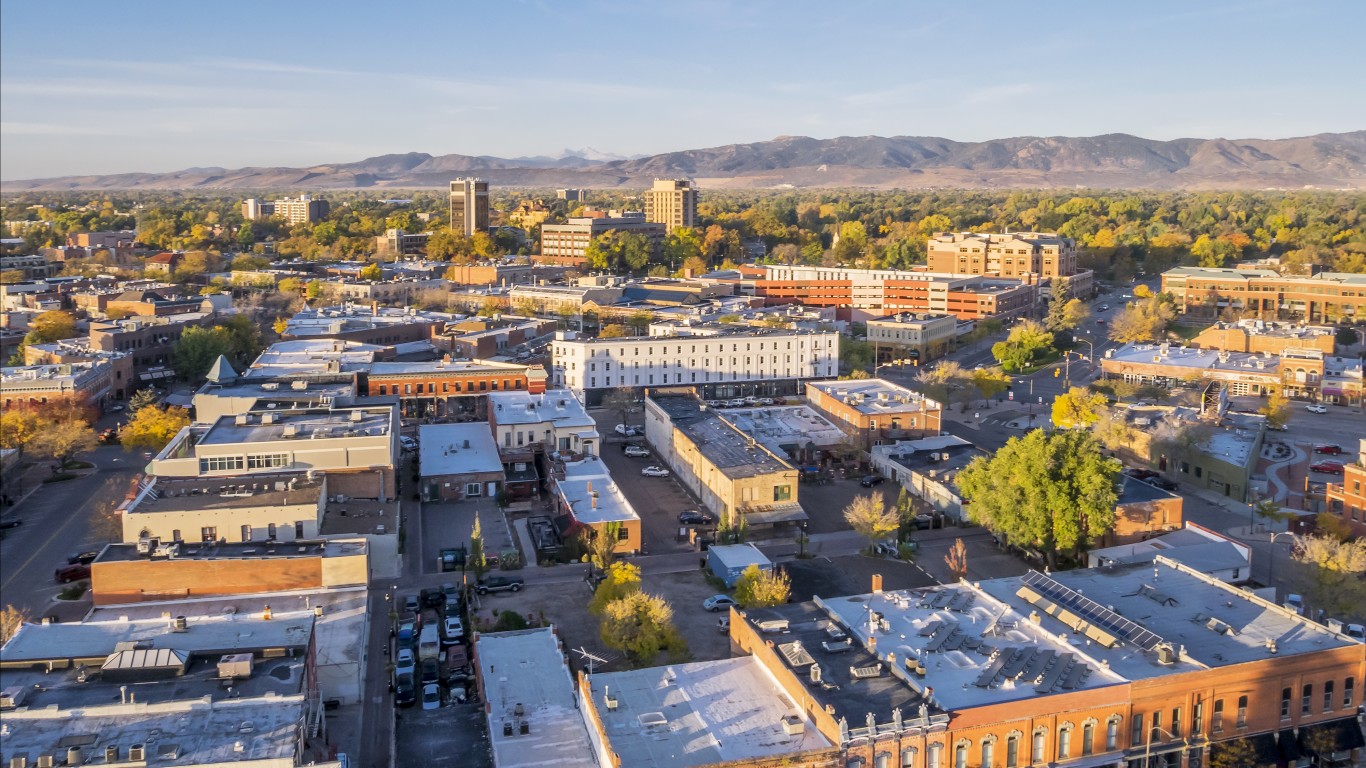
31. Fort Collins, CO
> Life expectancy at birth (years): 81.8
> Adults reporting poor or fair health: 11.2% — 2nd lowest of 384 metros
> Adult obesity rate: 20.9% — 7th lowest of 384 metros
> Smoking rate: 14.5% — 35th lowest of 384 metros
> Population without health insurance: 5.8% — 95th lowest of 384 metros
> Median household income: $75,186 — 51st highest of 384 metros
> Poverty rate: 11.3% — 117th lowest of 384 metros

30. North Port-Sarasota-Bradenton, FL
> Life expectancy at birth (years): 81.9
> Adults reporting poor or fair health: 16.8% — 118th lowest of 384 metros
> Adult obesity rate: 23.7% — 19th lowest of 384 metros
> Smoking rate: 18.8% — 180th lowest of 384 metros
> Population without health insurance: 11.5% — 85th highest of 384 metros
> Median household income: $65,526 — 107th highest of 384 metros
> Poverty rate: 9.2% — 48th lowest of 384 metros
[in-text-ad]

29. McAllen-Edinburg-Mission, TX
> Life expectancy at birth (years): 81.9
> Adults reporting poor or fair health: 33.1% — 3rd highest of 384 metros
> Adult obesity rate: 38.2% — 33rd highest of 384 metros
> Smoking rate: 15.3% — 50th lowest of 384 metros
> Population without health insurance: 32.2% — the highest of 384 metros
> Median household income: $41,800 — 6th lowest of 384 metros
> Poverty rate: 27.3% — the highest of 384 metros

28. El Centro, CA
> Life expectancy at birth (years): 81.9
> Adults reporting poor or fair health: 29.4% — 4th highest of 384 metros
> Adult obesity rate: 32.8% — 164th highest of 384 metros
> Smoking rate: 15.7% — 60th lowest of 384 metros
> Population without health insurance: 8.3% — 180th highest of 384 metros
> Median household income: $48,472 — 35th lowest of 384 metros
> Poverty rate: 25.1% — 5th highest of 384 metros
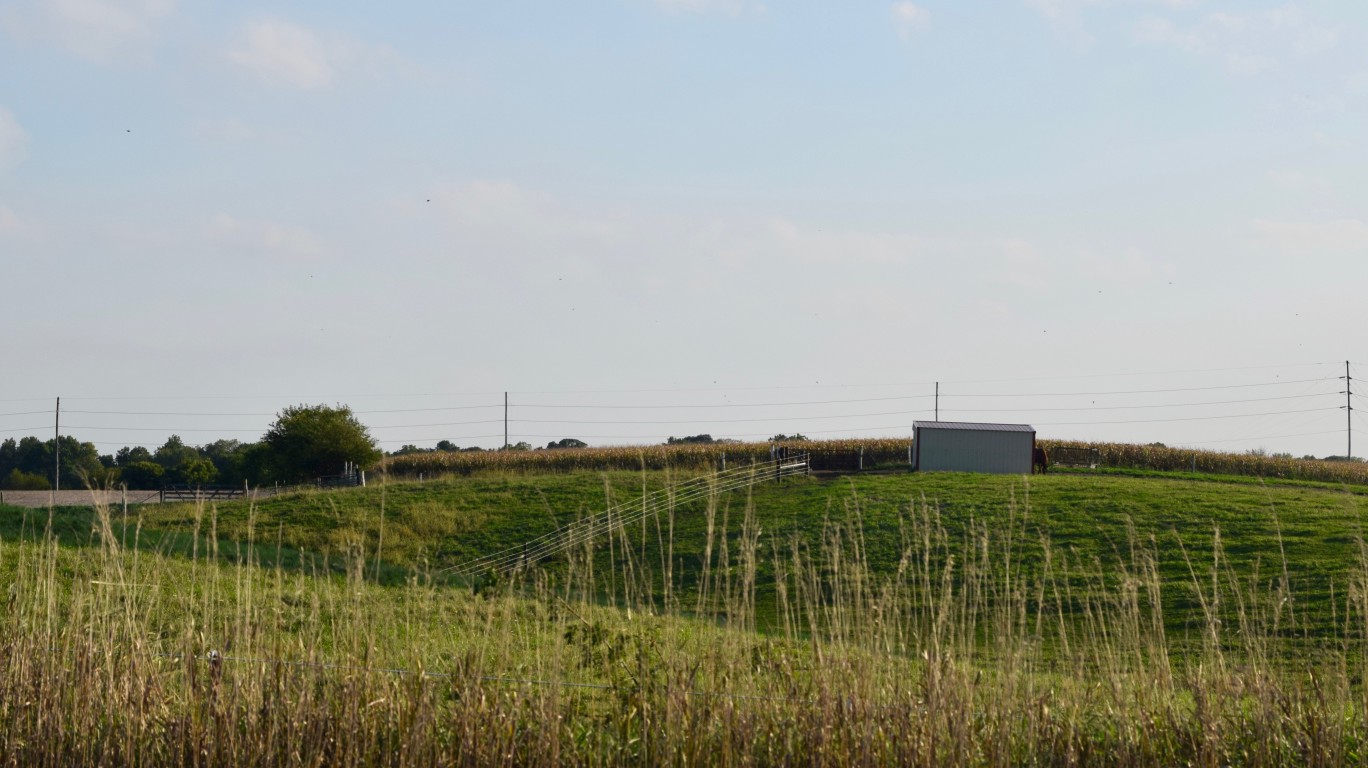
27. Ames, IA
> Life expectancy at birth (years): 81.9
> Adults reporting poor or fair health: 12.8% — 13th lowest of 384 metros
> Adult obesity rate: 28.9% — 97th lowest of 384 metros
> Smoking rate: 15.7% — 61st lowest of 384 metros
> Population without health insurance: 6.2% — 112th lowest of 384 metros
> Median household income: $62,181 — 143rd highest of 384 metros
> Poverty rate: 15.6% — 102nd highest of 384 metros
[in-text-ad-2]

26. St. George, UT
> Life expectancy at birth (years): 82.0
> Adults reporting poor or fair health: 15.9% — 83rd lowest of 384 metros
> Adult obesity rate: 24.0% — 23rd lowest of 384 metros
> Smoking rate: 10.9% — 4th lowest of 384 metros
> Population without health insurance: 14.4% — 29th highest of 384 metros
> Median household income: $63,595 — 121st highest of 384 metros
> Poverty rate: 9.8% — 63rd lowest of 384 metros

25. Napa, CA
> Life expectancy at birth (years): 82.0
> Adults reporting poor or fair health: 15.9% — 85th lowest of 384 metros
> Adult obesity rate: 24.1% — 25th lowest of 384 metros
> Smoking rate: 12.3% — 11th lowest of 384 metros
> Population without health insurance: 6.6% — 129th lowest of 384 metros
> Median household income: $92,769 — 7th highest of 384 metros
> Poverty rate: 6.8% — 8th lowest of 384 metros
[in-text-ad]
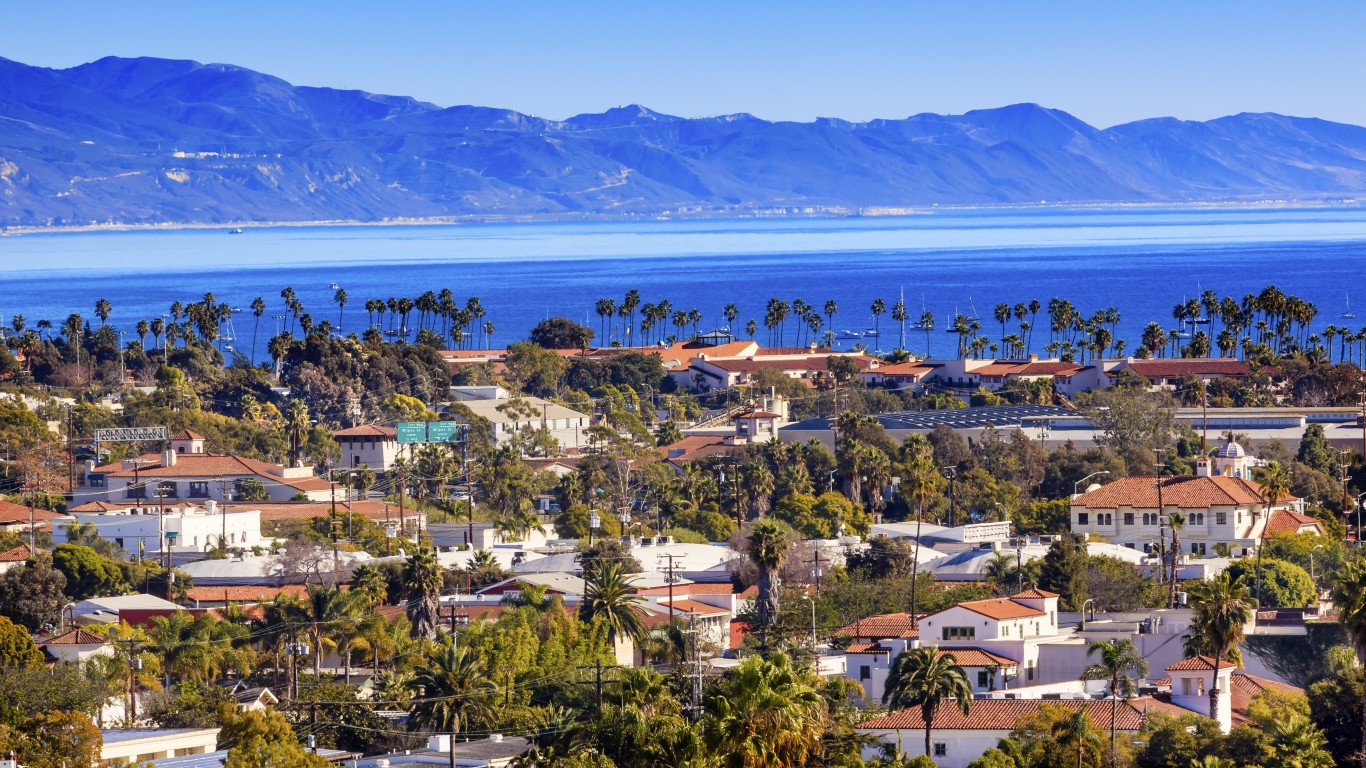
24. Santa Maria-Santa Barbara, CA
> Life expectancy at birth (years): 82.0
> Adults reporting poor or fair health: 19.3% — 159th highest of 384 metros
> Adult obesity rate: 24.2% — 26th lowest of 384 metros
> Smoking rate: 13.4% — 20th lowest of 384 metros
> Population without health insurance: 10.8% — 112th highest of 384 metros
> Median household income: $75,653 — 47th highest of 384 metros
> Poverty rate: 12.0% — 155th lowest of 384 metros

23. Miami-Fort Lauderdale-Pompano Beach, FL
> Life expectancy at birth (years): 82.2
> Adults reporting poor or fair health: 21.7% — 72nd highest of 384 metros
> Adult obesity rate: 23.0% — 18th lowest of 384 metros
> Smoking rate: 16.4% — 86th lowest of 384 metros
> Population without health insurance: 15.4% — 21st highest of 384 metros
> Median household income: $60,141 — 185th highest of 384 metros
> Poverty rate: 13.5% — 165th highest of 384 metros

22. Santa Rosa-Petaluma, CA
> Life expectancy at birth (years): 82.2
> Adults reporting poor or fair health: 15.1% — 60th lowest of 384 metros
> Adult obesity rate: 23.9% — 21st lowest of 384 metros
> Smoking rate: 12.9% — 16th lowest of 384 metros
> Population without health insurance: 5.8% — 98th lowest of 384 metros
> Median household income: $87,828 — 12th highest of 384 metros
> Poverty rate: 6.8% — 9th lowest of 384 metros
[in-text-ad-2]
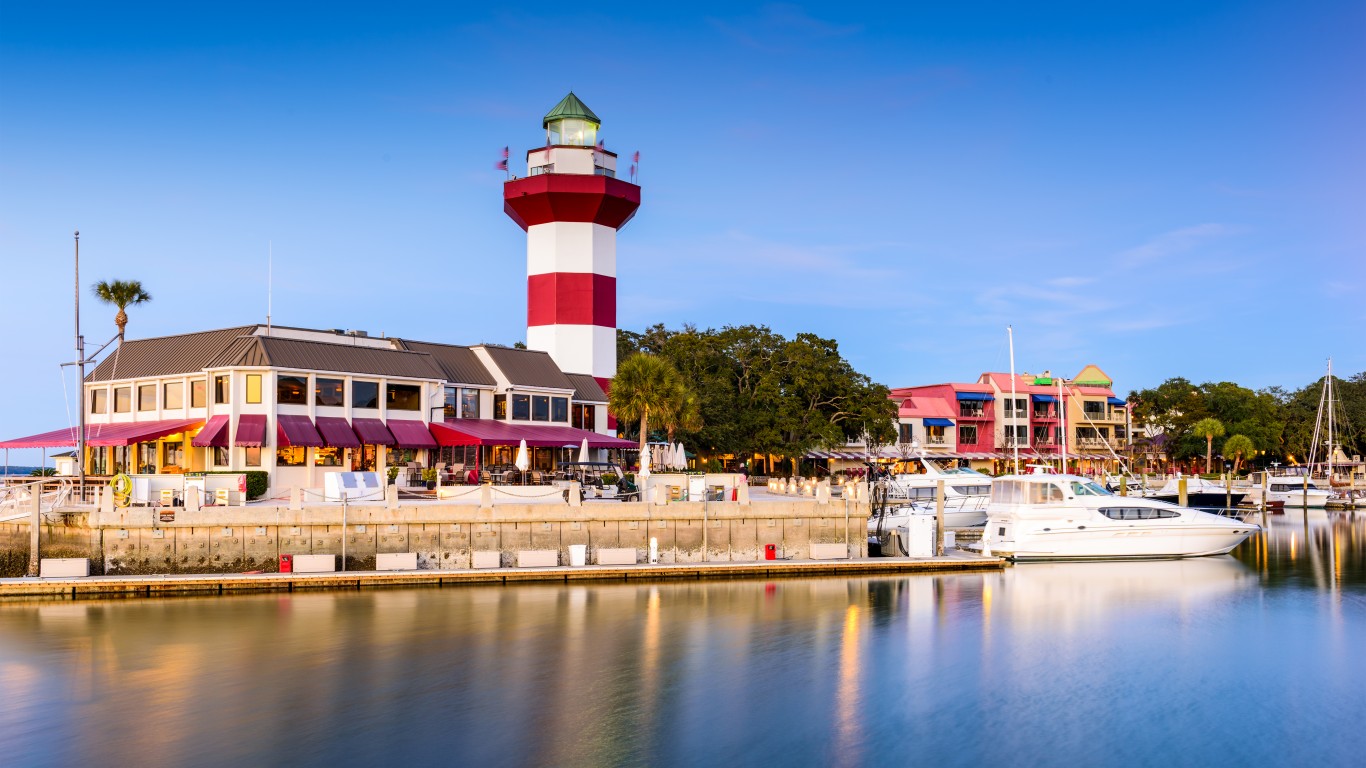
21. Hilton Head Island-Bluffton, SC
> Life expectancy at birth (years): 82.2
> Adults reporting poor or fair health: 15.7% — 79th lowest of 384 metros
> Adult obesity rate: 26.6% — 49th lowest of 384 metros
> Smoking rate: 17.3% — 115th lowest of 384 metros
> Population without health insurance: 10.2% — 128th highest of 384 metros
> Median household income: $71,252 — 63rd highest of 384 metros
> Poverty rate: 10.8% — 99th lowest of 384 metros

20. San Diego-Chula Vista-Carlsbad, CA
> Life expectancy at birth (years): 82.2
> Adults reporting poor or fair health: 15.8% — 81st lowest of 384 metros
> Adult obesity rate: 20.3% — 5th lowest of 384 metros
> Smoking rate: 13.2% — 19th lowest of 384 metros
> Population without health insurance: 8.0% — 192nd lowest of 384 metros
> Median household income: $83,985 — 18th highest of 384 metros
> Poverty rate: 10.3% — 81st lowest of 384 metros
[in-text-ad]

19. Rochester, MN
> Life expectancy at birth (years): 82.3
> Adults reporting poor or fair health: 11.9% — 4th lowest of 384 metros
> Adult obesity rate: 29.9% — 114th lowest of 384 metros
> Smoking rate: 16.1% — 74th lowest of 384 metros
> Population without health insurance: 5.5% — 75th lowest of 384 metros
> Median household income: $75,926 — 45th highest of 384 metros
> Poverty rate: 6.9% — 10th lowest of 384 metros

18. Washington-Arlington-Alexandria, DC-VA-MD-WV
> Life expectancy at birth (years): 82.4
> Adults reporting poor or fair health: 14.1% — 38th lowest of 384 metros
> Adult obesity rate: 27.0% — 59th lowest of 384 metros
> Smoking rate: 12.7% — 13th lowest of 384 metros
> Population without health insurance: 7.5% — 172nd lowest of 384 metros
> Median household income: $105,659 — 3rd highest of 384 metros
> Poverty rate: 7.5% — 18th lowest of 384 metros

17. New York-Newark-Jersey City, NY-NJ-PA
> Life expectancy at birth (years): 82.4
> Adults reporting poor or fair health: 17.2% — 139th lowest of 384 metros
> Adult obesity rate: 24.4% — 28th lowest of 384 metros
> Smoking rate: 14.5% — 33rd lowest of 384 metros
> Population without health insurance: 6.9% — 141st lowest of 384 metros
> Median household income: $83,160 — 21st highest of 384 metros (tied)
> Poverty rate: 11.6% — 136th lowest of 384 metros
[in-text-ad-2]

16. Cape Coral-Fort Myers, FL
> Life expectancy at birth (years): 82.5
> Adults reporting poor or fair health: 19.5% — 149th highest of 384 metros
> Adult obesity rate: 25.0% — 34th lowest of 384 metros
> Smoking rate: 19.4% — 179th highest of 384 metros
> Population without health insurance: 12.2% — 72nd highest of 384 metros
> Median household income: $62,240 — 141st highest of 384 metros
> Poverty rate: 11.3% — 120th lowest of 384 metros

15. Urban Honolulu, HI
> Life expectancy at birth (years): 82.5
> Adults reporting poor or fair health: 17.0% — 133rd lowest of 384 metros
> Adult obesity rate: 24.4% — 29th lowest of 384 metros
> Smoking rate: 14.9% — 39th lowest of 384 metros
> Population without health insurance: 3.6% — 13th lowest of 384 metros
> Median household income: $87,470 — 13th highest of 384 metros
> Poverty rate: 8.1% — 28th lowest of 384 metros
[in-text-ad]

14. Oxnard-Thousand Oaks-Ventura, CA
> Life expectancy at birth (years): 82.5
> Adults reporting poor or fair health: 17.6% — 156th lowest of 384 metros
> Adult obesity rate: 20.2% — 4th lowest of 384 metros
> Smoking rate: 12.3% — 12th lowest of 384 metros
> Population without health insurance: 9.4% — 150th highest of 384 metros
> Median household income: $92,236 — 8th highest of 384 metros
> Poverty rate: 7.9% — 24th lowest of 384 metros
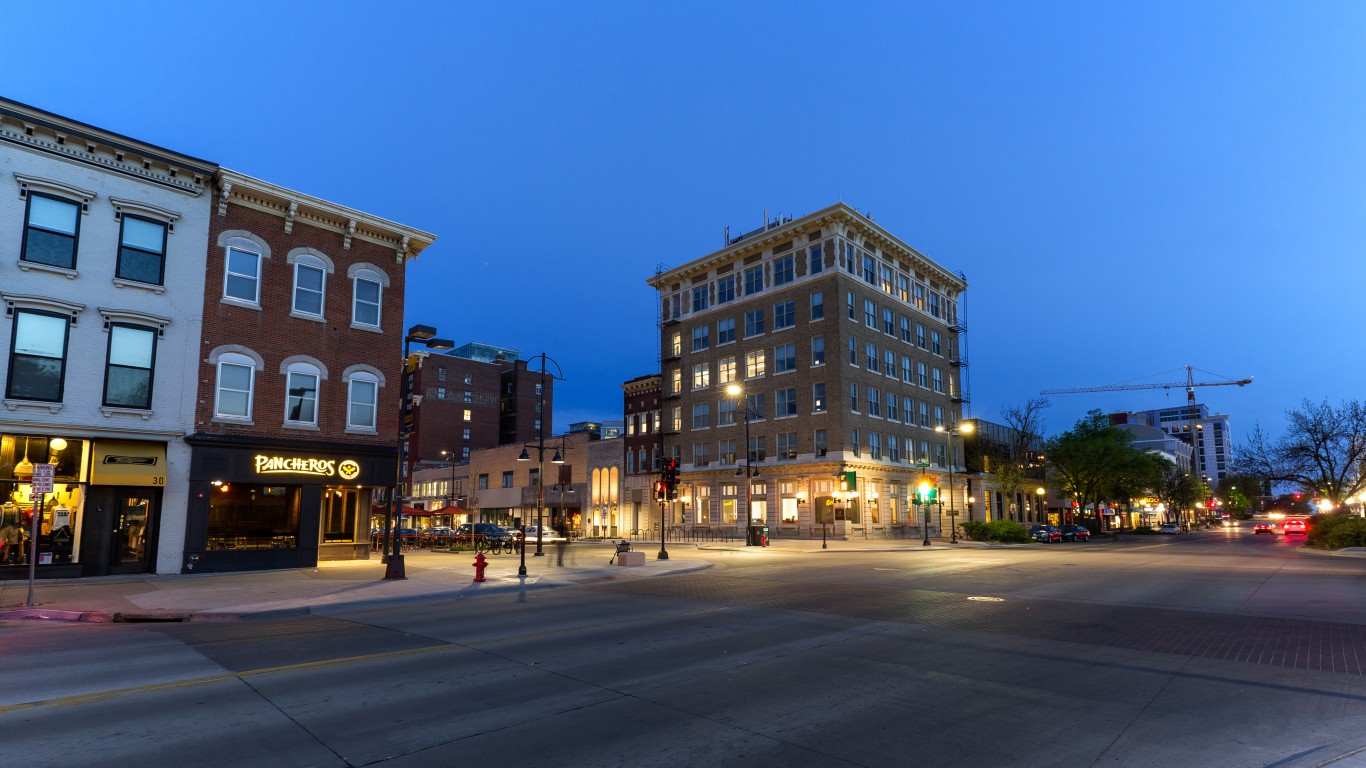
13. Iowa City, IA
> Life expectancy at birth (years): 82.6
> Adults reporting poor or fair health: 12.9% — 14th lowest of 384 metros
> Adult obesity rate: 27.7% — 68th lowest of 384 metros
> Smoking rate: 15.1% — 45th lowest of 384 metros
> Population without health insurance: 7.7% — 176th lowest of 384 metros
> Median household income: $63,761 — 119th highest of 384 metros
> Poverty rate: 16.2% — 80th highest of 384 metros

12. Los Angeles-Long Beach-Anaheim, CA
> Life expectancy at birth (years): 82.6
> Adults reporting poor or fair health: 20.2% — 115th highest of 384 metros
> Adult obesity rate: 21.6% — 10th lowest of 384 metros
> Smoking rate: 12.2% — 10th lowest of 384 metros
> Population without health insurance: 9.3% — 152nd highest of 384 metros
> Median household income: $77,774 — 36th highest of 384 metros
> Poverty rate: 12.4% — 176th lowest of 384 metros
[in-text-ad-2]
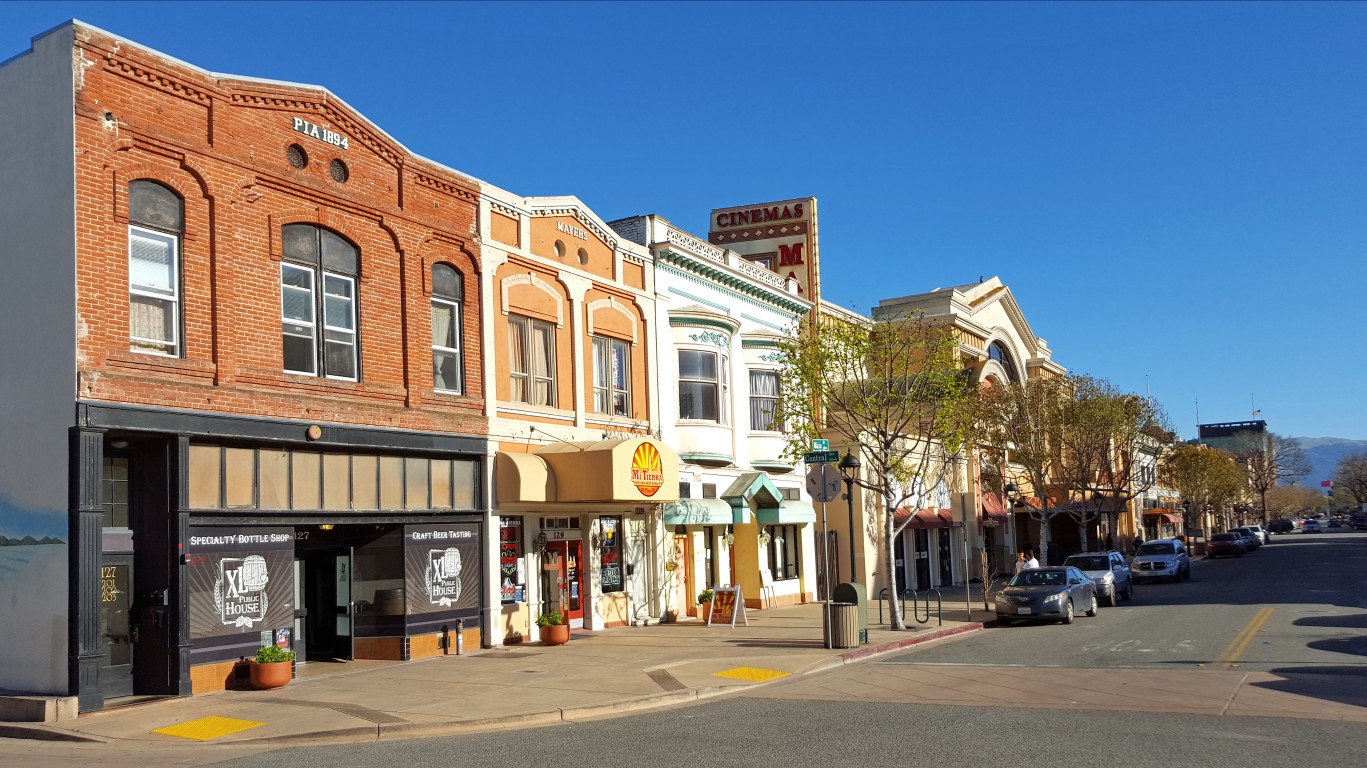
11. Salinas, CA
> Life expectancy at birth (years): 82.7
> Adults reporting poor or fair health: 23.6% — 31st highest of 384 metros
> Adult obesity rate: 24.9% — 32nd lowest of 384 metros
> Smoking rate: 13.8% — 24th lowest of 384 metros
> Population without health insurance: 9.7% — 142nd highest of 384 metros
> Median household income: $77,514 — 37th highest of 384 metros
> Poverty rate: 12.7% — 184th lowest of 384 metros

10. Boulder, CO
> Life expectancy at birth (years): 82.9
> Adults reporting poor or fair health: 11.2% — the lowest of 384 metros
> Adult obesity rate: 14.3% — the lowest of 384 metros
> Smoking rate: 12.8% — 15th lowest of 384 metros
> Population without health insurance: 5.4% — 71st lowest of 384 metros
> Median household income: $88,535 — 10th highest of 384 metros
> Poverty rate: 10.9% — 103rd lowest of 384 metros
[in-text-ad]

9. Santa Cruz-Watsonville, CA
> Life expectancy at birth (years): 82.9
> Adults reporting poor or fair health: 16.3% — 99th lowest of 384 metros
> Adult obesity rate: 19.3% — 3rd lowest of 384 metros
> Smoking rate: 12.8% — 14th lowest of 384 metros
> Population without health insurance: 5.3% — 67th lowest of 384 metros
> Median household income: $89,269 — 9th highest of 384 metros
> Poverty rate: 10.1% — 76th lowest of 384 metros

8. Kahului-Wailuku-Lahaina, HI
> Life expectancy at birth (years): 82.9
> Adults reporting poor or fair health: 14.7% — 49th lowest of 384 metros
> Adult obesity rate: 24.6% — 31st lowest of 384 metros
> Smoking rate: 16.2% — 78th lowest of 384 metros
> Population without health insurance: 6.3% — 119th lowest of 384 metros
> Median household income: $80,754 — 25th highest of 384 metros
> Poverty rate: 11.9% — 148th lowest of 384 metros
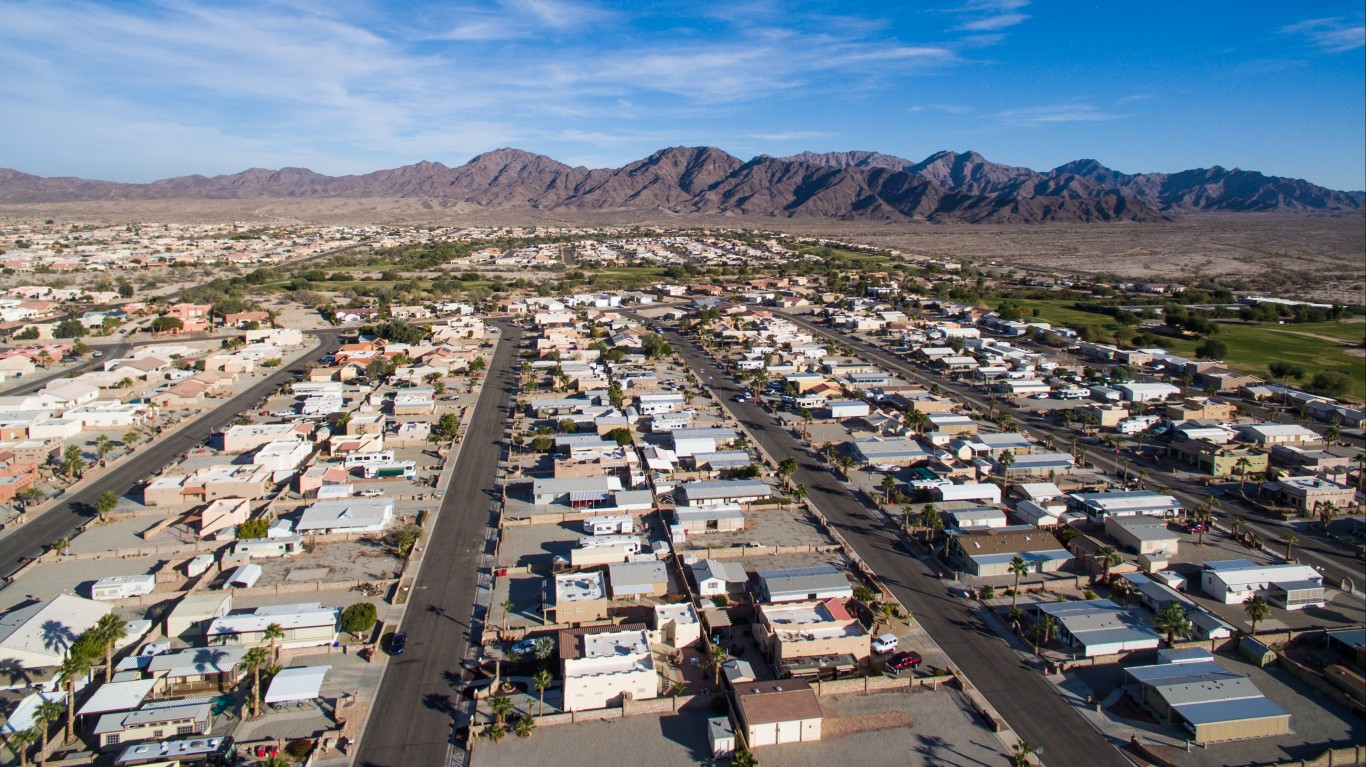
7. Yuma, AZ
> Life expectancy at birth (years): 83.0
> Adults reporting poor or fair health: 26.1% — 11th highest of 384 metros
> Adult obesity rate: 37.9% — 39th highest of 384 metros
> Smoking rate: 16.7% — 96th lowest of 384 metros
> Population without health insurance: 14.0% — 34th highest of 384 metros
> Median household income: $46,419 — 19th lowest of 384 metros
> Poverty rate: 21.4% — 13th highest of 384 metros
[in-text-ad-2]

6. Bridgeport-Stamford-Norwalk, CT
> Life expectancy at birth (years): 83.0
> Adults reporting poor or fair health: 11.9% — 5th lowest of 384 metros
> Adult obesity rate: 21.2% — 8th lowest of 384 metros
> Smoking rate: 11.7% — 8th lowest of 384 metros
> Population without health insurance: 9.1% — 162nd highest of 384 metros
> Median household income: $97,053 — 4th highest of 384 metros
> Poverty rate: 9.1% — 45th lowest of 384 metros

5. Corvallis, OR
> Life expectancy at birth (years): 83.0
> Adults reporting poor or fair health: 16.1% — 93rd lowest of 384 metros
> Adult obesity rate: 21.6% — 11th lowest of 384 metros
> Smoking rate: 14.7% — 36th lowest of 384 metros
> Population without health insurance: 4.7% — 45th lowest of 384 metros
> Median household income: $70,835 — 68th highest of 384 metros
> Poverty rate: 17.9% — 50th highest of 384 metros
[in-text-ad]

4. State College, PA
> Life expectancy at birth (years): 83.0
> Adults reporting poor or fair health: 16.0% — 91st lowest of 384 metros
> Adult obesity rate: 24.0% — 24th lowest of 384 metros
> Smoking rate: 18.5% — 163rd lowest of 384 metros
> Population without health insurance: 8.2% — 183rd highest of 384 metros
> Median household income: $60,706 — 173rd highest of 384 metros (tied)
> Poverty rate: 16.3% — 78th highest of 384 metros

3. San Francisco-Oakland-Berkeley, CA
> Life expectancy at birth (years): 83.6
> Adults reporting poor or fair health: 14.0% — 33rd lowest of 384 metros
> Adult obesity rate: 21.7% — 13th lowest of 384 metros
> Smoking rate: 11.0% — 5th lowest of 384 metros
> Population without health insurance: 4.3% — 34th lowest of 384 metros
> Median household income: $114,696 — 2nd highest of 384 metros
> Poverty rate: 8.2% — 29th lowest of 384 metros

2. San Jose-Sunnyvale-Santa Clara, CA
> Life expectancy at birth (years): 84.8
> Adults reporting poor or fair health: 14.5% — 46th lowest of 384 metros
> Adult obesity rate: 20.4% — 6th lowest of 384 metros
> Smoking rate: 9.7% — 2nd lowest of 384 metros
> Population without health insurance: 4.8% — 49th lowest of 384 metros
> Median household income: $130,865 — the highest of 384 metros
> Poverty rate: 6.3% — 6th lowest of 384 metros
[in-text-ad-2]
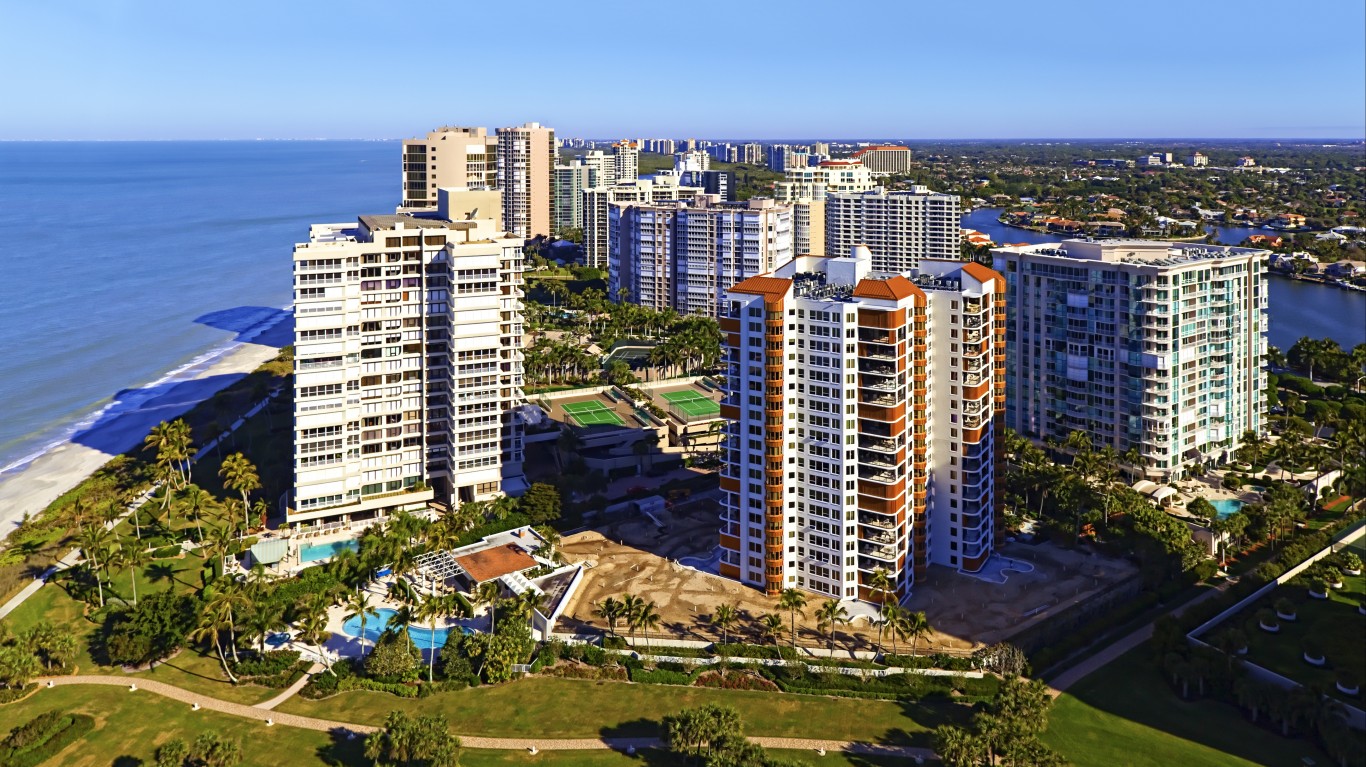
1. Naples-Marco Island, FL
> Life expectancy at birth (years): 86.1
> Adults reporting poor or fair health: 18.3% — 180th lowest of 384 metros
> Adult obesity rate: 21.9% — 14th lowest of 384 metros
> Smoking rate: 16.0% — 71st lowest of 384 metros
> Population without health insurance: 13.1% — 49th highest of 384 metros
> Median household income: $76,025 — 44th highest of 384 metros
> Poverty rate: 9.3% — 51st lowest of 384 metros
Methodology
To determine the metros with the longest life expectancy, 24/7 Tempo reviewed life expectancy — the average number of years a person can expect to live — data from the Robert Wood Johnson Foundation and the University of Wisconsin Population Health Institute joint program’s 2021 County Health Rankings & Roadmaps report. While the CHR report is from 2021, life expectancy data published in the report are from 2017-2019.
We used the 384 metropolitan statistical areas as delineated by the United States Office of Management and Budget and used by the Census Bureau as our definition of metros.
Metros were ranked based on life expectancy. Additional information on the share of adults reporting poor or fair health, the share of adults 20 years and older who report a body mass index of 30 kg/m2 or higher (adult obesity rate), and the share of adults who are current smokers are also from the 2021 CHR. The share of the civilian noninstitutionalized population without health insurance, median household income, and poverty rates are one-year estimates from the U.S. Census Bureau’s 2019 American Community Survey.
100 Million Americans Are Missing This Crucial Retirement Tool
The thought of burdening your family with a financial disaster is most Americans’ nightmare. However, recent studies show that over 100 million Americans still don’t have proper life insurance in the event they pass away.
Life insurance can bring peace of mind – ensuring your loved ones are safeguarded against unforeseen expenses and debts. With premiums often lower than expected and a variety of plans tailored to different life stages and health conditions, securing a policy is more accessible than ever.
A quick, no-obligation quote can provide valuable insight into what’s available and what might best suit your family’s needs. Life insurance is a simple step you can take today to help secure peace of mind for your loved ones tomorrow.
Click here to learn how to get a quote in just a few minutes.
Thank you for reading! Have some feedback for us?
Contact the 24/7 Wall St. editorial team.
 24/7 Wall St.
 24/7 Wall St.
 24/7 Wall St.
 24/7 Wall St.

