
Recent public health crises, namely the COVID-19 pandemic and the opioid epidemic, have overshadowed a longer-standing problem in the United States — obesity. Since the early 1960s, the share of American adults under age 75 who are considered obese more than tripled. Currently, an estimated 72.2 million Americans age 20 and up are obese, or 29.7% of the age group.
Obesity status is determined by body mass index, or BMI — a ratio of height to body weight. Americans with a BMI of 30 or higher are considered obese. Obesity increases the risk of diabetes, stroke, hypertension, heart disease, breathing problems, certain cancers, and mortality, according to the Centers for Disease Control and Prevention. Obesity can also detract from overall quality of life and contribute to depression, anxiety, and other mental illnesses.
While the U.S. has one of the highest obesity rates in the world, there are parts of the country where obesity remains relatively uncommon. Using data from County Health Rankings & Roadmaps, 24/7 Tempo identified the least obese metropolitan area in each state. Four states — Delaware, New Hampshire, Rhode Island, and Vermont — have only one metro area. As a result, these areas rank as the least obese in the state by default only.
It is important to note that in some states, the metro area with the lowest obesity rate still has a higher obesity rate than the state as a whole. Additionally, in over a dozen states — nearly all of which have higher than average obesity rates — the least obese metro area still has a higher obesity rate than the U.S. as a whole.
Though many factors, including genetics, diet, and medical conditions, contribute to increased risk of obesity, regular physical activity is one of the best ways to help maintain a healthy weight. Adults residing in most metro areas on this list are more likely to exercise regularly than the typical adult across the state as a whole. Here is a look at the most physically active cities in America.
Click here to see the least obese metro in every state
Click here to see our detailed methodology

Alabama: Daphne-Fairhope-Foley
> Adult obesity rate: 30.0% (Alabama: 36.1%)
> Adults who don’t exercise: 24.7% (Alabama: 29.3%)
> Adults with diabetes: 10.3% (Alabama: 14.5%)
> Adults reporting poor or fair health: 16.5% (Alabama: 21.4%)
[in-text-ad]

Alaska: Fairbanks
> Adult obesity rate: 31.0% (Alaska: 31.9%)
> Adults who don’t exercise: 18.2% (Alaska: 19.3%)
> Adults with diabetes: 7.1% (Alaska: 8.3%)
> Adults reporting poor or fair health: 14.0% (Alaska: 15.6%)

Arizona: Prescott Valley-Prescott
> Adult obesity rate: 24.3% (Arizona: 27.9%)
> Adults who don’t exercise: 22.5% (Arizona: 21.2%)
> Adults with diabetes: 10.9% (Arizona: 9.6%)
> Adults reporting poor or fair health: 16.7% (Arizona: 18.6%)

Arkansas: Hot Springs
> Adult obesity rate: 28.8% (Arkansas: 35.0%)
> Adults who don’t exercise: 29.1% (Arkansas: 30.4%)
> Adults with diabetes: 15.9% (Arkansas: 13.5%)
> Adults reporting poor or fair health: 22.7% (Arkansas: 23.3%)
[in-text-ad-2]

California: Santa Cruz-Watsonville
> Adult obesity rate: 19.3% (California: 24.3%)
> Adults who don’t exercise: 11.1% (California: 17.7%)
> Adults with diabetes: 6.2% (California: 8.8%)
> Adults reporting poor or fair health: 16.3% (California: 17.6%)

Colorado: Boulder
> Adult obesity rate: 14.3% (Colorado: 22.4%)
> Adults who don’t exercise: 8.9% (Colorado: 14.8%)
> Adults with diabetes: 5.5% (Colorado: 6.6%)
> Adults reporting poor or fair health: 11.2% (Colorado: 13.8%)
[in-text-ad]

Connecticut: Bridgeport-Stamford-Norwalk
> Adult obesity rate: 21.2% (Connecticut: 26.3%)
> Adults who don’t exercise: 17.3% (Connecticut: 19.9%)
> Adults with diabetes: 7.3% (Connecticut: 9.2%)
> Adults reporting poor or fair health: 11.9% (Connecticut: 13.0%)

Delaware: Dover*
> Adult obesity rate: 38.4% (Delaware: 32.4%)
> Adults who don’t exercise: 30.9% (Delaware: 27.3%)
> Adults with diabetes: 13.9% (Delaware: 11.8%)
> Adults reporting poor or fair health: 21.0% (Delaware: 16.3%)
*Because Dover is the only eligible metro in Delaware, it is the least obese metro by default.

Florida: Naples-Marco Island
> Adult obesity rate: 21.9% (Florida: 27.2%)
> Adults who don’t exercise: 22.9% (Florida: 25.8%)
> Adults with diabetes: 9.1% (Florida: 10.8%)
> Adults reporting poor or fair health: 18.3% (Florida: 19.5%)
[in-text-ad-2]
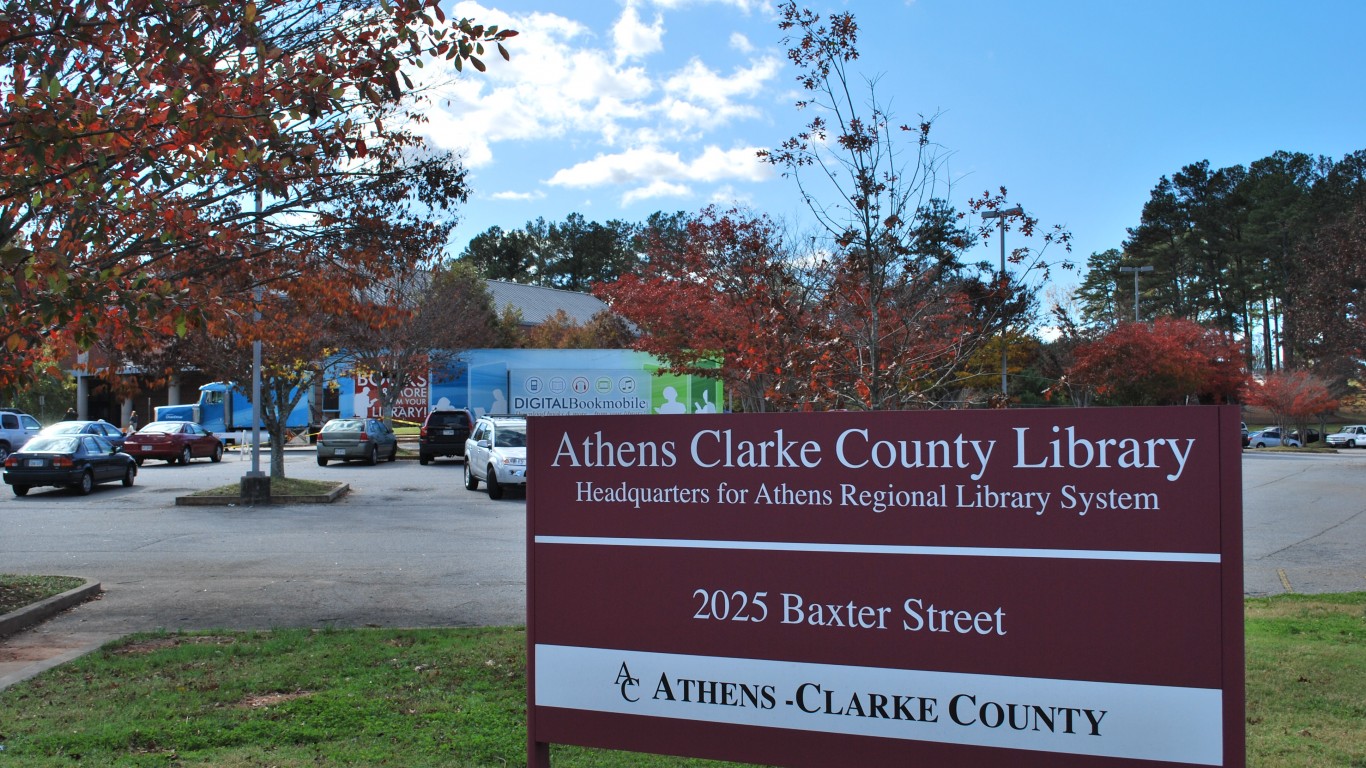
Georgia: Athens-Clarke County
> Adult obesity rate: 25.8% (Georgia: 32.3%)
> Adults who don’t exercise: 24.5% (Georgia: 26.4%)
> Adults with diabetes: 9.2% (Georgia: 12.0%)
> Adults reporting poor or fair health: 19.6% (Georgia: 18.4%)

Hawaii: Urban Honolulu
> Adult obesity rate: 24.4% (Hawaii: 24.6%)
> Adults who don’t exercise: 20.0% (Hawaii: 19.6%)
> Adults with diabetes: 11.3% (Hawaii: 11.1%)
> Adults reporting poor or fair health: 17.0% (Hawaii: 15.4%)
[in-text-ad]

Idaho: Coeur d’Alene
> Adult obesity rate: 26.1% (Idaho: 29.0%)
> Adults who don’t exercise: 19.2% (Idaho: 20.4%)
> Adults with diabetes: 9.1% (Idaho: 9.3%)
> Adults reporting poor or fair health: 15.9% (Idaho: 15.1%)
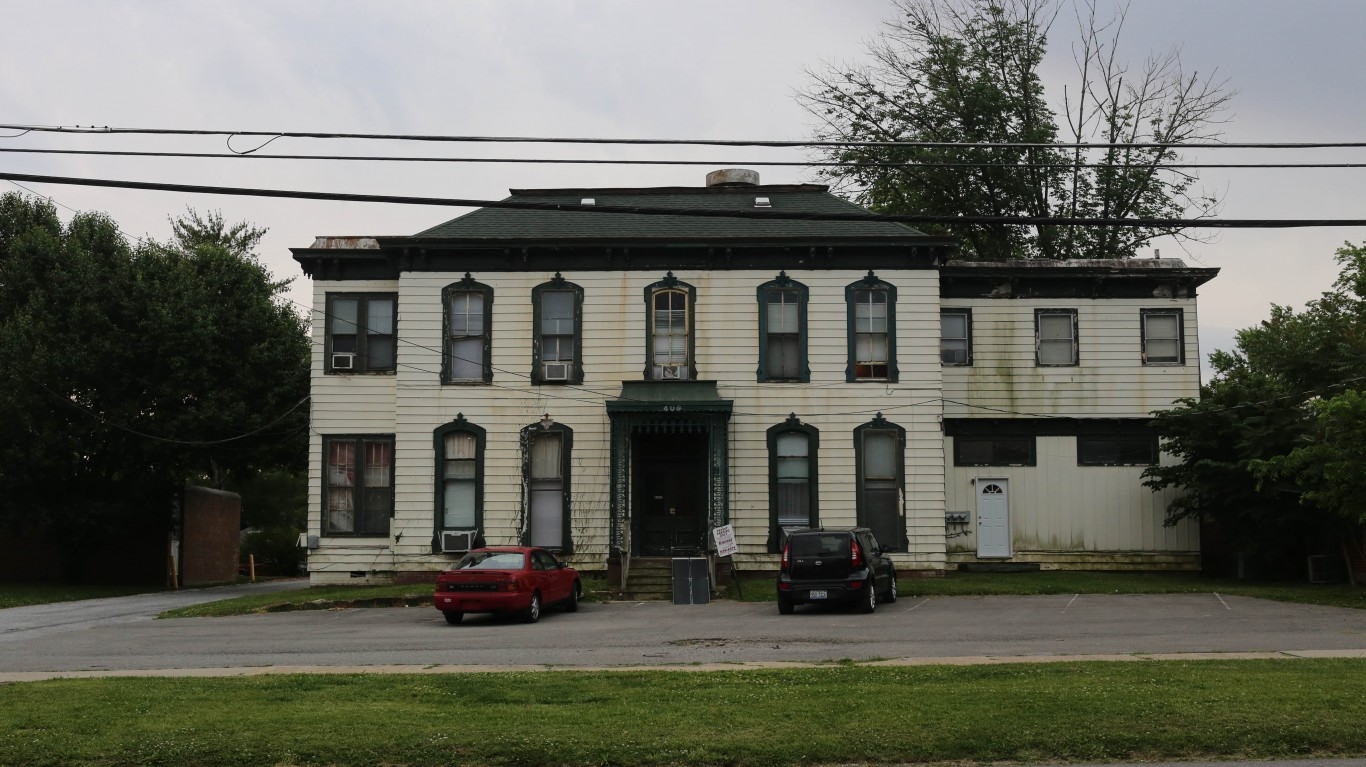
Illinois: Carbondale-Marion
> Adult obesity rate: 27.0% (Illinois: 29.7%)
> Adults who don’t exercise: 23.8% (Illinois: 21.6%)
> Adults with diabetes: 11.0% (Illinois: 9.9%)
> Adults reporting poor or fair health: 18.2% (Illinois: 15.9%)

Indiana: Bloomington
> Adult obesity rate: 26.1% (Indiana: 33.9%)
> Adults who don’t exercise: 21.3% (Indiana: 26.7%)
> Adults with diabetes: 8.5% (Indiana: 12.1%)
> Adults reporting poor or fair health: 17.8% (Indiana: 18.2%)
[in-text-ad-2]
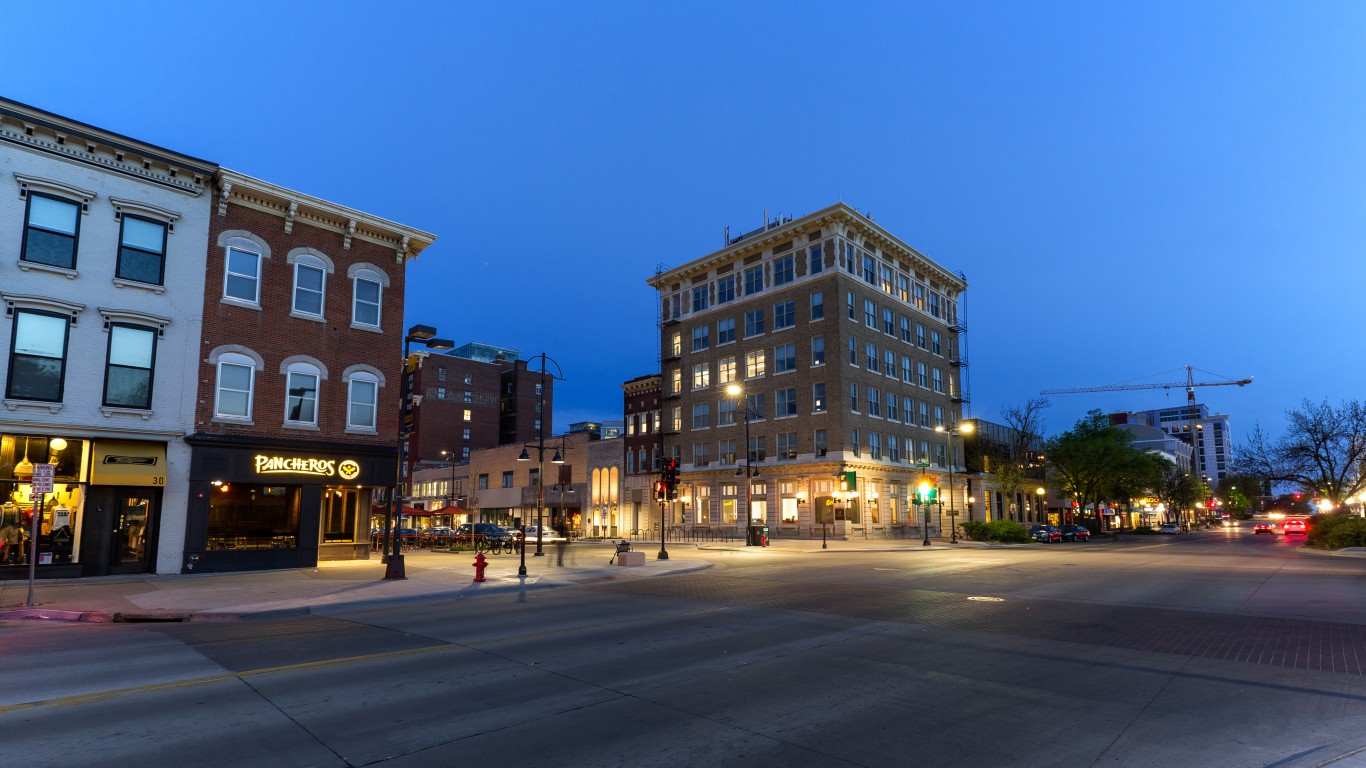
Iowa: Iowa City
> Adult obesity rate: 27.7% (Iowa: 34.3%)
> Adults who don’t exercise: 17.4% (Iowa: 22.6%)
> Adults with diabetes: 7.0% (Iowa: 9.9%)
> Adults reporting poor or fair health: 12.9% (Iowa: 13.5%)
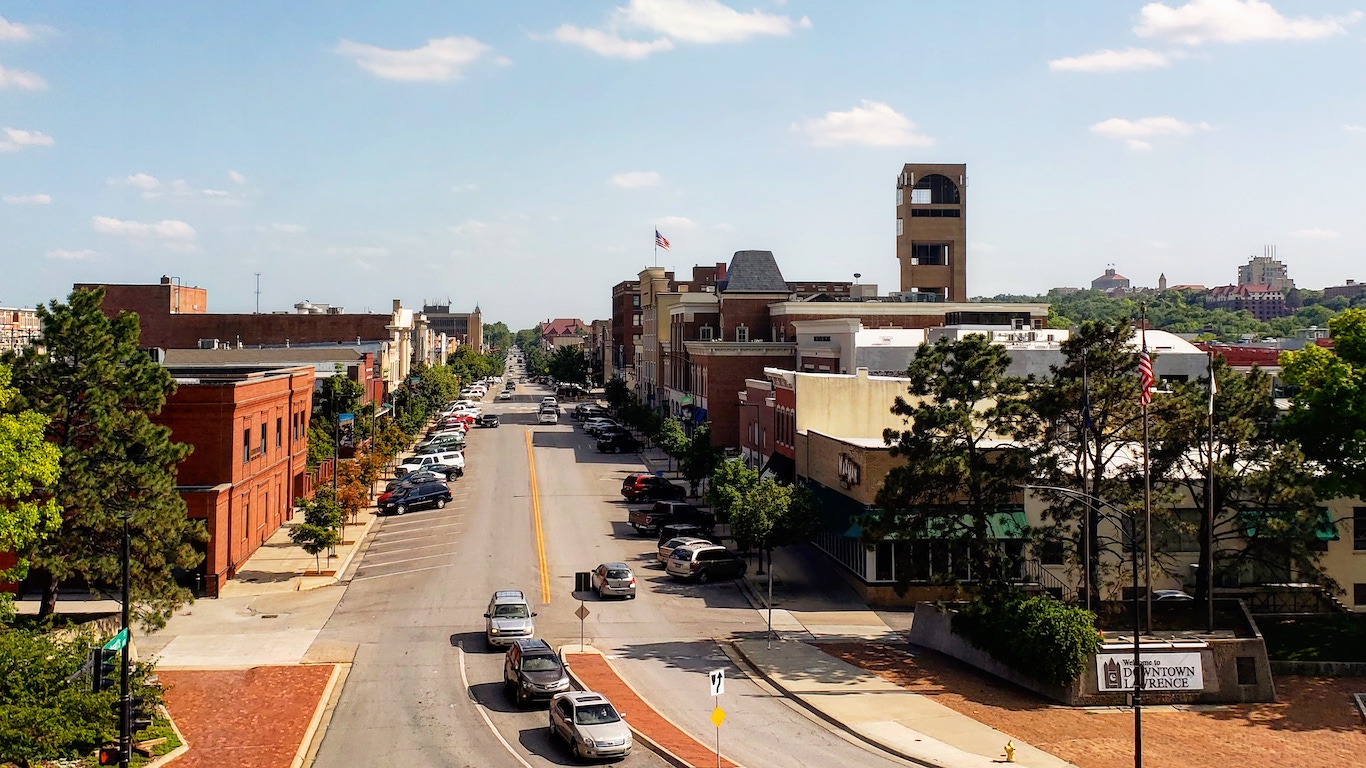
Kansas: Lawrence
> Adult obesity rate: 28.0% (Kansas: 33.0%)
> Adults who don’t exercise: 16.3% (Kansas: 23.9%)
> Adults with diabetes: 7.0% (Kansas: 10.5%)
> Adults reporting poor or fair health: 14.8% (Kansas: 16.3%)
[in-text-ad]
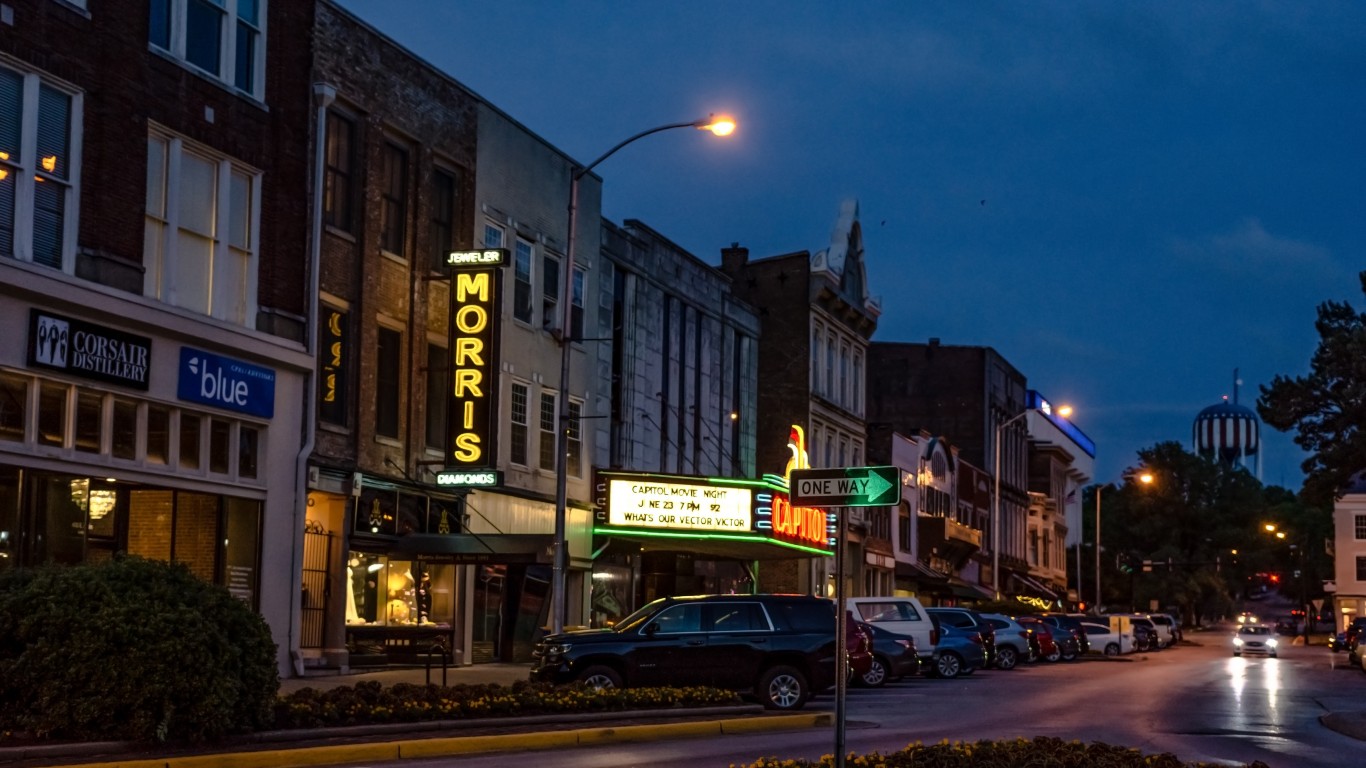
Kentucky: Bowling Green
> Adult obesity rate: 30.2% (Kentucky: 34.6%)
> Adults who don’t exercise: 26.7% (Kentucky: 28.7%)
> Adults with diabetes: 9.3% (Kentucky: 12.7%)
> Adults reporting poor or fair health: 22.9% (Kentucky: 21.8%)

Louisiana: New Orleans-Metairie
> Adult obesity rate: 33.0% (Louisiana: 36.3%)
> Adults who don’t exercise: 24.0% (Louisiana: 28.0%)
> Adults with diabetes: 12.5% (Louisiana: 13.0%)
> Adults reporting poor or fair health: 20.6% (Louisiana: 21.4%)

Maine: Portland-South Portland
> Adult obesity rate: 25.9% (Maine: 29.8%)
> Adults who don’t exercise: 17.4% (Maine: 20.8%)
> Adults with diabetes: 8.9% (Maine: 10.4%)
> Adults reporting poor or fair health: 13.2% (Maine: 17.1%)
[in-text-ad-2]

Maryland: Baltimore-Columbia-Towson
> Adult obesity rate: 31.5% (Maryland: 31.6%)
> Adults who don’t exercise: 22.4% (Maryland: 21.9%)
> Adults with diabetes: 10.9% (Maryland: 11.1%)
> Adults reporting poor or fair health: 16.1% (Maryland: 15.2%)

Massachusetts: Barnstable Town
> Adult obesity rate: 22.5% (Massachusetts: 25.0%)
> Adults who don’t exercise: 17.2% (Massachusetts: 20.0%)
> Adults with diabetes: 10.1% (Massachusetts: 8.7%)
> Adults reporting poor or fair health: 12.7% (Massachusetts: 13.5%)
[in-text-ad]
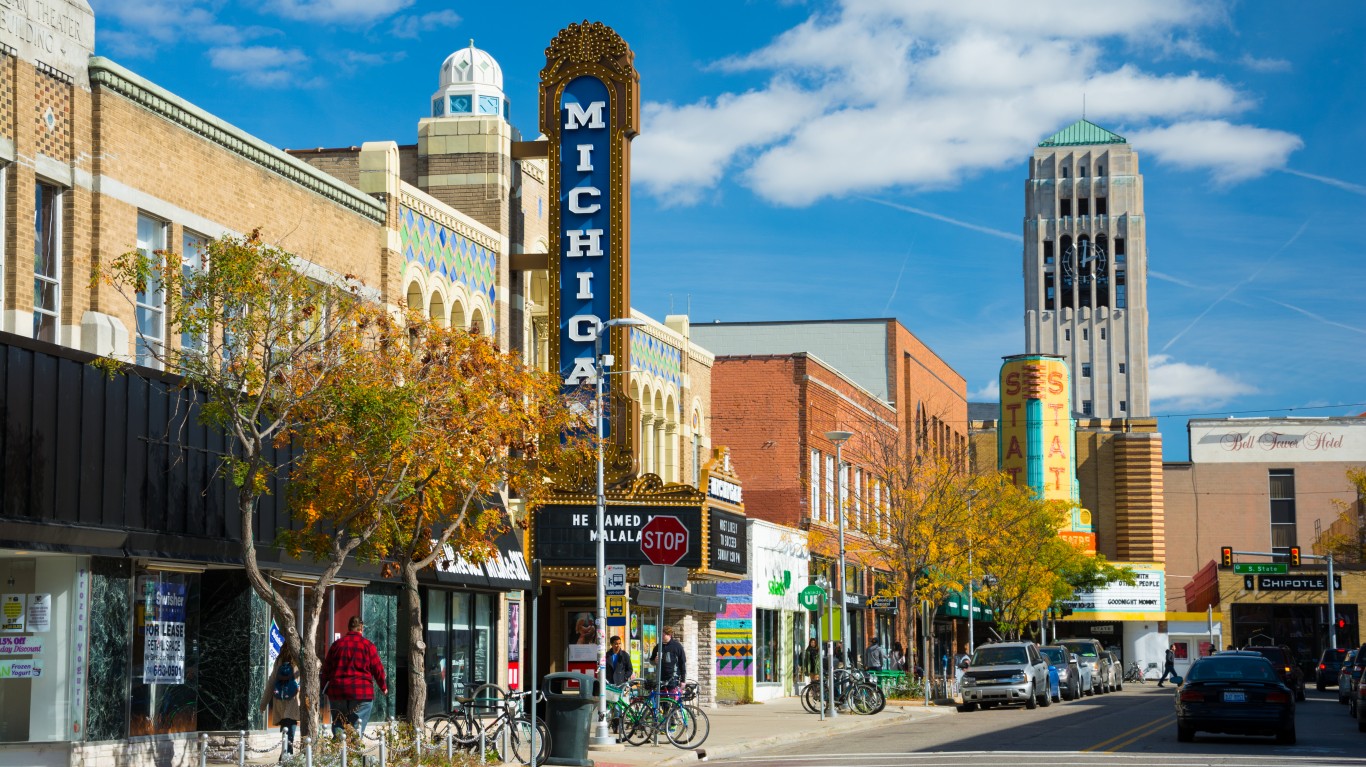
Michigan: Ann Arbor
> Adult obesity rate: 25.5% (Michigan: 32.4%)
> Adults who don’t exercise: 15.1% (Michigan: 23.1%)
> Adults with diabetes: 7.5% (Michigan: 11.0%)
> Adults reporting poor or fair health: 14.4% (Michigan: 18.3%)

Minnesota: Minneapolis-St. Paul-Bloomington
> Adult obesity rate: 27.1% (Minnesota: 29.0%)
> Adults who don’t exercise: 17.6% (Minnesota: 19.6%)
> Adults with diabetes: 7.8% (Minnesota: 8.5%)
> Adults reporting poor or fair health: 12.0% (Minnesota: 12.9%)

Mississippi: Gulfport-Biloxi
> Adult obesity rate: 35.3% (Mississippi: 39.1%)
> Adults who don’t exercise: 27.2% (Mississippi: 30.4%)
> Adults with diabetes: 12.1% (Mississippi: 14.6%)
> Adults reporting poor or fair health: 21.3% (Mississippi: 22.1%)
[in-text-ad-2]

Missouri: Columbia
> Adult obesity rate: 28.1% (Missouri: 32.5%)
> Adults who don’t exercise: 18.7% (Missouri: 25.5%)
> Adults with diabetes: 7.2% (Missouri: 11.4%)
> Adults reporting poor or fair health: 17.0% (Missouri: 19.5%)

Montana: Missoula
> Adult obesity rate: 21.4% (Montana: 27.1%)
> Adults who don’t exercise: 17.9% (Montana: 21.7%)
> Adults with diabetes: 6.5% (Montana: 8.9%)
> Adults reporting poor or fair health: 13.2% (Montana: 14.1%)
[in-text-ad]

Nebraska: Lincoln
> Adult obesity rate: 30.0% (Nebraska: 33.4%)
> Adults who don’t exercise: 17.6% (Nebraska: 22.7%)
> Adults with diabetes: 8.2% (Nebraska: 10.0%)
> Adults reporting poor or fair health: 12.5% (Nebraska: 13.8%)

Nevada: Reno
> Adult obesity rate: 23.7% (Nevada: 27.1%)
> Adults who don’t exercise: 17.9% (Nevada: 22.5%)
> Adults with diabetes: 7.9% (Nevada: 10.5%)
> Adults reporting poor or fair health: 18.1% (Nevada: 19.1%)

New Hampshire: Manchester-Nashua*
> Adult obesity rate: 28.5% (New Hampshire: 28.6%)
> Adults who don’t exercise: 21.7% (New Hampshire: 20.8%)
> Adults with diabetes: 9.7% (New Hampshire: 9.6%)
> Adults reporting poor or fair health: 12.2% (New Hampshire: 12.8%)
*Because Manchester-Nashua is the only eligible metro in New Hampshire, it is the least obese metro by default.
[in-text-ad-2]

New Jersey: Trenton-Princeton
> Adult obesity rate: 27.5% (New Jersey: 27.0%)
> Adults who don’t exercise: 25.8% (New Jersey: 26.6%)
> Adults with diabetes: 10.3% (New Jersey: 9.9%)
> Adults reporting poor or fair health: 16.8% (New Jersey: 15.5%)

New Mexico: Santa Fe
> Adult obesity rate: 16.1% (New Mexico: 27.3%)
> Adults who don’t exercise: 12.7% (New Mexico: 19.0%)
> Adults with diabetes: 6.1% (New Mexico: 9.5%)
> Adults reporting poor or fair health: 17.8% (New Mexico: 20.3%)
[in-text-ad]

New York: Ithaca
> Adult obesity rate: 23.0% (New York: 26.4%)
> Adults who don’t exercise: 14.6% (New York: 23.4%)
> Adults with diabetes: 6.5% (New York: 10.1%)
> Adults reporting poor or fair health: 13.5% (New York: 16.3%)

North Carolina: Durham-Chapel Hill
> Adult obesity rate: 26.8% (North Carolina: 32.3%)
> Adults who don’t exercise: 18.5% (North Carolina: 23.3%)
> Adults with diabetes: 8.1% (North Carolina: 11.5%)
> Adults reporting poor or fair health: 16.6% (North Carolina: 18.0%)

North Dakota: Fargo
> Adult obesity rate: 31.9% (North Dakota: 33.9%)
> Adults who don’t exercise: 19.0% (North Dakota: 23.1%)
> Adults with diabetes: 7.6% (North Dakota: 9.4%)
> Adults reporting poor or fair health: 12.6% (North Dakota: 13.6%)
[in-text-ad-2]

Ohio: Akron
> Adult obesity rate: 30.4% (Ohio: 33.5%)
> Adults who don’t exercise: 25.9% (Ohio: 26.1%)
> Adults with diabetes: 11.6% (Ohio: 12.2%)
> Adults reporting poor or fair health: 17.1% (Ohio: 17.8%)

Oklahoma: Tulsa
> Adult obesity rate: 32.6% (Oklahoma: 34.5%)
> Adults who don’t exercise: 27.1% (Oklahoma: 27.8%)
> Adults with diabetes: 11.8% (Oklahoma: 12.3%)
> Adults reporting poor or fair health: 19.9% (Oklahoma: 20.9%)
[in-text-ad]

Oregon: Corvallis
> Adult obesity rate: 21.6% (Oregon: 29.3%)
> Adults who don’t exercise: 13.9% (Oregon: 17.3%)
> Adults with diabetes: 5.7% (Oregon: 9.7%)
> Adults reporting poor or fair health: 16.1% (Oregon: 18.2%)

Pennsylvania: State College
> Adult obesity rate: 24.0% (Pennsylvania: 30.8%)
> Adults who don’t exercise: 18.3% (Pennsylvania: 22.0%)
> Adults with diabetes: 7.9% (Pennsylvania: 11.0%)
> Adults reporting poor or fair health: 16.0% (Pennsylvania: 17.6%)

Rhode Island: Providence-Warwick*
> Adult obesity rate: 28.6% (Rhode Island: 28.5%)
> Adults who don’t exercise: 23.8% (Rhode Island: 23.5%)
> Adults with diabetes: 10.1% (Rhode Island: 10.1%)
> Adults reporting poor or fair health: 16.8% (Rhode Island: 16.5%)
*Because Providence-Warwick is the only eligible metro in Rhode Island, it is the least obese metro by default.
[in-text-ad-2]

South Carolina: Hilton Head Island-Bluffton
> Adult obesity rate: 26.6% (South Carolina: 34.0%)
> Adults who don’t exercise: 18.1% (South Carolina: 26.0%)
> Adults with diabetes: 9.5% (South Carolina: 13.3%)
> Adults reporting poor or fair health: 15.7% (South Carolina: 17.8%)

South Dakota: Rapid City
> Adult obesity rate: 29.3% (South Dakota: 32.4%)
> Adults who don’t exercise: 21.9% (South Dakota: 22.0%)
> Adults with diabetes: 9.8% (South Dakota: 10.1%)
> Adults reporting poor or fair health: 14.2% (South Dakota: 13.4%)
[in-text-ad]

Tennessee: Nashville-Davidson–Murfreesboro–Franklin
> Adult obesity rate: 30.0% (Tennessee: 33.3%)
> Adults who don’t exercise: 23.9% (Tennessee: 27.2%)
> Adults with diabetes: 10.0% (Tennessee: 12.5%)
> Adults reporting poor or fair health: 18.7% (Tennessee: 21.2%)

Texas: Austin-Round Rock-Georgetown
> Adult obesity rate: 26.9% (Texas: 31.4%)
> Adults who don’t exercise: 17.1% (Texas: 23.2%)
> Adults with diabetes: 7.9% (Texas: 10.2%)
> Adults reporting poor or fair health: 16.3% (Texas: 18.7%)

Utah: St. George
> Adult obesity rate: 24.0% (Utah: 27.0%)
> Adults who don’t exercise: 17.4% (Utah: 16.7%)
> Adults with diabetes: 8.6% (Utah: 7.5%)
> Adults reporting poor or fair health: 15.9% (Utah: 14.8%)
[in-text-ad-2]

Vermont: Burlington-South Burlington*
> Adult obesity rate: 25.4% (Vermont: 27.0%)
> Adults who don’t exercise: 16.6% (Vermont: 18.4%)
> Adults with diabetes: 7.7% (Vermont: 8.8%)
> Adults reporting poor or fair health: 11.8% (Vermont: 12.8%)
*Because Burlington-South Burlington is the only eligible metro in Vermont, it is the least obese metro by default.

Virginia: Charlottesville
> Adult obesity rate: 28.8% (Virginia: 30.5%)
> Adults who don’t exercise: 19.7% (Virginia: 22.2%)
> Adults with diabetes: 10.2% (Virginia: 10.7%)
> Adults reporting poor or fair health: 16.4% (Virginia: 16.6%)
[in-text-ad]

Washington: Seattle-Tacoma-Bellevue
> Adult obesity rate: 26.1% (Washington: 28.6%)
> Adults who don’t exercise: 15.2% (Washington: 16.4%)
> Adults with diabetes: 8.5% (Washington: 9.3%)
> Adults reporting poor or fair health: 14.0% (Washington: 15.0%)

West Virginia: Morgantown
> Adult obesity rate: 31.8% (West Virginia: 37.8%)
> Adults who don’t exercise: 21.9% (West Virginia: 28.0%)
> Adults with diabetes: 11.1% (West Virginia: 15.1%)
> Adults reporting poor or fair health: 20.8% (West Virginia: 23.6%)

Wisconsin: Madison
> Adult obesity rate: 25.9% (Wisconsin: 31.7%)
> Adults who don’t exercise: 15.5% (Wisconsin: 20.3%)
> Adults with diabetes: 6.6% (Wisconsin: 9.5%)
> Adults reporting poor or fair health: 12.5% (Wisconsin: 14.8%)
[in-text-ad-2]
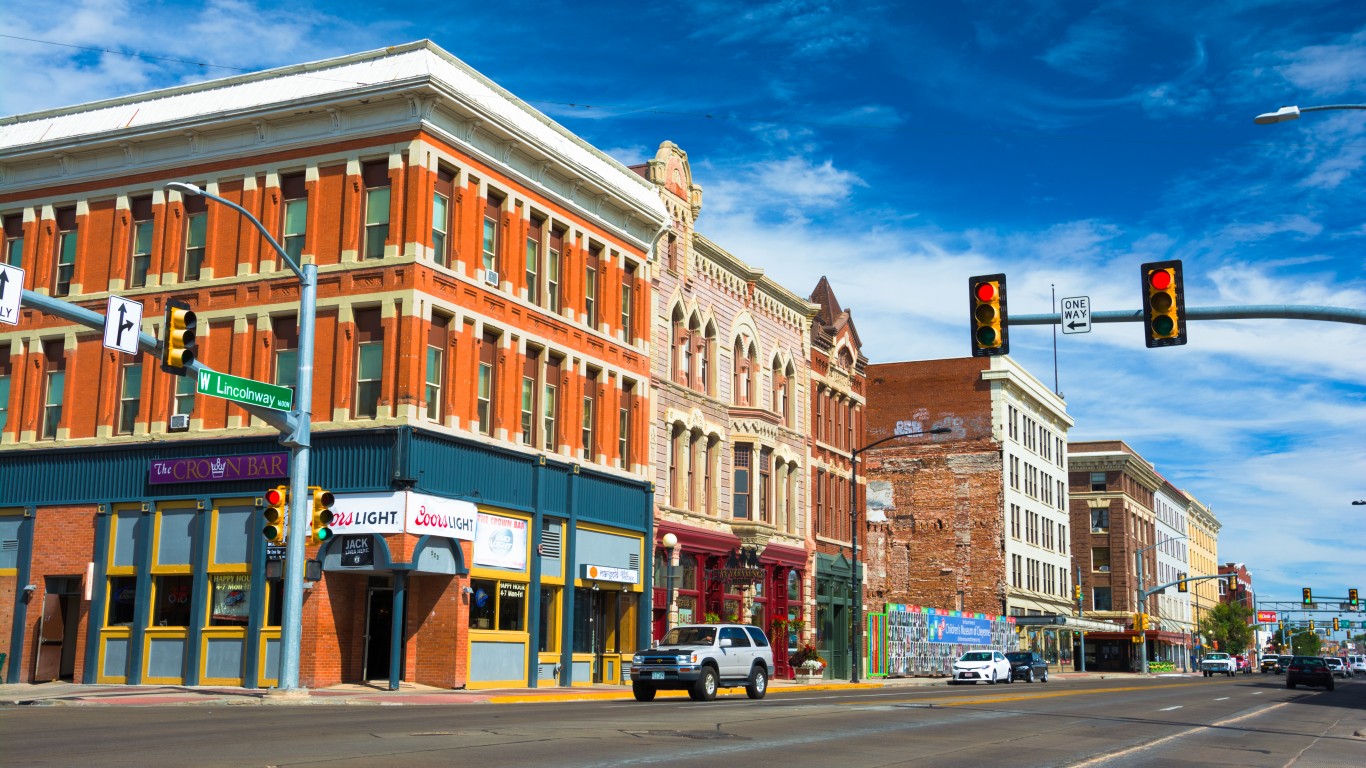
Wyoming: Cheyenne
> Adult obesity rate: 30.1% (Wyoming: 29.2%)
> Adults who don’t exercise: 22.5% (Wyoming: 23.1%)
> Adults with diabetes: 9.9% (Wyoming: 9.0%)
> Adults reporting poor or fair health: 15.4% (Wyoming: 15.3%)
Methodology
To determine the least obese metro in every state, 24/7 Tempo reviewed county-level adult obesity rates from the Robert Wood Johnson Foundation and the University of Wisconsin Population Health Institute joint program’s 2021 County Health Rankings & Roadmaps report.
The adult obesity rate is defined as the share of adults 20 years and older who report a body mass index of 30 kg/m2 or higher. We aggregated county-level statistics to metropolitan statistical areas. While the CHR report is from 2021, obesity rate figures published in the report are from 2017.
We used the 384 metropolitan statistical areas as delineated by the United States Office of Management and Budget and used by the Census Bureau as our definition of metros.
Metros were ranked within their state based on the adult obesity rate. Since many metros cross state lines, the metro was assigned to the state of its first-listed principal city. Thus, the Washington-Arlington-Alexandria, DC-VA-MD-WV metro area was excluded as it is principally in the District of Columbia.
Additional information on the share of adults who report no leisure-time physical activity, the share of adults diagnosed with diabetes, and the share of adults who report fair or poor health are also from the 2021 CHR.
100 Million Americans Are Missing This Crucial Retirement Tool
The thought of burdening your family with a financial disaster is most Americans’ nightmare. However, recent studies show that over 100 million Americans still don’t have proper life insurance in the event they pass away.
Life insurance can bring peace of mind – ensuring your loved ones are safeguarded against unforeseen expenses and debts. With premiums often lower than expected and a variety of plans tailored to different life stages and health conditions, securing a policy is more accessible than ever.
A quick, no-obligation quote can provide valuable insight into what’s available and what might best suit your family’s needs. Life insurance is a simple step you can take today to help secure peace of mind for your loved ones tomorrow.
Click here to learn how to get a quote in just a few minutes.
Thank you for reading! Have some feedback for us?
Contact the 24/7 Wall St. editorial team.
 24/7 Wall St.
 24/7 Wall St.
 24/7 Wall St.
 24/7 Wall St.

