In 2020, the crime rate fell in Texas. A report from the Texas Department of Public Safety calculated the Lone Star State’s rate for violent and property offenses in 2020 was an aggregate of 2,666.7 crimes per 100,000 residents (based on an estimated population of 29.4 million), a decrease of 4% from 2019. (See where Texas ranks among America’s most dangerous states.)
Not all types of criminal offenses decreased, though. The state saw a rise in violent crimes last year, which were up 6.6% over 2019. Property crimes, however, decreased 5.9% from the previous year. The FBI defines property crime as offenses including burglary, larceny-theft, motor vehicle theft, and arson. Violent crime includes murder and nonnegligent manslaughter, rаpe, robbery, and aggravated assault. (Here are 25 cities where murders are on the rise.)
Even as the state as a whole experienced less crime in 2020 than the previous year, several cities in Texas were plagued by high levels of criminal activity.
To determine the 25 most dangerous cities in Texas, 24/7 Wall St. reviewed data on violent crimes from the FBI’s Crime Data Explorer. Cities and towns with a population of at least 2,500 were ranked based on the number of violent crimes reported in 2020 per 100,000 residents. Data on population and property crimes also came from the FBI. Supplemental data on median household income and poverty rate came from the U.S. Census Bureau’s 2019 American Community Survey and are five-year estimates.
Experts have debated the root causes of crime for decades. One factor often cited is poverty. In 2018, the Brookings Institution released a study of more than 2.2 million prisoners suggesting a link between high crime rates and poverty. The report stated “Three years prior to incarceration, only 49% of prime-age men are employed, and, when employed, their median earnings were only $6,250.” Their economic situation doesn’t improve much after leaving prison.
In the 25 cities listed here, the poverty rate ranges from a scant 0.5% to a 30.8% in the community rated as most dangerous — Palmview, a city of 5,806 near the Mexican border. That’s more than double the national average of 11.4%. Violent crimes there totaled 108 last year, for a ratio of 1,860.1 per 100,000 residents. Meanwhile, property crimes reached 276, adding up to 4,753.7 per 100,000 residents.
Click here to see the 25 most dangerous cities in Texas
On the other hand, No. 4 on the list, Houston, had a much lower poverty rate of 0.5%. But its high crime rate is likely due to its sizable population of nearly 2.3 million. More people in a crowded metropolitan area tends to lead to more opportunities to commit crimes.

25. San Antonio
> Violent crimes in 2020: 735.4 per 100,000 (11,569 total)
> Property crimes in 2020: 3,626.8 per 100,000 (57,057 total)
> Median household income: $52,455
> Poverty rate: 0.6%
> Population: 1,573,189
[in-text-ad]
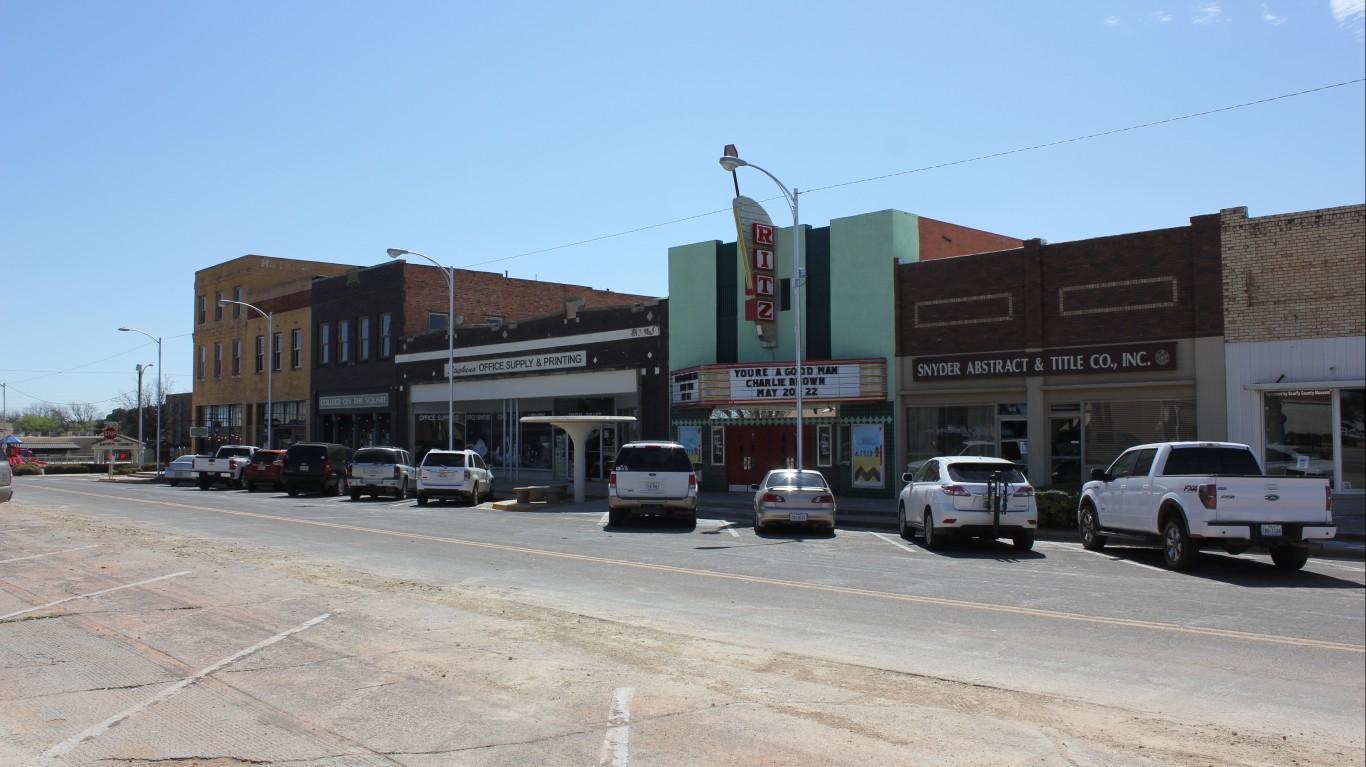
24. Snyder
> Violent crimes in 2020: 745.2 per 100,000 (82 total)
> Property crimes in 2020: 1,054.2 per 100,000 (116 total)
> Median household income: $54,191
> Poverty rate: 9%
> Population: 11,004
23. Port Arthur
> Violent crimes in 2020: 777.8 per 100,000 (422 total)
> Property crimes in 2020: 2,309.4 per 100,000 (1,253 total)
> Median household income: $36,557
> Poverty rate: 4.3%
> Population: 54,257
22. Raymondville
> Violent crimes in 2020: 793.9 per 100,000 (86 total)
> Property crimes in 2020: 1,652.4 per 100,000 (179 total)
> Median household income: $29,750
> Poverty rate: 9.7%
> Population: 10,833
[in-text-ad-2]
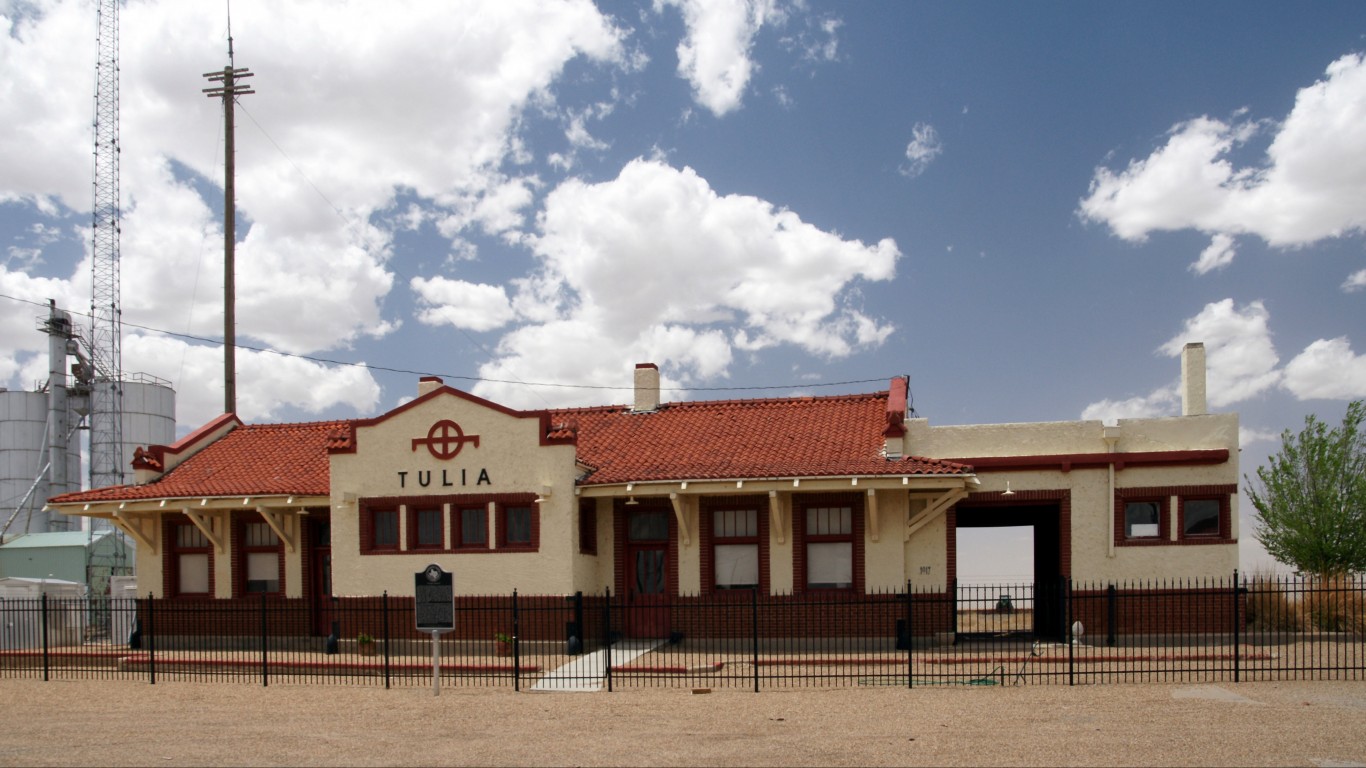
21. Tulia
> Violent crimes in 2020: 801.2 per 100,000 (37 total)
> Property crimes in 2020: 2,446.9 per 100,000 (113 total)
> Median household income: $32,242
> Poverty rate: 12.9%
> Population: 4,618
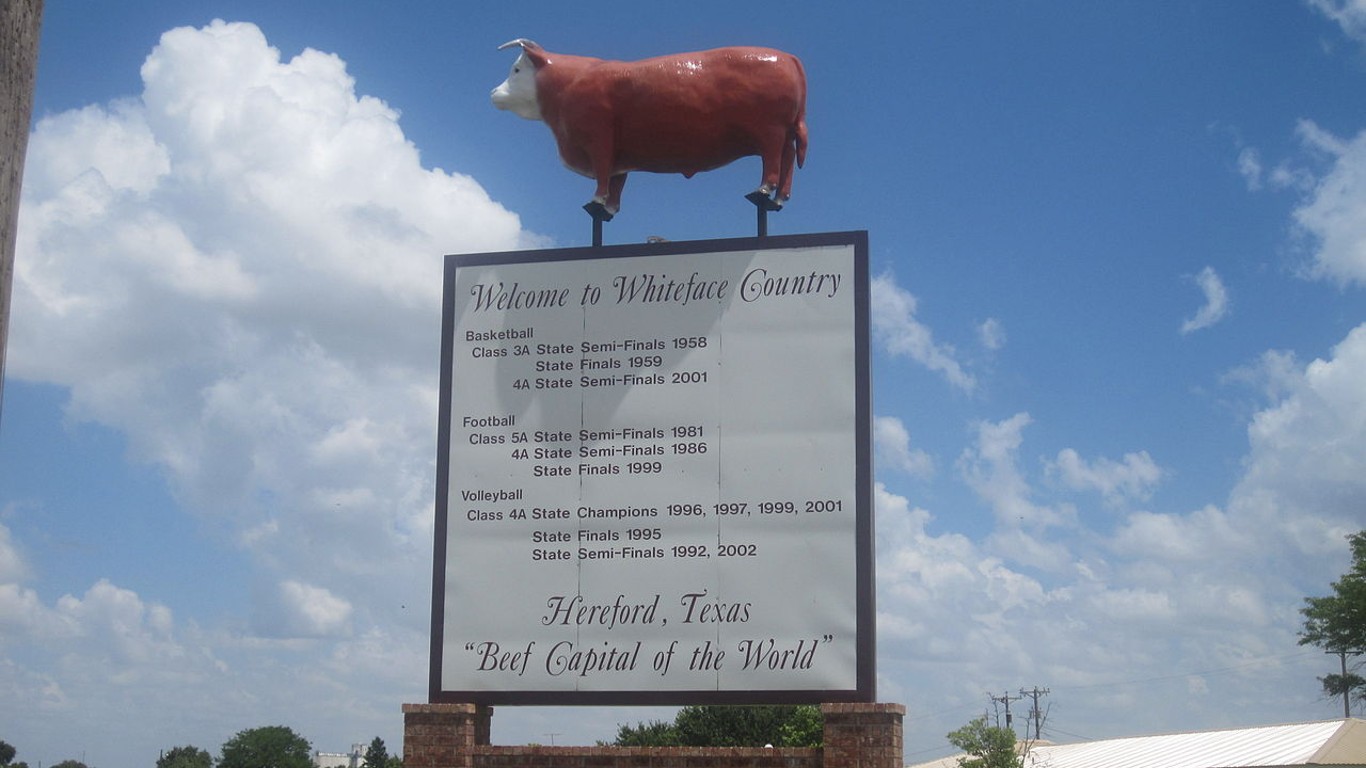
20. Hereford
> Violent crimes in 2020: 805 per 100,000 (117 total)
> Property crimes in 2020: 1,926.5 per 100,000 (280 total)
> Median household income: $49,338
> Poverty rate: 5.8%
> Population: 14,534
[in-text-ad]

19. Odessa
> Violent crimes in 2020: 807.7 per 100,000 (1,020 total)
> Property crimes in 2020: 2,504.6 per 100,000 (3,163 total)
> Median household income: $63,847
> Poverty rate: 1.9%
> Population: 126,288
18. Lufkin
> Violent crimes in 2020: 811.3 per 100,000 (284 total)
> Property crimes in 2020: 00 per 100,000 (00 total)
> Median household income: $48,588
> Poverty rate: 4.6%
> Population: 35,007
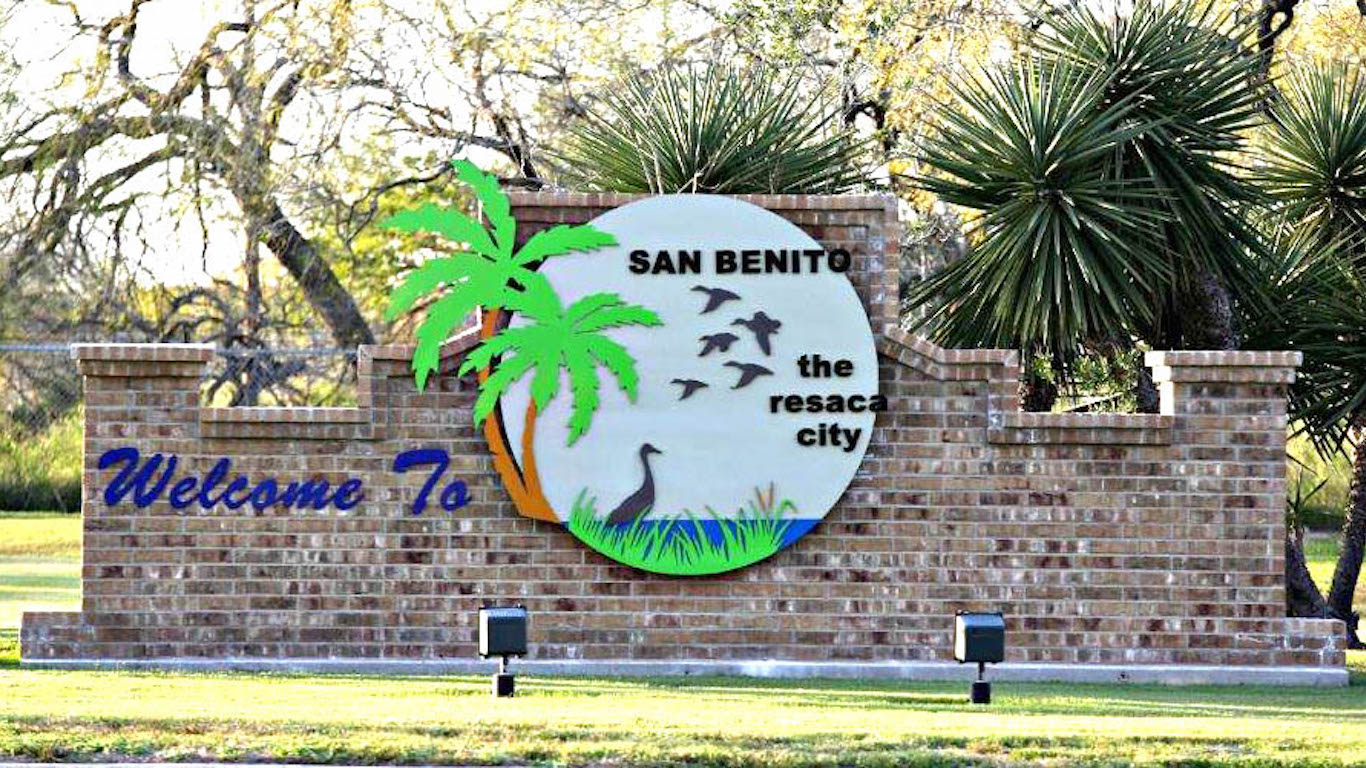
17. San Benito
> Violent crimes in 2020: 812.8 per 100,000 (197 total)
> Property crimes in 2020: 2,780.9 per 100,000 (674 total)
> Median household income: $27,460
> Poverty rate: 9%
> Population: 24,237
[in-text-ad-2]

16. Amarillo
> Violent crimes in 2020: 836.8 per 100,000 (1,676 total)
> Property crimes in 2020: 3,679.1 per 100,000 (7,369 total)
> Median household income: $52,725
> Poverty rate: 1.3%
> Population: 200,296

15. Corpus Christi
> Violent crimes in 2020: 842.4 per 100,000 (2,772 total)
> Property crimes in 2020: 3,266.1 per 100,000 (10,747 total)
> Median household income: $56,333
> Poverty rate: 1.3%
> Population: 329,050
[in-text-ad]
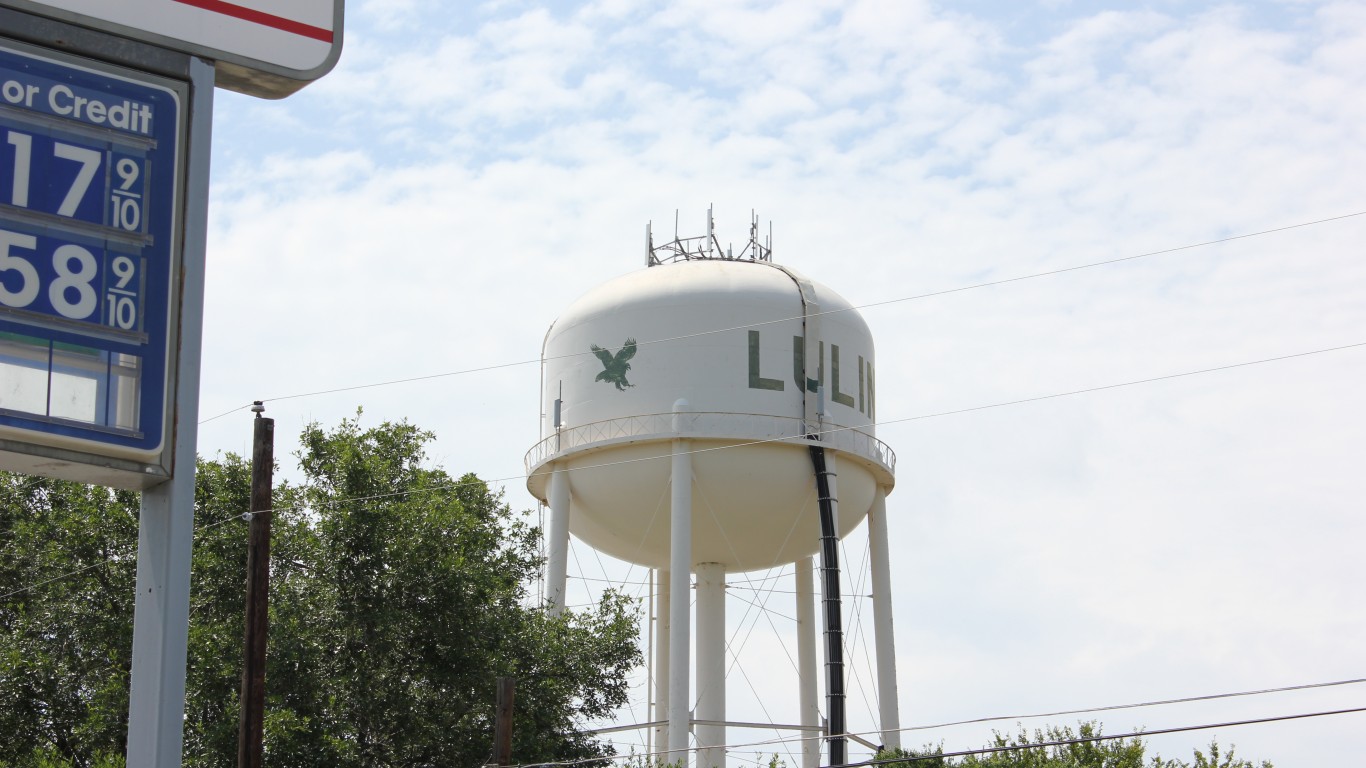
14. Luling
> Violent crimes in 2020: 844.2 per 100,000 (50 total)
> Property crimes in 2020: 1,131.2 per 100,000 (67 total)
> Median household income: $48,919
> Poverty rate: 24.6%
> Population: 5,923

13. Dallas
> Violent crimes in 2020: 844.7 per 100,000 (11,514 total)
> Property crimes in 2020: 3,446.3 per 100,000 (46,974 total)
> Median household income: $52,580
> Poverty rate: 0.6%
> Population: 1,363,028
12. Paris
> Violent crimes in 2020: 991.9 per 100,000 (246 total)
> Property crimes in 2020: 2,858.8 per 100,000 (709 total)
> Median household income: $32,544
> Poverty rate: 6.4%
> Population: 24,801
[in-text-ad-2]
11. New Boston
> Violent crimes in 2020: 1,024.4 per 100,000 (47 total)
> Property crimes in 2020: 2,354 per 100,000 (108 total)
> Median household income: $46,320
> Poverty rate: 10.7%
> Population: 4,588
10. Humble
> Violent crimes in 2020: 1,025.1 per 100,000 (163 total)
> Property crimes in 2020: 8,351.7 per 100,000 (1,328 total)
> Median household income: $41,845
> Poverty rate: 16.5%
> Population: 15,901
[in-text-ad]

9. Donna
> Violent crimes in 2020: 1,048.8 per 100,000 (172 total)
> Property crimes in 2020: 3,323.2 per 100,000 (545 total)
> Median household income: $29,724
> Poverty rate: 9.2%
> Population: 16,400
8. Bellmead
> Violent crimes in 2020: 1,052.1 per 100,000 (114 total)
> Property crimes in 2020: 5,159.2 per 100,000 (559 total)
> Median household income: $41,696
> Poverty rate: 8.3%
> Population: 10,835
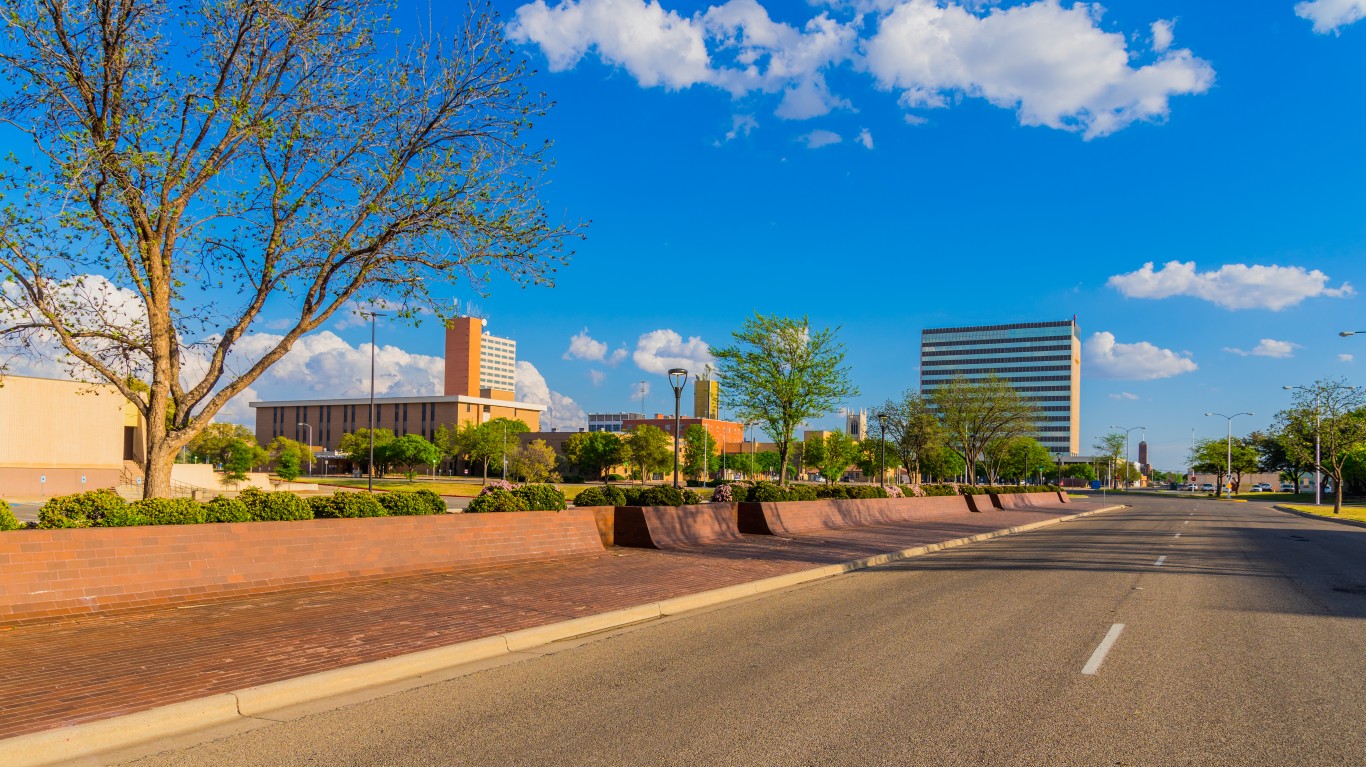
7. Lubbock
> Violent crimes in 2020: 1,087.9 per 100,000 (2,852 total)
> Property crimes in 2020: 4,108.4 per 100,000 (10,770 total)
> Median household income: $50,453
> Poverty rate: 1.8%
> Population: 262,146
[in-text-ad-2]

6. Beaumont
> Violent crimes in 2020: 1,225.5 per 100,000 (1,431 total)
> Property crimes in 2020: 3,308.3 per 100,000 (3,863 total)
> Median household income: $50,632
> Poverty rate: 2.3%
> Population: 116,766
5. Nash
> Violent crimes in 2020: 1,244.3 per 100,000 (49 total)
> Property crimes in 2020: 1,498.2 per 100,000 (59 total)
> Median household income: $36,382
> Poverty rate: 9.4%
> Population: 3,938
[in-text-ad]
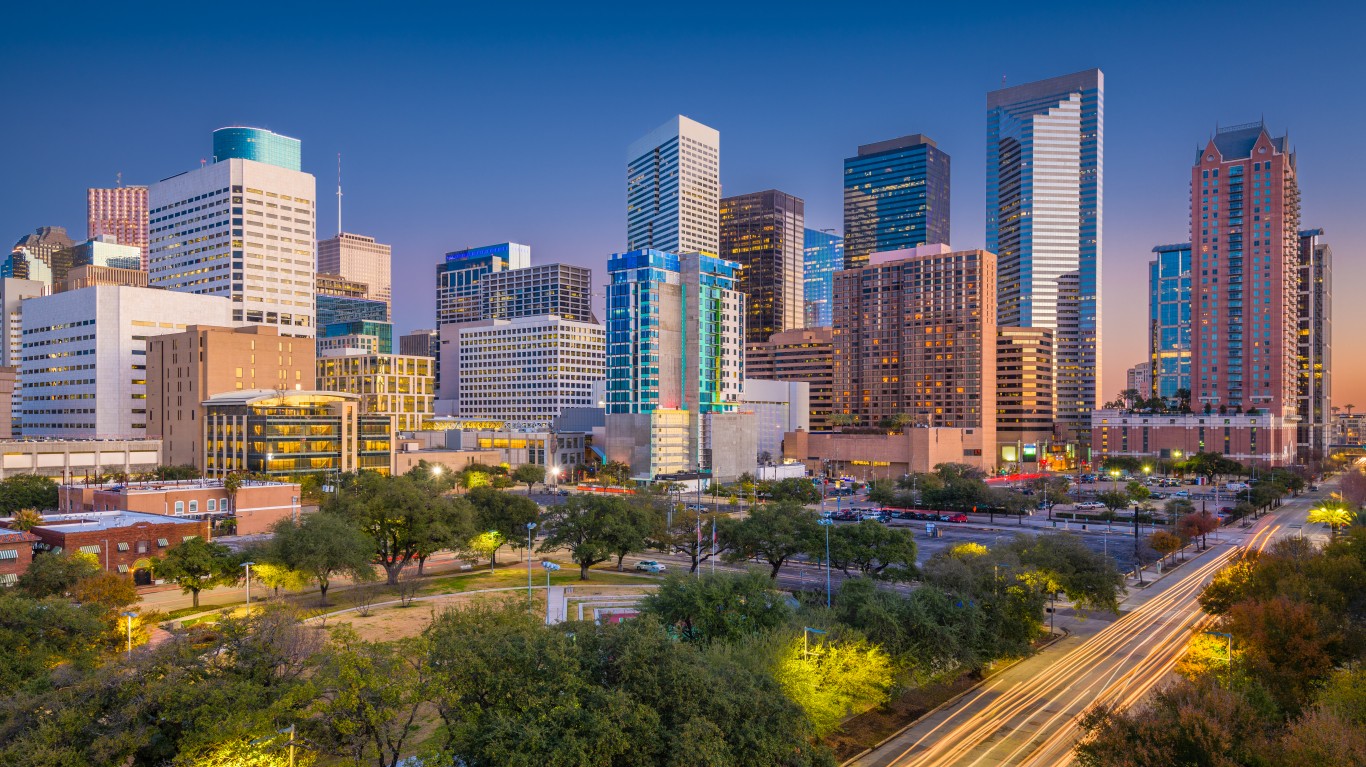
4. Houston
> Violent crimes in 2020: 1,256.3 per 100,000 (29,474 total)
> Property crimes in 2020: 4,178.9 per 100,000 (98,043 total)
> Median household income: $52,338
> Poverty rate: 0.5%
> Population: 2,346,155
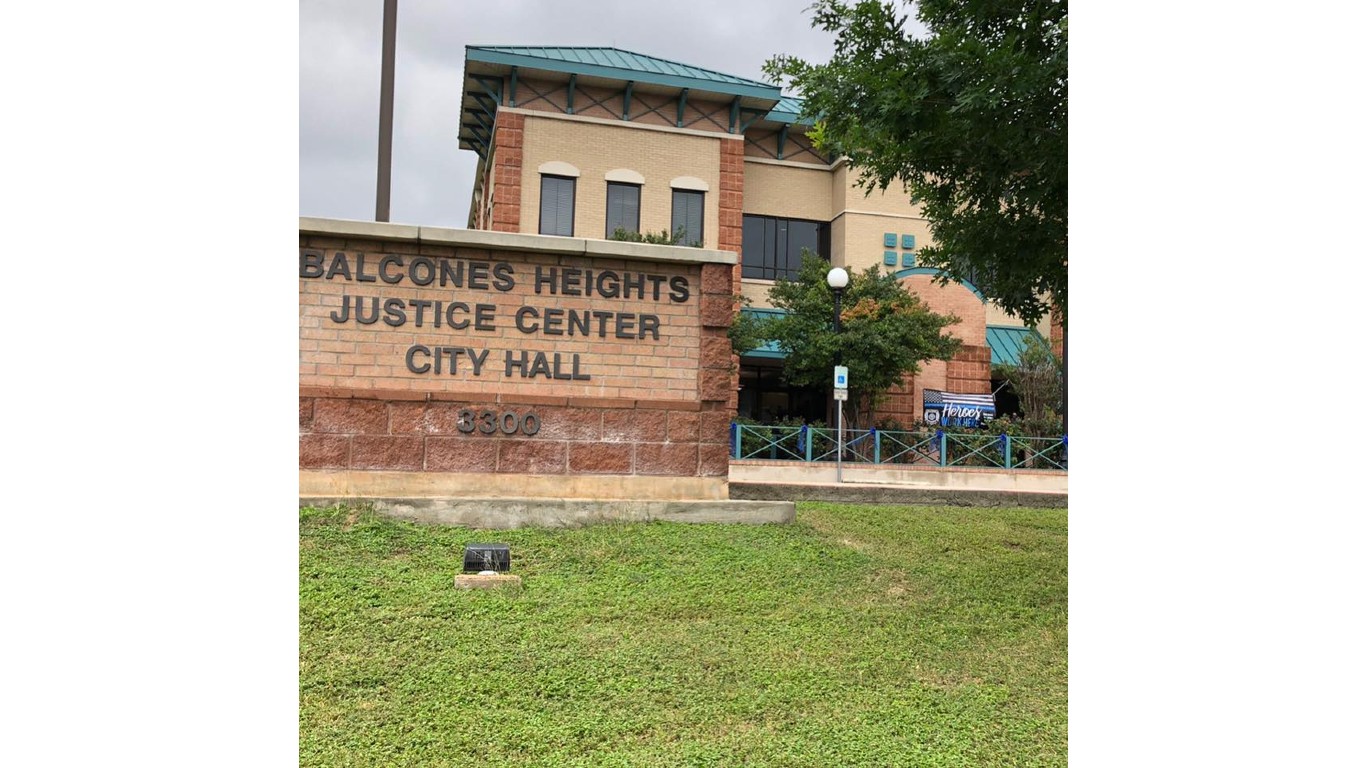
3. Balcones Heights
> Violent crimes in 2020: 1,487.2 per 100,000 (50 total)
> Property crimes in 2020: 6,038.1 per 100,000 (203 total)
> Median household income: $31,410
> Poverty rate: 16.7%
> Population: 3,362

2. South Padre Island
> Violent crimes in 2020: 1,551.2 per 100,000 (43 total)
> Property crimes in 2020: 13,492.1 per 100,000 (374 total)
> Median household income: $45,221
> Poverty rate: 25.5%
> Population: 2,772
[in-text-ad-2]
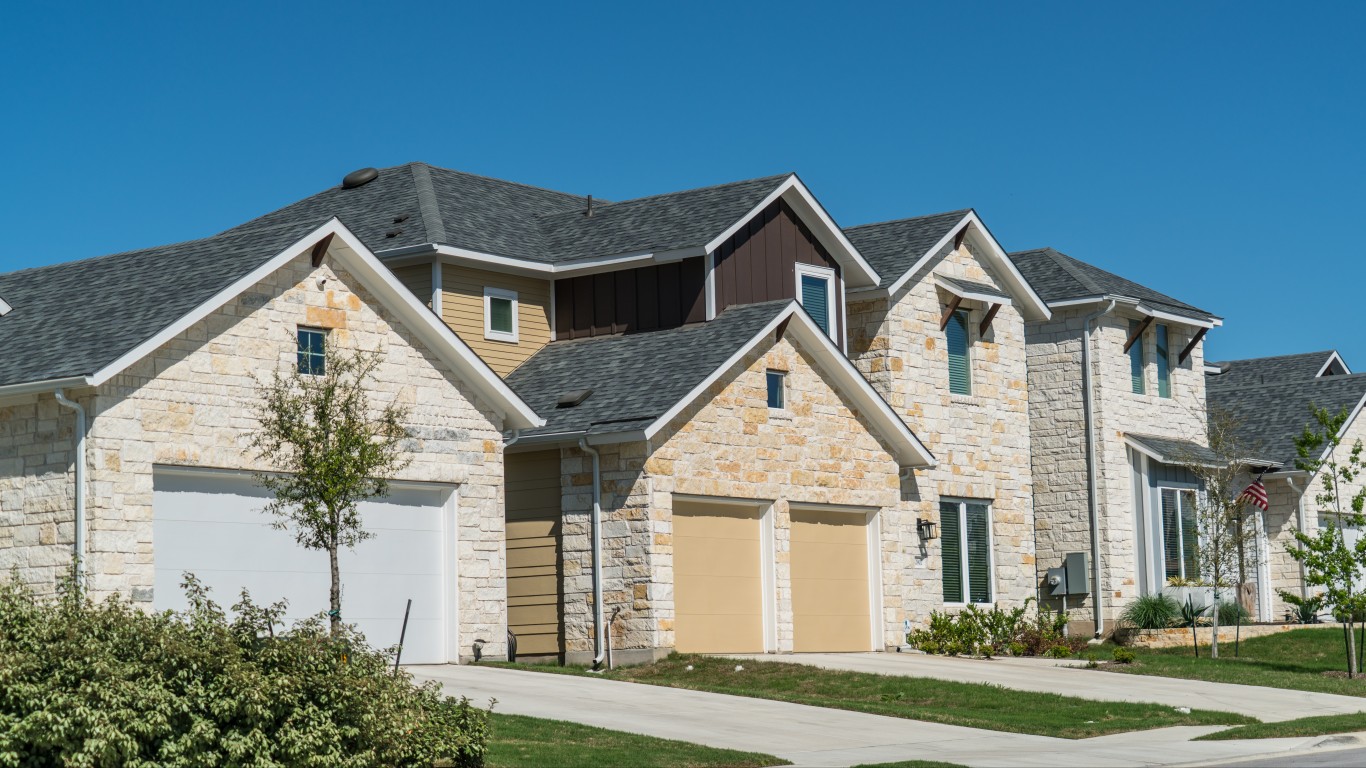
1. Palmview
> Violent crimes in 2020: 1,860.1 per 100,000 (108 total)
> Property crimes in 2020: 4,753.7 per 100,000 (276 total)
> Median household income: $29,419
> Poverty rate: 30.8%
> Population: 5,806
Are You Ahead, or Behind on Retirement? (sponsor)
If you’re one of the over 4 Million Americans set to retire this year, you may want to pay attention.
Finding a financial advisor who puts your interest first can be the difference between a rich retirement and barely getting by, and today it’s easier than ever. SmartAsset’s free tool matches you with up to three fiduciary financial advisors that serve your area in minutes. Each advisor has been carefully vetted, and must act in your best interests. Start your search now.
Don’t waste another minute; get started right here and help your retirement dreams become a retirement reality.
Thank you for reading! Have some feedback for us?
Contact the 24/7 Wall St. editorial team.
 24/7 Wall St.
 24/7 Wall St.
