How bad a problem is excessive drinking in America? The Centers for Disease Control and Prevention reports that 16% of adults engage in binge drinking. Another 7% report heavy drinking.
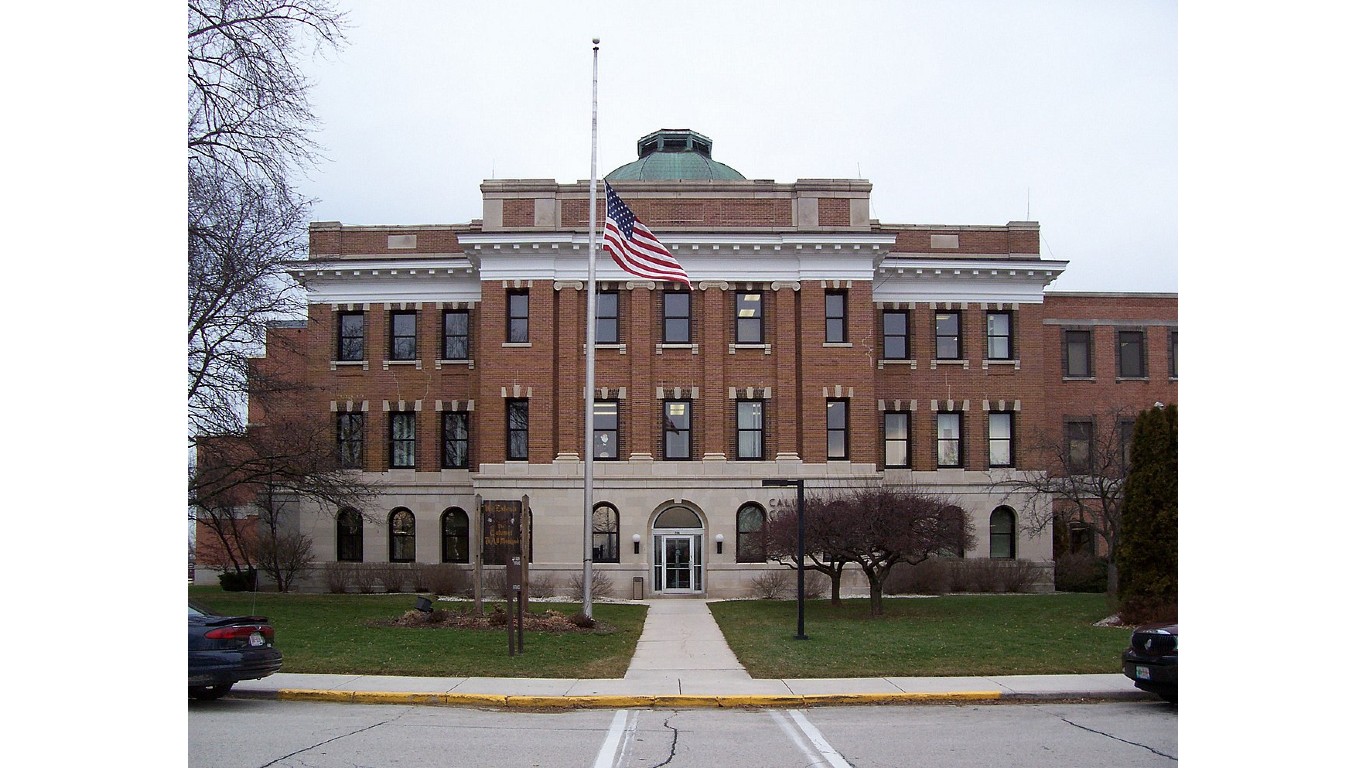
Drinking levels vary considerably by state. The states with the most severe excessive drinking problems are the Upper Midwest and Plains states. They include Wisconsin, North Dakota, and Iowa. The drunkest county in America is Outagamie County, Wisconsin.
The health effects of excessive drinking are profound. Among the short-term effects are car accidents. Among the longer-term problems are high blood pressure, cancer, and memory problems. Each year, alcohol abuse is directly linked to diseases and accidents that kill an estimated 95,000 Americans. Excessive drinking also costs the economy hundreds of billions of dollars annually, mostly in lost productivity. (These are America’s drunkest states.)
To identify the 50 drunkest U.S. counties, 24/7 Tempo reviewed excessive drinking rates data from County Health Rankings & Roadmaps, a joint program between the Robert Wood Johnson Foundation and the University of Wisconsin Population Health Institute. In each of the 50 counties, more than one in four adults drink excessively, while nationwide, fewer than one in five do.
The counties we examined were ranked on their excessive drinking rate — the share of adults who either binge drink or drink heavily. CHR defines binge drinking as consuming more than four drinks in a single occasion for women and more than five drinks for men, while heavy drinking is defined as consuming more than one drink a day on average for women and more than two drinks a day for men.
It is important to note that alcohol affects everyone differently, and as a general rule, drinking less is better than drinking more. Additionally, the vast majority of Americans who drink excessively (about 90% of them) do not have a severe alcohol-use disorder, a chronic disease commonly referred to as alcoholism.
While the drunkest county in America is Outagamie County, Wisconsin, the least drunk county in America is Utah County, Utah.
Here are the details for Outagamie County:
Adults binge or heavy drinking: 31.0%
Driving deaths involving alcohol: 32.0% (tied for 993rd highest of 3,081 counties)
Median household income: $65,572 (436th highest)
Adults reporting poor or fair health: 13.7% (259th lowest)
Click here for America’s drunkest counties
Click here to read our detailed methodology
50. Trempealeau County, Wisconsin
> Adults binge or heavy drinking: 26.8%
> Driving deaths involving alcohol: 50.0% — 140th highest of 3,081 counties (tied)
> Median household income: $58,548 — 866th highest of 3,106 counties
> Adults reporting poor or fair health: 15.7% — 662nd lowest of 3,106 counties
[in-text-ad]
49. Waushara County, Wisconsin
> Adults binge or heavy drinking: 26.8%
> Driving deaths involving alcohol: 34.8% — 737th highest of 3,081 counties (tied)
> Median household income: $52,810 — 1,426th highest of 3,106 counties
> Adults reporting poor or fair health: 17.9% — 1,153rd lowest of 3,106 counties
48. Florence County, Wisconsin
> Adults binge or heavy drinking: 26.9%
> Driving deaths involving alcohol: 0.0% reported — the lowest of 3,081 counties (tied)
> Median household income: $52,181 — 1,507th highest of 3,106 counties
> Adults reporting poor or fair health: 16.2% — 767th lowest of 3,106 counties
47. Lyon County, Iowa
> Adults binge or heavy drinking: 26.9%
> Driving deaths involving alcohol: 22.2% — 1,062nd lowest of 3,081 counties (tied)
> Median household income: $64,982 — 459th highest of 3,106 counties
> Adults reporting poor or fair health: 12.7% — 127th lowest of 3,106 counties
[in-text-ad-2]
46. Delaware County, Iowa
> Adults binge or heavy drinking: 26.9%
> Driving deaths involving alcohol: 0.0% reported — the lowest of 3,081 counties (tied)
> Median household income: $63,750 — 534th highest of 3,106 counties (tied)
> Adults reporting poor or fair health: 14.3% — 365th lowest of 3,106 counties
45. Marinette County, Wisconsin
> Adults binge or heavy drinking: 27.0%
> Driving deaths involving alcohol: 44.1% — 319th highest of 3,081 counties (tied)
> Median household income: $50,330 — 1,396th lowest of 3,106 counties
> Adults reporting poor or fair health: 17.1% — 988th lowest of 3,106 counties
[in-text-ad]
44. Stanley County, South Dakota
> Adults binge or heavy drinking: 27.0%
> Driving deaths involving alcohol: 0.0% reported — the lowest of 3,081 counties (tied)
> Median household income: $71,382 — 282nd highest of 3,106 counties
> Adults reporting poor or fair health: 10.9% — 14th lowest of 3,106 counties
43. Mercer County, North Dakota
> Adults binge or heavy drinking: 27.0%
> Driving deaths involving alcohol: 57.1% — 98th highest of 3,081 counties (tied)
> Median household income: $82,181 — 142nd highest of 3,106 counties
> Adults reporting poor or fair health: 13.8% — 270th lowest of 3,106 counties
42. Monroe County, Wisconsin
> Adults binge or heavy drinking: 27.0%
> Driving deaths involving alcohol: 30.3% — 1,141st highest of 3,081 counties (tied)
> Median household income: $59,587 — 792nd highest of 3,106 counties
> Adults reporting poor or fair health: 16.4% — 816th lowest of 3,106 counties
[in-text-ad-2]
41. Benton County, Iowa
> Adults binge or heavy drinking: 27.1%
> Driving deaths involving alcohol: 13.9% — 434th lowest of 3,081 counties (tied)
> Median household income: $67,729 — 365th highest of 3,106 counties
> Adults reporting poor or fair health: 13.0% — 153rd lowest of 3,106 counties
40. Iron County, Wisconsin
> Adults binge or heavy drinking: 27.1%
> Driving deaths involving alcohol: 42.9% — 339th highest of 3,081 counties (tied)
> Median household income: $43,798 — 747th lowest of 3,106 counties (tied)
> Adults reporting poor or fair health: 16.4% — 835th lowest of 3,106 counties
[in-text-ad]
39. Waupaca County, Wisconsin
> Adults binge or heavy drinking: 27.2%
> Driving deaths involving alcohol: 37.8% — 556th highest of 3,081 counties
> Median household income: $58,693 — 856th highest of 3,106 counties
> Adults reporting poor or fair health: 15.3% — 584th lowest of 3,106 counties
38. Le Sueur County, Minnesota
> Adults binge or heavy drinking: 27.2%
> Driving deaths involving alcohol: 31.3% — 1,057th highest of 3,081 counties (tied)
> Median household income: $71,080 — 291st highest of 3,106 counties
> Adults reporting poor or fair health: 12.9% — 146th lowest of 3,106 counties
37. Taylor County, Wisconsin
> Adults binge or heavy drinking: 27.2%
> Driving deaths involving alcohol: 38.9% — 511th highest of 3,081 counties (tied)
> Median household income: $53,020 — 1,396th highest of 3,106 counties
> Adults reporting poor or fair health: 17.1% — 968th lowest of 3,106 counties
[in-text-ad-2]

36. Buffalo County, Wisconsin
> Adults binge or heavy drinking: 27.2%
> Driving deaths involving alcohol: 25.0% — 1,312th lowest of 3,081 counties (tied)
> Median household income: $57,829 — 928th highest of 3,106 counties
> Adults reporting poor or fair health: 15.7% — 670th lowest of 3,106 counties
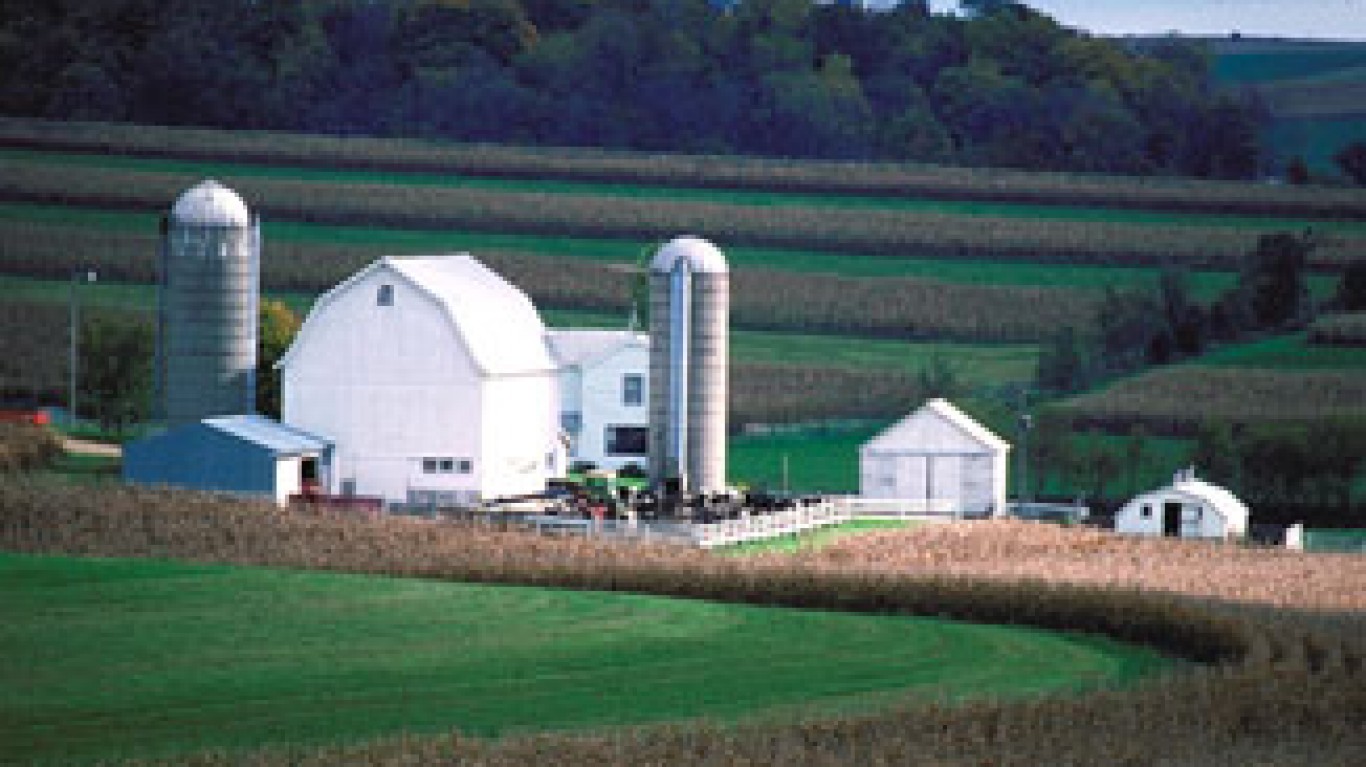
35. Green County, Wisconsin
> Adults binge or heavy drinking: 27.2%
> Driving deaths involving alcohol: 28.0% — 1,406th highest of 3,081 counties (tied)
> Median household income: $64,502 — 486th highest of 3,106 counties
> Adults reporting poor or fair health: 14.2% — 353rd lowest of 3,106 counties
[in-text-ad]
34. Chippewa County, Wisconsin
> Adults binge or heavy drinking: 27.3%
> Driving deaths involving alcohol: 35.7% — 678th highest of 3,081 counties (tied)
> Median household income: $59,742 — 781st highest of 3,106 counties
> Adults reporting poor or fair health: 15.2% — 551st lowest of 3,106 counties
33. Marquette County, Wisconsin
> Adults binge or heavy drinking: 27.3%
> Driving deaths involving alcohol: 35.3% — 698th highest of 3,081 counties (tied)
> Median household income: $52,288 — 1,492nd highest of 3,106 counties
> Adults reporting poor or fair health: 16.7% — 892nd lowest of 3,106 counties
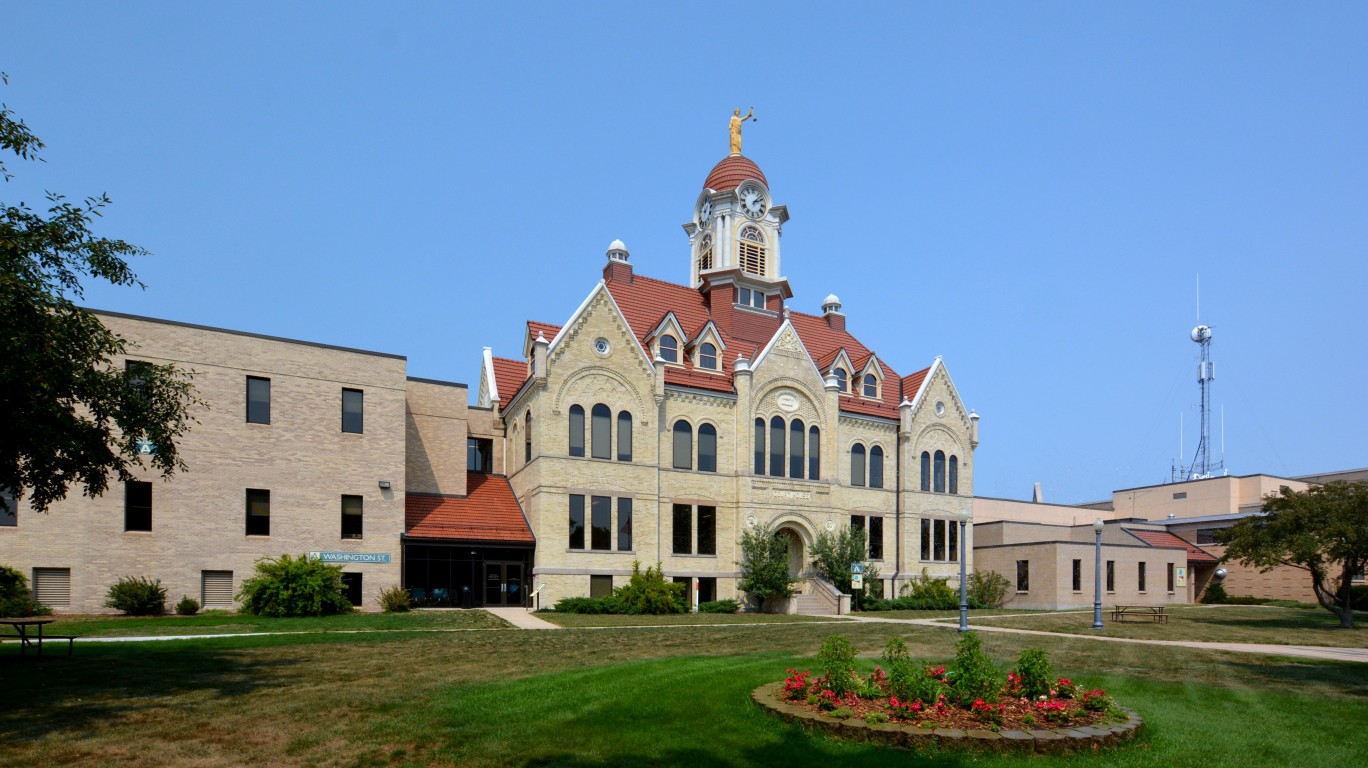
32. Oconto County, Wisconsin
> Adults binge or heavy drinking: 27.3%
> Driving deaths involving alcohol: 38.8% — 518th highest of 3,081 counties
> Median household income: $60,908 — 696th highest of 3,106 counties
> Adults reporting poor or fair health: 15.7% — 660th lowest of 3,106 counties
[in-text-ad-2]
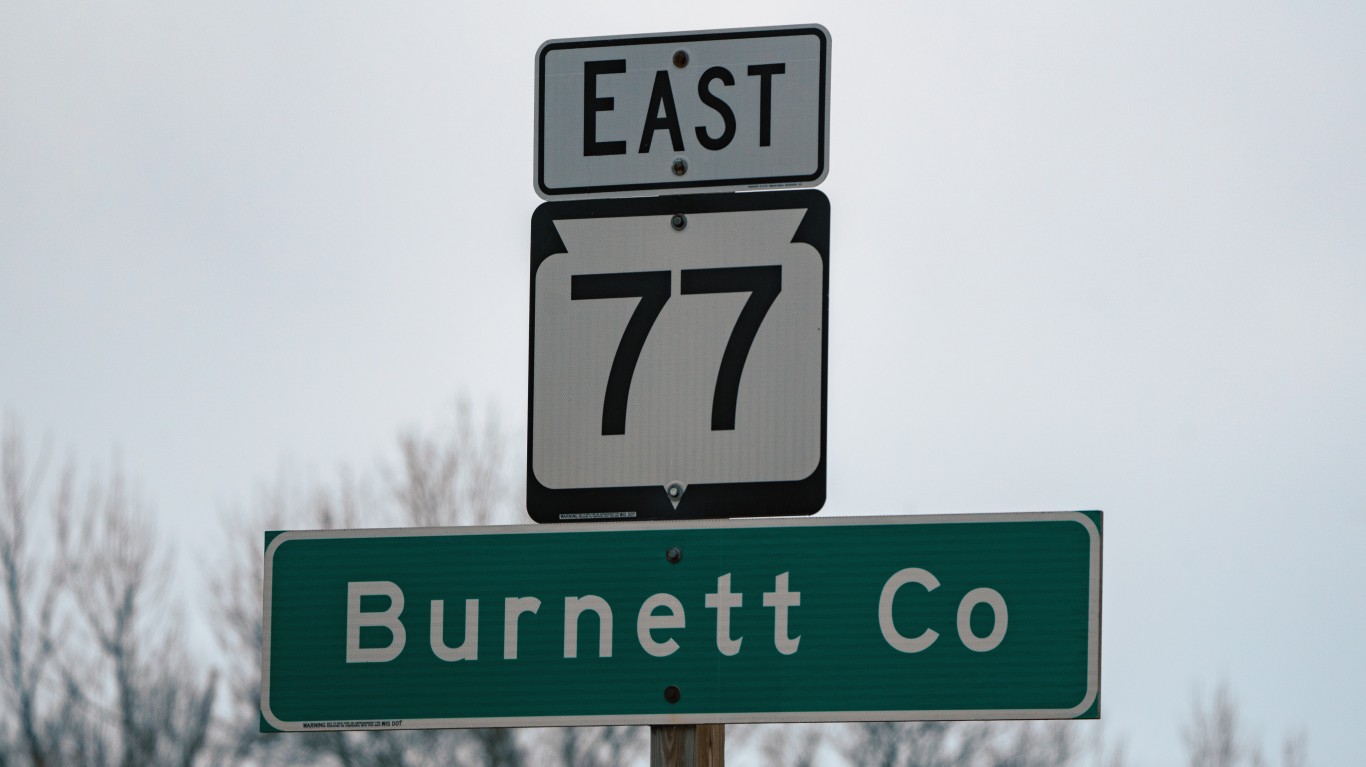
31. Burnett County, Wisconsin
> Adults binge or heavy drinking: 27.4%
> Driving deaths involving alcohol: 48.0% — 231st highest of 3,081 counties (tied)
> Median household income: $52,672 — 1,442nd highest of 3,106 counties
> Adults reporting poor or fair health: 16.4% — 829th lowest of 3,106 counties
30. Langlade County, Wisconsin
> Adults binge or heavy drinking: 27.4%
> Driving deaths involving alcohol: 50.0% — 140th highest of 3,081 counties (tied)
> Median household income: $49,491 — 1,288th lowest of 3,106 counties
> Adults reporting poor or fair health: 17.1% — 971st lowest of 3,106 counties
[in-text-ad]
29. Douglas County, Wisconsin
> Adults binge or heavy drinking: 27.5%
> Driving deaths involving alcohol: 23.5% — 1,201st lowest of 3,081 counties (tied)
> Median household income: $53,986 — 1,279th highest of 3,106 counties
> Adults reporting poor or fair health: 15.5% — 620th lowest of 3,106 counties
28. Jefferson County, Wisconsin
> Adults binge or heavy drinking: 27.5%
> Driving deaths involving alcohol: 45.7% — 264th highest of 3,081 counties (tied)
> Median household income: $66,291 — 419th highest of 3,106 counties
> Adults reporting poor or fair health: 14.7% — 458th lowest of 3,106 counties

27. Door County, Wisconsin
> Adults binge or heavy drinking: 27.5%
> Driving deaths involving alcohol: 22.7% — 1,127th lowest of 3,081 counties (tied)
> Median household income: $61,560 — 651st highest of 3,106 counties
> Adults reporting poor or fair health: 13.4% — 218th lowest of 3,106 counties
[in-text-ad-2]
26. Columbia County, Wisconsin
> Adults binge or heavy drinking: 27.6%
> Driving deaths involving alcohol: 29.3% — 1,253rd highest of 3,081 counties (tied)
> Median household income: $68,005 — 360th highest of 3,106 counties
> Adults reporting poor or fair health: 14.4% — 389th lowest of 3,106 counties
25. Dane County, Wisconsin
> Adults binge or heavy drinking: 27.6%
> Driving deaths involving alcohol: 34.3% — 777th highest of 3,081 counties
> Median household income: $73,893 — 243rd highest of 3,106 counties
> Adults reporting poor or fair health: 12.1% — 71st lowest of 3,106 counties
[in-text-ad]
24. Winnebago County, Wisconsin
> Adults binge or heavy drinking: 27.6%
> Driving deaths involving alcohol: 31.4% — 1,053rd highest of 3,081 counties (tied)
> Median household income: $58,543 — 867th highest of 3,106 counties
> Adults reporting poor or fair health: 15.2% — 552nd lowest of 3,106 counties

23. Sauk County, Wisconsin
> Adults binge or heavy drinking: 27.6%
> Driving deaths involving alcohol: 28.8% — 1,301st highest of 3,081 counties (tied)
> Median household income: $59,943 — 772nd highest of 3,106 counties
> Adults reporting poor or fair health: 15.4% — 599th lowest of 3,106 counties
22. Washington County, Wisconsin
> Adults binge or heavy drinking: 27.7%
> Driving deaths involving alcohol: 29.2% — 1,261st highest of 3,081 counties (tied)
> Median household income: $77,663 — 191st highest of 3,106 counties
> Adults reporting poor or fair health: 12.5% — 101st lowest of 3,106 counties
[in-text-ad-2]
21. Portage County, Wisconsin
> Adults binge or heavy drinking: 27.7%
> Driving deaths involving alcohol: 34.8% — 737th highest of 3,081 counties (tied)
> Median household income: $58,853 — 843rd highest of 3,106 counties
> Adults reporting poor or fair health: 14.6% — 438th lowest of 3,106 counties
20. St. Croix County, Wisconsin
> Adults binge or heavy drinking: 27.8%
> Driving deaths involving alcohol: 51.1% — 139th highest of 3,081 counties
> Median household income: $84,756 — 119th highest of 3,106 counties
> Adults reporting poor or fair health: 11.6% — 47th lowest of 3,106 counties
[in-text-ad]
19. Clinton County, Iowa
> Adults binge or heavy drinking: 27.8%
> Driving deaths involving alcohol: 30.0% — 1,159th highest of 3,081 counties (tied)
> Median household income: $51,688 — 1,545th lowest of 3,106 counties
> Adults reporting poor or fair health: 14.7% — 473rd lowest of 3,106 counties

18. Brown County, Wisconsin
> Adults binge or heavy drinking: 27.8%
> Driving deaths involving alcohol: 44.7% — 296th highest of 3,081 counties
> Median household income: $62,340 — 620th highest of 3,106 counties
> Adults reporting poor or fair health: 14.9% — 510th lowest of 3,106 counties

17. Sawyer County, Wisconsin
> Adults binge or heavy drinking: 27.8%
> Driving deaths involving alcohol: 69.2% — 39th highest of 3,081 counties (tied)
> Median household income: $47,714 — 1,122nd lowest of 3,106 counties
> Adults reporting poor or fair health: 18.8% — 1,363rd lowest of 3,106 counties
[in-text-ad-2]

16. Grant County, Wisconsin
> Adults binge or heavy drinking: 27.8%
> Driving deaths involving alcohol: 33.3% — 812th highest of 3,081 counties (tied)
> Median household income: $54,800 — 1,191st highest of 3,106 counties
> Adults reporting poor or fair health: 16.4% — 833rd lowest of 3,106 counties

15. Sheboygan County, Wisconsin
> Adults binge or heavy drinking: 27.9%
> Driving deaths involving alcohol: 31.5% — 1,041st highest of 3,081 counties (tied)
> Median household income: $60,696 — 710th highest of 3,106 counties
> Adults reporting poor or fair health: 14.5% — 412th lowest of 3,106 counties
[in-text-ad]

14. Dubuque County, Iowa
> Adults binge or heavy drinking: 28.1%
> Driving deaths involving alcohol: 15.6% — 547th lowest of 3,081 counties (tied)
> Median household income: $63,031 — 581st highest of 3,106 counties
> Adults reporting poor or fair health: 13.0% — 158th lowest of 3,106 counties
13. Ozaukee County, Wisconsin
> Adults binge or heavy drinking: 28.2%
> Driving deaths involving alcohol: 29.4% — 1,228th highest of 3,081 counties (tied)
> Median household income: $85,215 — 112th highest of 3,106 counties
> Adults reporting poor or fair health: 10.9% — 15th lowest of 3,106 counties
12. Winneshiek County, Iowa
> Adults binge or heavy drinking: 28.3%
> Driving deaths involving alcohol: 40.0% — 436th highest of 3,081 counties (tied)
> Median household income: $65,263 — 453rd highest of 3,106 counties
> Adults reporting poor or fair health: 11.4% — 35th lowest of 3,106 counties
[in-text-ad-2]
11. Iowa County, Wisconsin
> Adults binge or heavy drinking: 28.4%
> Driving deaths involving alcohol: 21.1% — 959th lowest of 3,081 counties (tied)
> Median household income: $64,124 — 509th highest of 3,106 counties
> Adults reporting poor or fair health: 13.9% — 292nd lowest of 3,106 counties

10. Manitowoc County, Wisconsin
> Adults binge or heavy drinking: 28.4%
> Driving deaths involving alcohol: 32.4% — 968th highest of 3,081 counties (tied)
> Median household income: $56,612 — 1,034th highest of 3,106 counties
> Adults reporting poor or fair health: 15.1% — 549th lowest of 3,106 counties
[in-text-ad]
9. Kewaunee County, Wisconsin
> Adults binge or heavy drinking: 28.5%
> Driving deaths involving alcohol: 50.0% — 140th highest of 3,081 counties (tied)
> Median household income: $66,192 — 423rd highest of 3,106 counties
> Adults reporting poor or fair health: 14.6% — 431st lowest of 3,106 counties

8. Waukesha County, Wisconsin
> Adults binge or heavy drinking: 28.6%
> Driving deaths involving alcohol: 33.0% — 946th highest of 3,081 counties
> Median household income: $87,277 — 94th highest of 3,106 counties
> Adults reporting poor or fair health: 11.3% — 32nd lowest of 3,106 counties
7. Pepin County, Wisconsin
> Adults binge or heavy drinking: 28.7%
> Driving deaths involving alcohol: 66.7% — 42nd highest of 3,081 counties (tied)
> Median household income: $54,583 — 1,213th highest of 3,106 counties (tied)
> Adults reporting poor or fair health: 16.3% — 787th lowest of 3,106 counties
[in-text-ad-2]
6. Dunn County, Wisconsin
> Adults binge or heavy drinking: 28.7%
> Driving deaths involving alcohol: 52.5% — 135th highest of 3,081 counties
> Median household income: $58,783 — 848th highest of 3,106 counties
> Adults reporting poor or fair health: 15.2% — 566th lowest of 3,106 counties
5. Polk County, Wisconsin
> Adults binge or heavy drinking: 28.8%
> Driving deaths involving alcohol: 36.4% — 637th highest of 3,081 counties (tied)
> Median household income: $59,994 — 769th highest of 3,106 counties
> Adults reporting poor or fair health: 15.3% — 582nd lowest of 3,106 counties
[in-text-ad]
4. Pierce County, Wisconsin
> Adults binge or heavy drinking: 28.9%
> Driving deaths involving alcohol: 57.7% — 96th highest of 3,081 counties
> Median household income: $72,323 — 264th highest of 3,106 counties
> Adults reporting poor or fair health: 13.8% — 275th lowest of 3,106 counties

3. Walworth County, Wisconsin
> Adults binge or heavy drinking: 29.3%
> Driving deaths involving alcohol: 35.8% — 677th highest of 3,081 counties
> Median household income: $63,776 — 532nd highest of 3,106 counties
> Adults reporting poor or fair health: 15.2% — 568th lowest of 3,106 counties
2. Calumet County, Wisconsin
> Adults binge or heavy drinking: 29.8%
> Driving deaths involving alcohol: 26.7% — 1,516th highest of 3,081 counties (tied)
> Median household income: $75,814 — 216th highest of 3,106 counties
> Adults reporting poor or fair health: 13.0% — 155th lowest of 3,106 counties
[in-text-ad-2]
1. Outagamie County, Wisconsin
> Adults binge or heavy drinking: 31.0%
> Driving deaths involving alcohol: 32.0% — 993rd highest of 3,081 counties (tied)
> Median household income: $65,572 — 436th highest of 3,106 counties
> Adults reporting poor or fair health: 13.7% — 259th lowest of 3,106 counties
Methodology
To identify the 50 drunkest U.S. counties, 24/7 Tempo reviewed excessive drinking rates data from County Health Rankings & Roadmaps. While the CHR report is from 2021, drinking rate figures published in the report are from 2018.
Of the 3,220 counties or county equivalents, 3,142 had boundaries that fell within one of the 50 states or the District of Columbia. Counties with a 2019 five-year population estimate from the U.S. Census Bureau of less than 1,000 were excluded.
The remaining 3,106 places were ranked based on the excessive drinking rate. Additional information on the share of driving deaths with alcohol involvement and the share of adults who report fair or poor health is also from the 2021 CHR. Median household income data are five-year estimates from the Census Bureau’s 2019 American Community Survey.
100 Million Americans Are Missing This Crucial Retirement Tool
The thought of burdening your family with a financial disaster is most Americans’ nightmare. However, recent studies show that over 100 million Americans still don’t have proper life insurance in the event they pass away.
Life insurance can bring peace of mind – ensuring your loved ones are safeguarded against unforeseen expenses and debts. With premiums often lower than expected and a variety of plans tailored to different life stages and health conditions, securing a policy is more accessible than ever.
A quick, no-obligation quote can provide valuable insight into what’s available and what might best suit your family’s needs. Life insurance is a simple step you can take today to help secure peace of mind for your loved ones tomorrow.
Click here to learn how to get a quote in just a few minutes.
Thank you for reading! Have some feedback for us?
Contact the 24/7 Wall St. editorial team.




 24/7 Wall St.







 24/7 Wall St.