The U.S. violent crime rate — an annual, population-adjusted measure of cases of rаpe, robbery, aggravated assault, and homicide — climbed by 5% in 2020. The increase was driven by a rise in aggravated assault and, most notably, a historic 29% surge in homicides that made 2020 the deadliest year in the United States since the mid-1990s.
Despite rising violence nationwide — and the largest single-year increase in homicides on record — many parts of the country remain relatively safe. In some major U.S. cities, violent crime rates are less than half the national rate.
Using data from the FBI’s 2020 Uniform Crime Report, 24/7 Wall St. identified America’s 50 safest metro areas. Metropolitan areas are ranked by the violent crime rate — specifically, the number of violent crimes reported for every 100,000 residents.
Among the metro areas on this list, violent crime rates range from 212 incidents per 100,000 people to 58 per 100,000. Meanwhile, the national violent crime rate stands at 399 per 100,000 people. The metro areas on this list span the country, though Wisconsin is home to seven, more than any other state, followed by Virginia and Washington, which are each home to five.
Potential explanations for lower levels of violence in these places are varied, though one may be relative financial security, as low-income communities in the U.S. are disproportionately burdened by crime.
One study found that individuals with family incomes of less than $15,000 annually are three times more likely to be victimized by crime than those with family incomes of $75,000 or more. In most metro areas on this list, the share of residents living on poverty-level income is lower than the 12.3% national poverty rate. Here is a look at the city hit hardest by extreme poverty in every state.
Click here to see America’s safest metro areas
Click here to read our detailed methodology

50. Walla Walla, WA
> Violent crimes per 100k people: 212.3
> Number of violent crimes: 129 — 4th lowest of 290 metros
> Murders reported in 2020: 1 — 9th lowest of 290 metros (tied)
> Poverty rate: 11.3% — 91st lowest of 290 metros
[in-text-ad]

49. Duluth, MN-WI
> Violent crimes per 100k people: 211.1
> Number of violent crimes: 607 — 101st lowest of 290 metros
> Murders reported in 2020: 5 — 62nd lowest of 290 metros (tied)
> Poverty rate: 12.4% — 132nd lowest of 290 metros
48. Jacksonville, NC
> Violent crimes per 100k people: 210.3
> Number of violent crimes: 419 — 66th lowest of 290 metros
> Murders reported in 2020: 4 — 48th lowest of 290 metros (tied)
> Poverty rate: 11.1% — 85th lowest of 290 metros
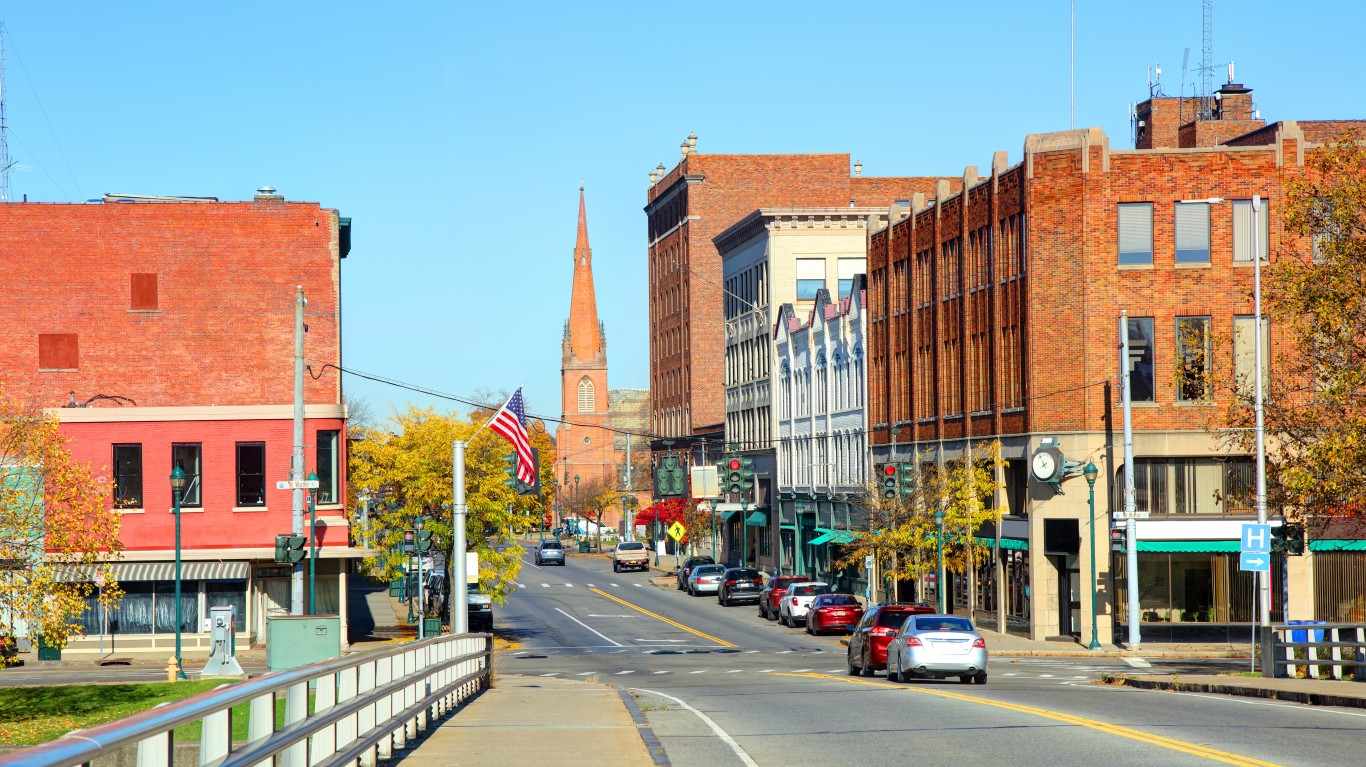
47. Elmira, NY
> Violent crimes per 100k people: 210.1
> Number of violent crimes: 173 — 11th lowest of 290 metros
> Murders reported in 2020: 3 — 31st lowest of 290 metros (tied)
> Poverty rate: 13.9% — 106th highest of 290 metros
[in-text-ad-2]

46. The Villages, FL
> Violent crimes per 100k people: 203.5
> Number of violent crimes: 279 — 40th lowest of 290 metros
> Murders reported in 2020: 3 — 31st lowest of 290 metros (tied)
> Poverty rate: 8.1% — 24th lowest of 290 metros

45. Madison, WI
> Violent crimes per 100k people: 201.7
> Number of violent crimes: 1,354 — 119th highest of 290 metros
> Murders reported in 2020: 17 — 124th highest of 290 metros (tied)
> Poverty rate: 8.9% — 39th lowest of 290 metros
[in-text-ad]

44. Coeur d’Alene, ID
> Violent crimes per 100k people: 201.5
> Number of violent crimes: 343 — 51st lowest of 290 metros
> Murders reported in 2020: 2 — 24th lowest of 290 metros (tied)
> Poverty rate: 10.0% — 53rd lowest of 290 metros

43. Oxnard-Thousand Oaks-Ventura, CA
> Violent crimes per 100k people: 200.7
> Number of violent crimes: 1,686 — 99th highest of 290 metros
> Murders reported in 2020: 20 — 112th highest of 290 metros (tied)
> Poverty rate: 7.9% — 21st lowest of 290 metros

42. Burlington-South Burlington, VT
> Violent crimes per 100k people: 198.4
> Number of violent crimes: 439 — 72nd lowest of 290 metros (tied)
> Murders reported in 2020: 5 — 62nd lowest of 290 metros (tied)
> Poverty rate: 11.4% — 100th lowest of 290 metros
[in-text-ad-2]
41. California-Lexington Park, MD
> Violent crimes per 100k people: 196.4
> Number of violent crimes: 224 — 25th lowest of 290 metros
> Murders reported in 2020: 8 — 98th lowest of 290 metros (tied)
> Poverty rate: 7.3% — 13th lowest of 290 metros
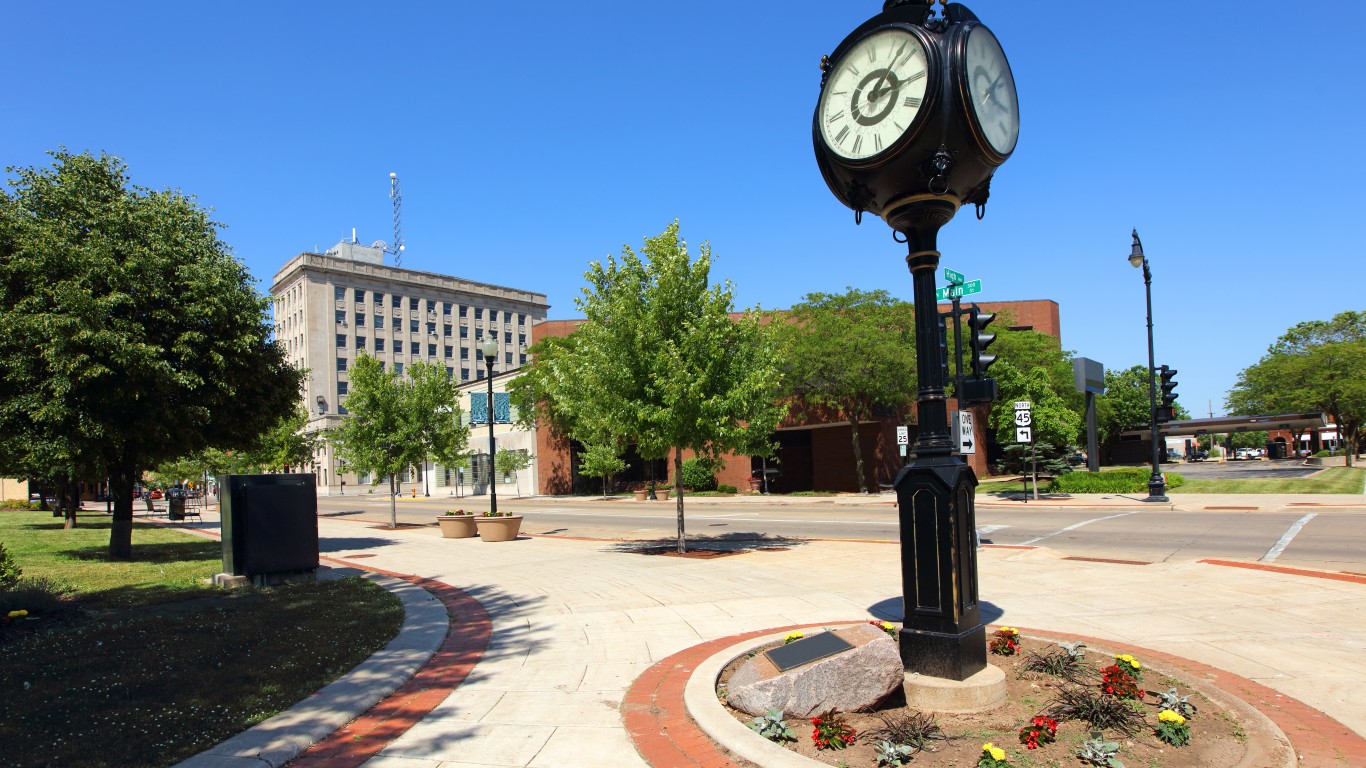
40. Oshkosh-Neenah, WI
> Violent crimes per 100k people: 192.7
> Number of violent crimes: 332 — 49th lowest of 290 metros
> Murders reported in 2020: 6 — 76th lowest of 290 metros (tied)
> Poverty rate: 10.0% — 55th lowest of 290 metros
[in-text-ad]

39. Eau Claire, WI
> Violent crimes per 100k people: 191.7
> Number of violent crimes: 326 — 47th lowest of 290 metros
> Murders reported in 2020: 3 — 31st lowest of 290 metros (tied)
> Poverty rate: 9.3% — 46th lowest of 290 metros

38. Charlottesville, VA
> Violent crimes per 100k people: 188.3
> Number of violent crimes: 415 — 64th lowest of 290 metros
> Murders reported in 2020: 13 — 140th lowest of 290 metros (tied)
> Poverty rate: 11.2% — 88th lowest of 290 metros
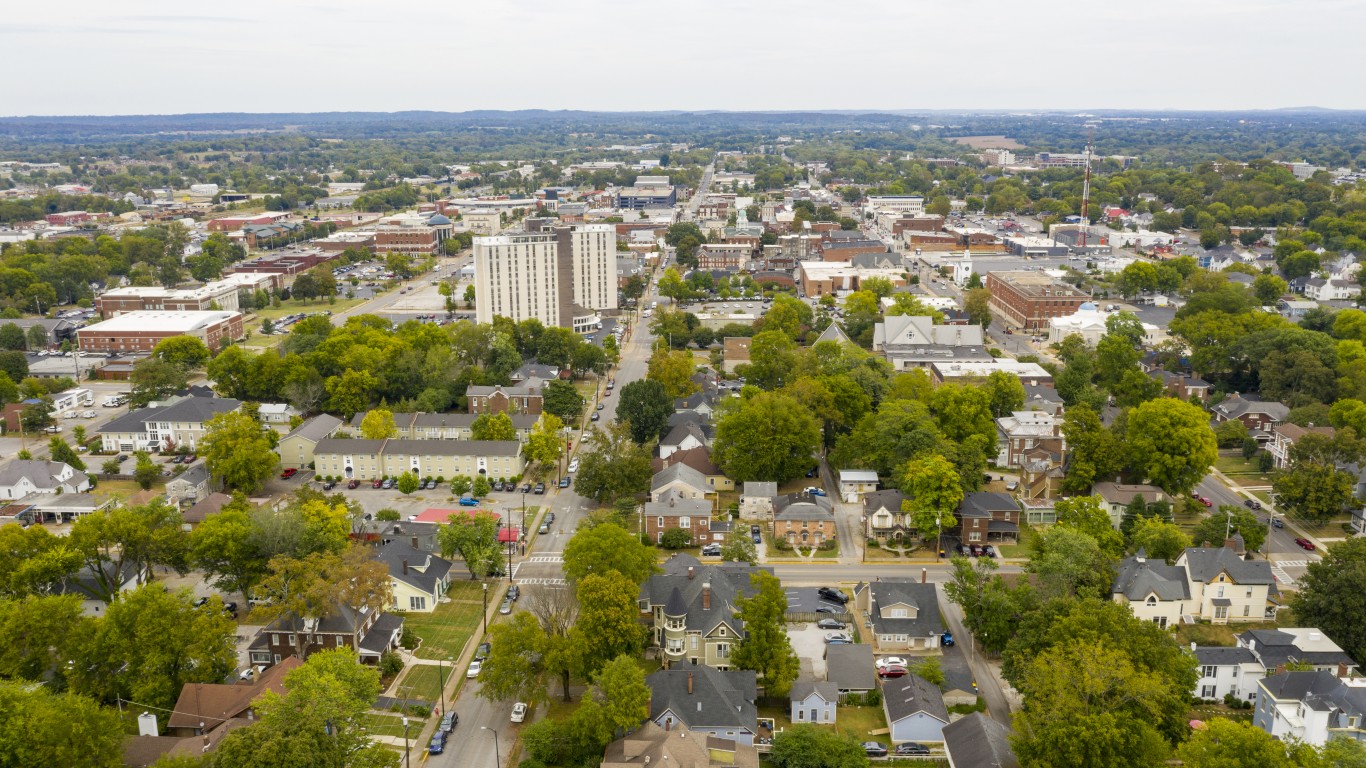
37. Bowling Green, KY
> Violent crimes per 100k people: 188.0
> Number of violent crimes: 341 — 50th lowest of 290 metros
> Murders reported in 2020: 11 — 127th lowest of 290 metros (tied)
> Poverty rate: 16.5% — 56th highest of 290 metros
[in-text-ad-2]

36. Rochester, MN
> Violent crimes per 100k people: 187.6
> Number of violent crimes: 418 — 65th lowest of 290 metros
> Murders reported in 2020: 6 — 76th lowest of 290 metros (tied)
> Poverty rate: 6.9% — 9th lowest of 290 metros

35. Longview, WA
> Violent crimes per 100k people: 187.1
> Number of violent crimes: 208 — 20th lowest of 290 metros
> Murders reported in 2020: 2 — 24th lowest of 290 metros (tied)
> Poverty rate: 12.2% — 126th lowest of 290 metros
[in-text-ad]

34. Mankato, MN
> Violent crimes per 100k people: 187.0
> Number of violent crimes: 191 — 14th lowest of 290 metros
> Murders reported in 2020: 1 — 9th lowest of 290 metros (tied)
> Poverty rate: 16.1% — 63rd highest of 290 metros

33. Staunton, VA
> Violent crimes per 100k people: 186.9
> Number of violent crimes: 231 — 28th lowest of 290 metros
> Murders reported in 2020: 4 — 48th lowest of 290 metros (tied)
> Poverty rate: 7.3% — 15th lowest of 290 metros
32. Blacksburg-Christiansburg, VA
> Violent crimes per 100k people: 186.4
> Number of violent crimes: 313 — 45th lowest of 290 metros (tied)
> Murders reported in 2020: 5 — 62nd lowest of 290 metros (tied)
> Poverty rate: 22.9% — 6th highest of 290 metros
[in-text-ad-2]

31. Bellingham, WA
> Violent crimes per 100k people: 184.7
> Number of violent crimes: 428 — 68th lowest of 290 metros
> Murders reported in 2020: 5 — 62nd lowest of 290 metros (tied)
> Poverty rate: 12.9% — 137th highest of 290 metros

30. Lewiston, ID-WA
> Violent crimes per 100k people: 184.4
> Number of violent crimes: 117 — 2nd lowest of 290 metros
> Murders reported in 2020: 3 — 31st lowest of 290 metros (tied)
> Poverty rate: 11.2% — 90th lowest of 290 metros
[in-text-ad]

29. Ames, IA
> Violent crimes per 100k people: 183.8
> Number of violent crimes: 228 — 27th lowest of 290 metros
> Murders reported in 2020: 1 — 9th lowest of 290 metros (tied)
> Poverty rate: 15.6% — 74th highest of 290 metros
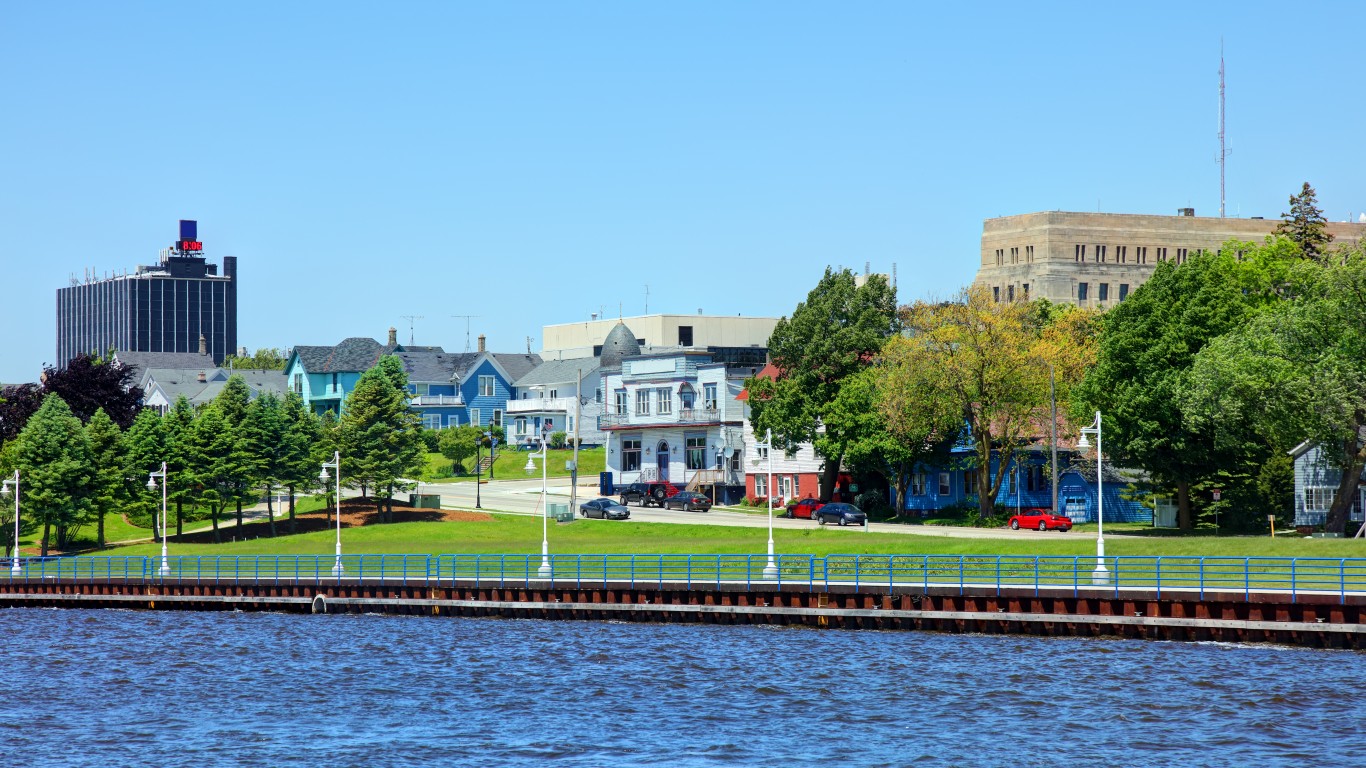
28. Sheboygan, WI
> Violent crimes per 100k people: 181.4
> Number of violent crimes: 209 — 21st lowest of 290 metros
> Murders reported in 2020: 1 — 9th lowest of 290 metros (tied)
> Poverty rate: 8.0% — 23rd lowest of 290 metros

27. Norwich-New London, CT
> Violent crimes per 100k people: 180.1
> Number of violent crimes: 313 — 45th lowest of 290 metros (tied)
> Murders reported in 2020: 4 — 48th lowest of 290 metros (tied)
> Poverty rate: 7.2% — 12th lowest of 290 metros
[in-text-ad-2]

26. Bend, OR
> Violent crimes per 100k people: 178.5
> Number of violent crimes: 360 — 53rd lowest of 290 metros
> Murders reported in 2020: 0 reported — the lowest of 290 metros (tied)
> Poverty rate: 9.7% — 47th lowest of 290 metros
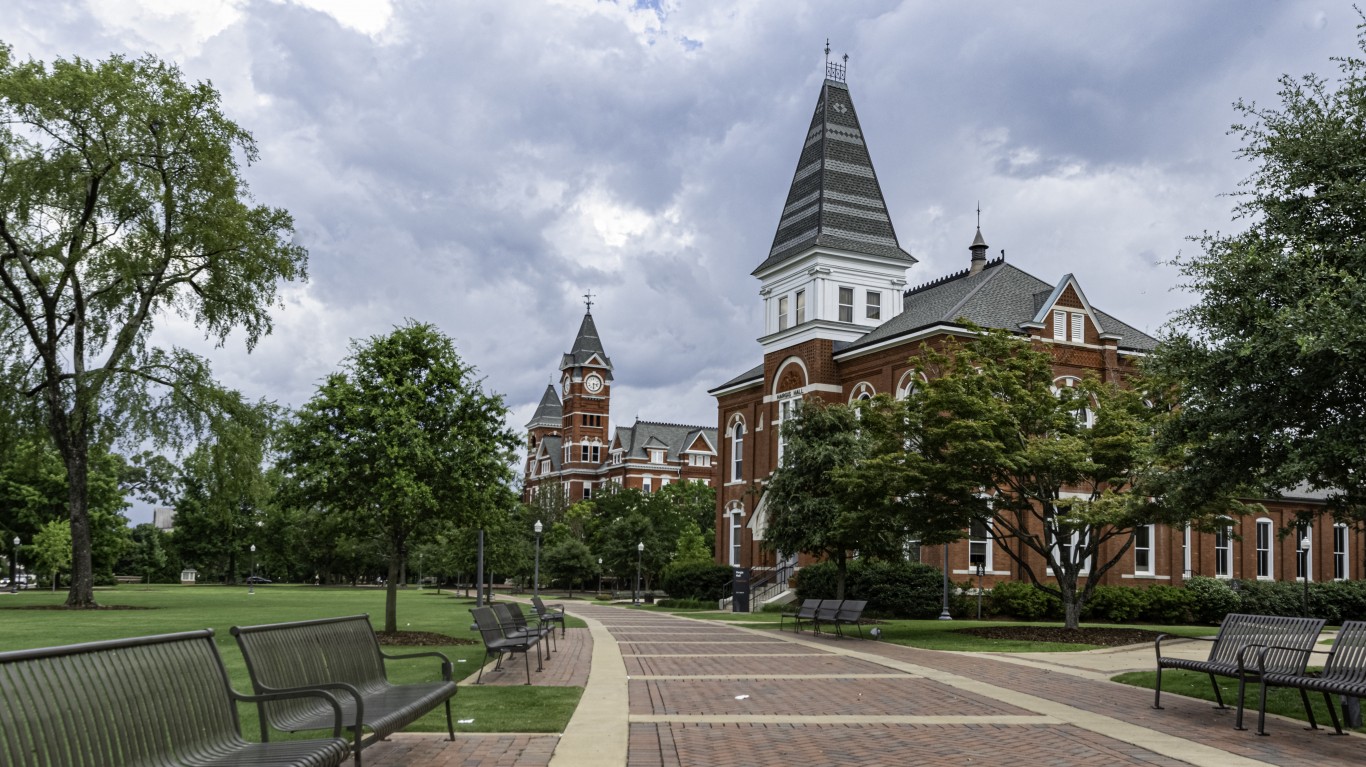
25. Lewiston-Auburn, ME
> Violent crimes per 100k people: 177.6
> Number of violent crimes: 193 — 16th lowest of 290 metros
> Murders reported in 2020: 4 — 48th lowest of 290 metros (tied)
> Poverty rate: 8.8% — 35th lowest of 290 metros
[in-text-ad]
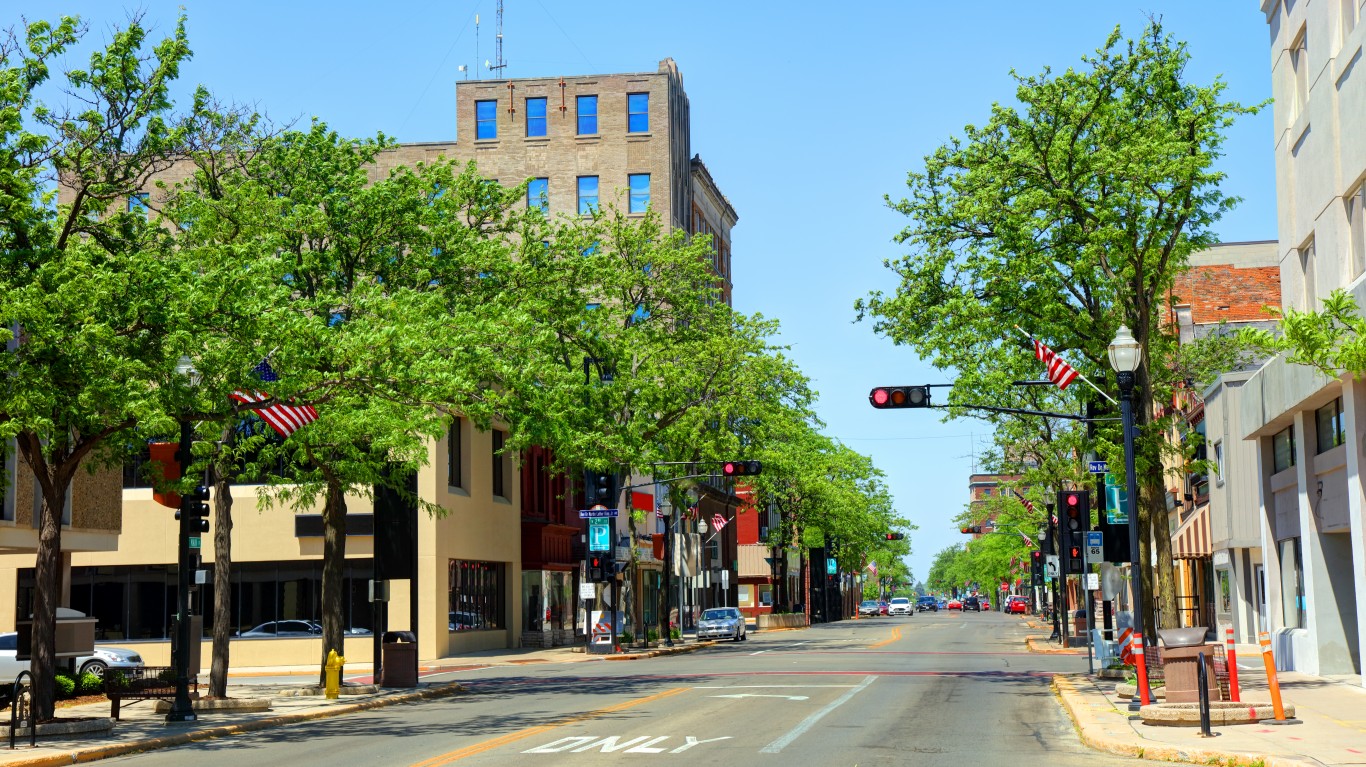
24. Fond du Lac, WI
> Violent crimes per 100k people: 174.9
> Number of violent crimes: 181 — 12th lowest of 290 metros
> Murders reported in 2020: 2 — 24th lowest of 290 metros (tied)
> Poverty rate: 6.2% — 5th lowest of 290 metros

23. Ogden-Clearfield, UT
> Violent crimes per 100k people: 172.9
> Number of violent crimes: 1,197 — 126th highest of 290 metros
> Murders reported in 2020: 14 — 135th highest of 290 metros (tied)
> Poverty rate: 5.6% — 2nd lowest of 290 metros

22. Appleton, WI
> Violent crimes per 100k people: 170.6
> Number of violent crimes: 408 — 63rd lowest of 290 metros
> Murders reported in 2020: 3 — 31st lowest of 290 metros (tied)
> Poverty rate: 7.2% — 11th lowest of 290 metros
[in-text-ad-2]
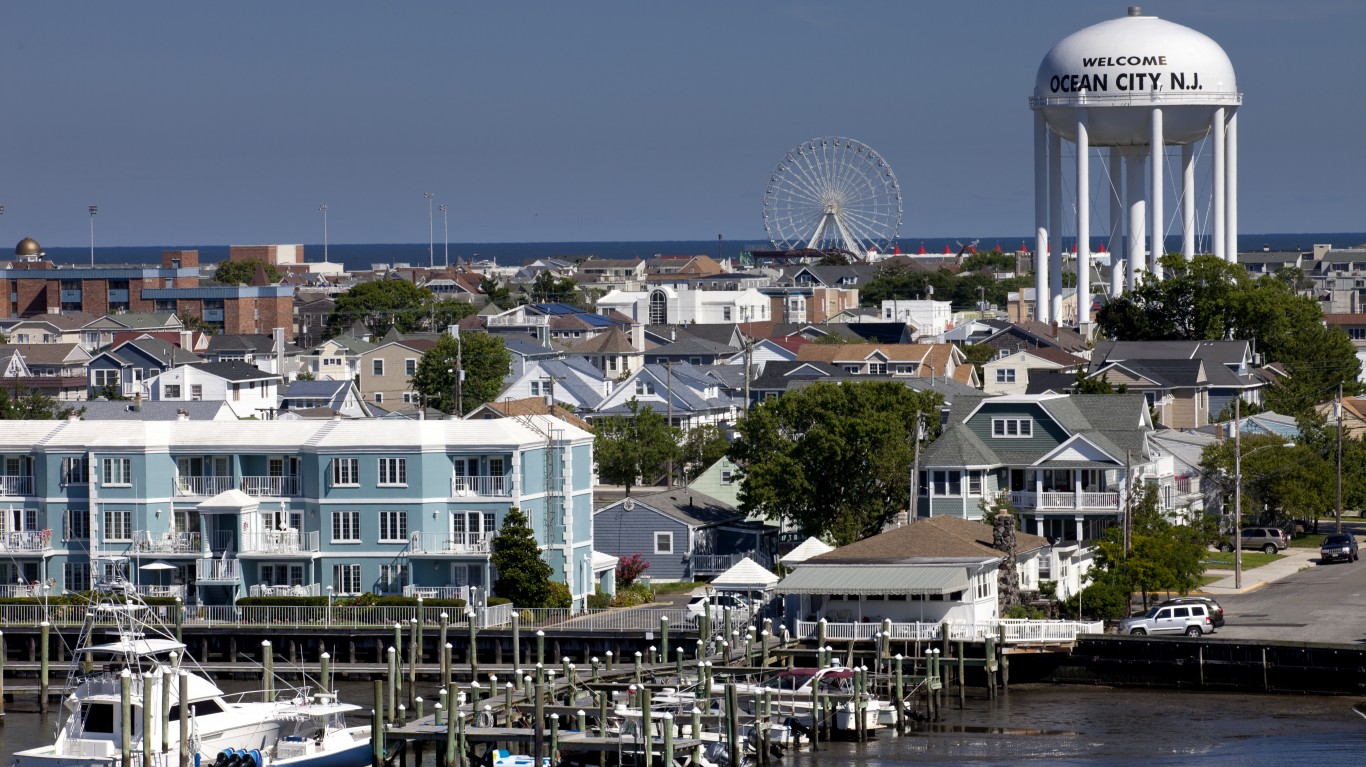
21. Ocean City, NJ
> Violent crimes per 100k people: 168.5
> Number of violent crimes: 154 — 6th lowest of 290 metros
> Murders reported in 2020: 0 reported — the lowest of 290 metros (tied)
> Poverty rate: 8.8% — 34th lowest of 290 metros

20. Jefferson City, MO
> Violent crimes per 100k people: 165.9
> Number of violent crimes: 251 — 31st lowest of 290 metros
> Murders reported in 2020: 4 — 48th lowest of 290 metros (tied)
> Poverty rate: 10.8% — 75th lowest of 290 metros
[in-text-ad]

19. Owensboro, KY
> Violent crimes per 100k people: 164.4
> Number of violent crimes: 197 — 18th lowest of 290 metros
> Murders reported in 2020: 6 — 76th lowest of 290 metros (tied)
> Poverty rate: 15.6% — 72nd highest of 290 metros

18. Bridgeport-Stamford-Norwalk, CT
> Violent crimes per 100k people: 163.9
> Number of violent crimes: 1,522 — 108th highest of 290 metros
> Murders reported in 2020: 40 — 66th highest of 290 metros (tied)
> Poverty rate: 9.1% — 40th lowest of 290 metros

17. St. George, UT
> Violent crimes per 100k people: 161.5
> Number of violent crimes: 294 — 42nd lowest of 290 metros
> Murders reported in 2020: 5 — 62nd lowest of 290 metros (tied)
> Poverty rate: 9.8% — 50th lowest of 290 metros
[in-text-ad-2]

16. Ithaca, NY
> Violent crimes per 100k people: 160.5
> Number of violent crimes: 163 — 9th lowest of 290 metros
> Murders reported in 2020: 0 reported — the lowest of 290 metros (tied)
> Poverty rate: 17.9% — 39th highest of 290 metros
15. La Crosse-Onalaska, WI-MN
> Violent crimes per 100k people: 155.8
> Number of violent crimes: 213 — 22nd lowest of 290 metros
> Murders reported in 2020: 1 — 9th lowest of 290 metros (tied)
> Poverty rate: 11.6% — 105th lowest of 290 metros
[in-text-ad]

14. Harrisonburg, VA
> Violent crimes per 100k people: 152.2
> Number of violent crimes: 207 — 19th lowest of 290 metros
> Murders reported in 2020: 5 — 62nd lowest of 290 metros (tied)
> Poverty rate: 14.4% — 94th highest of 290 metros
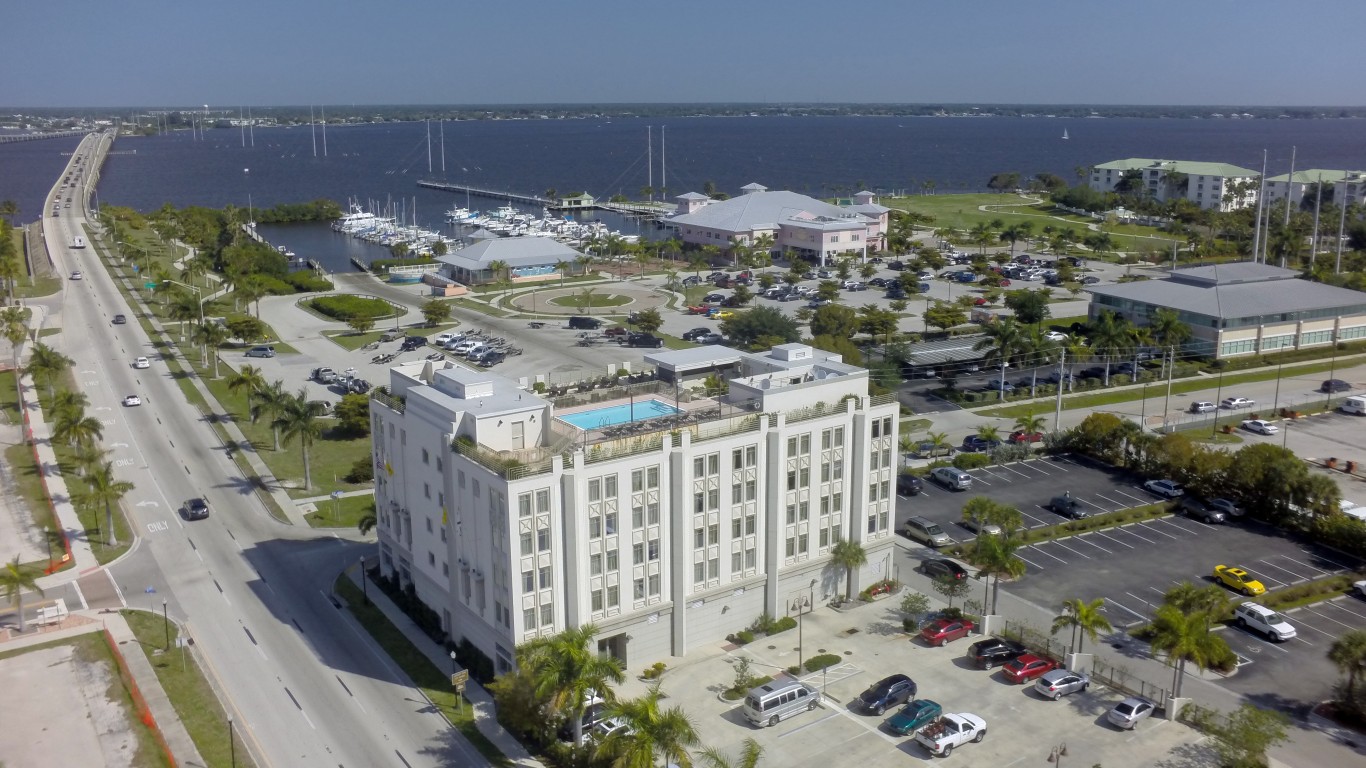
13. Punta Gorda, FL
> Violent crimes per 100k people: 152.2
> Number of violent crimes: 292 — 41st lowest of 290 metros
> Murders reported in 2020: 1 — 9th lowest of 290 metros (tied)
> Poverty rate: 12.0% — 118th lowest of 290 metros
12. Winchester, VA-WV
> Violent crimes per 100k people: 150.8
> Number of violent crimes: 214 — 23rd lowest of 290 metros
> Murders reported in 2020: 5 — 62nd lowest of 290 metros (tied)
> Poverty rate: 8.6% — 30th lowest of 290 metros
[in-text-ad-2]
11. Albany-Lebanon, OR
> Violent crimes per 100k people: 149.3
> Number of violent crimes: 195 — 17th lowest of 290 metros
> Murders reported in 2020: 7 — 89th lowest of 290 metros (tied)
> Poverty rate: 13.3% — 127th highest of 290 metros

10. Mount Vernon-Anacortes, WA
> Violent crimes per 100k people: 147.5
> Number of violent crimes: 192 — 15th lowest of 290 metros
> Murders reported in 2020: 2 — 24th lowest of 290 metros (tied)
> Poverty rate: 11.9% — 112th lowest of 290 metros
[in-text-ad]

9. Midland, MI
> Violent crimes per 100k people: 144.9
> Number of violent crimes: 120 — 3rd lowest of 290 metros
> Murders reported in 2020: 1 — 9th lowest of 290 metros (tied)
> Poverty rate: 9.3% — 45th lowest of 290 metros

8. Kingston, NY
> Violent crimes per 100k people: 139.8
> Number of violent crimes: 246 — 30th lowest of 290 metros
> Murders reported in 2020: 5 — 62nd lowest of 290 metros (tied)
> Poverty rate: 11.9% — 115th lowest of 290 metros

7. Sebastian-Vero Beach, FL
> Violent crimes per 100k people: 135.1
> Number of violent crimes: 219 — 24th lowest of 290 metros
> Murders reported in 2020: 3 — 31st lowest of 290 metros (tied)
> Poverty rate: 12.3% — 129th lowest of 290 metros
[in-text-ad-2]

6. Glens Falls, NY
> Violent crimes per 100k people: 125.9
> Number of violent crimes: 156 — 8th lowest of 290 metros
> Murders reported in 2020: 0 reported — the lowest of 290 metros (tied)
> Poverty rate: 10.8% — 78th lowest of 290 metros

5. Logan, UT-ID
> Violent crimes per 100k people: 118.2
> Number of violent crimes: 170 — 10th lowest of 290 metros
> Murders reported in 2020: 1 — 9th lowest of 290 metros (tied)
> Poverty rate: 14.7% — 89th highest of 290 metros
[in-text-ad]

4. Wenatchee, WA
> Violent crimes per 100k people: 116.2
> Number of violent crimes: 141 — 5th lowest of 290 metros
> Murders reported in 2020: 1 — 9th lowest of 290 metros (tied)
> Poverty rate: 13.0% — 135th highest of 290 metros
3. Elizabethtown-Fort Knox, KY
> Violent crimes per 100k people: 100.5
> Number of violent crimes: 155 — 7th lowest of 290 metros
> Murders reported in 2020: 5 — 62nd lowest of 290 metros (tied)
> Poverty rate: 11.1% — 87th lowest of 290 metros
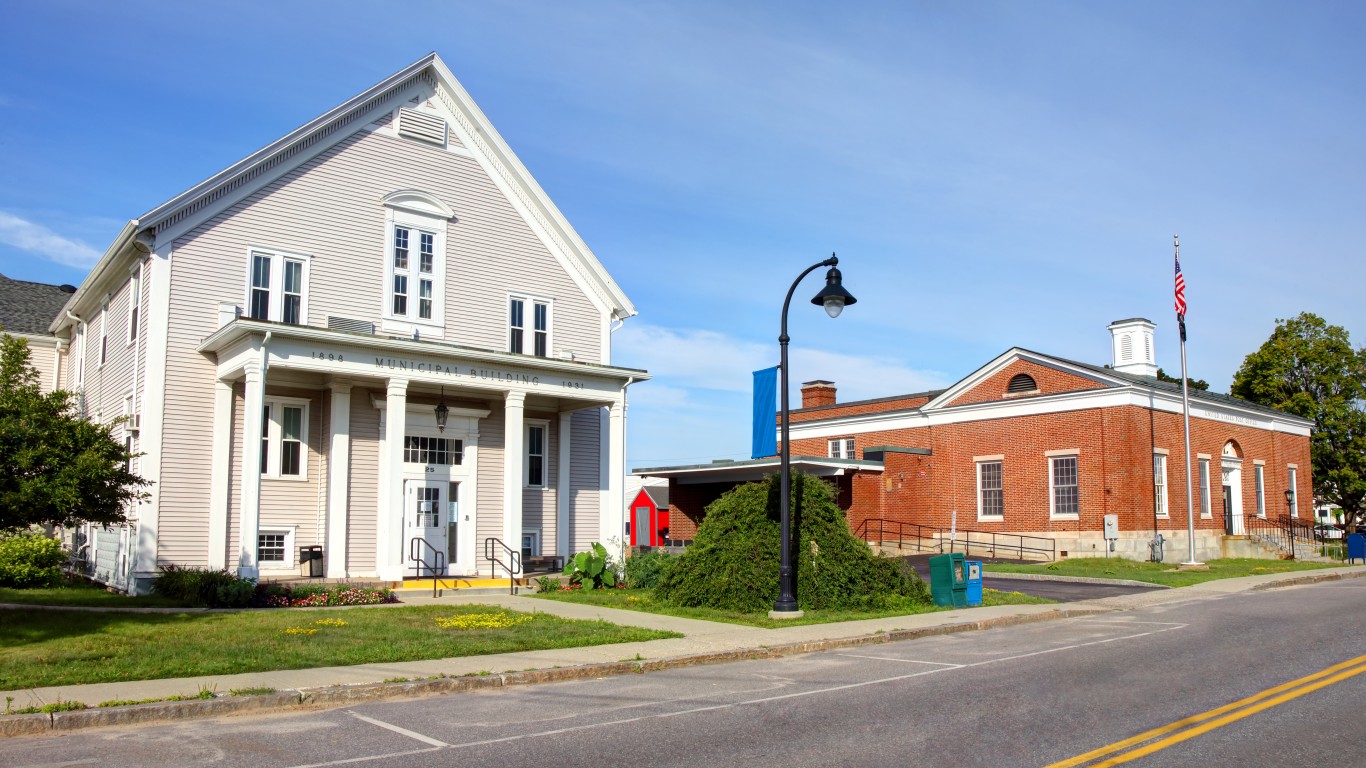
2. Portland-South Portland, ME
> Violent crimes per 100k people: 95.0
> Number of violent crimes: 516 — 84th lowest of 290 metros
> Murders reported in 2020: 1 — 9th lowest of 290 metros (tied)
> Poverty rate: 7.7% — 16th lowest of 290 metros
[in-text-ad-2]

1. Bangor, ME
> Violent crimes per 100k people: 57.7
> Number of violent crimes: 88 — the lowest of 290 metros
> Murders reported in 2020: 6 — 76th lowest of 290 metros (tied)
> Poverty rate: 12.1% — 123rd lowest of 290 metros
To determine the safest U.S. metro areas, 24/7 Wall St. reviewed violent crime figures from the FBI’s 2020 Uniform Crime Report. Violent crime includes murder, non-negligent manslaughter, rаpe, robbery, and aggravated assault. Rates of violent crimes per 100,000 people were calculated using population data from the FBI.
Limited data was available in the 2020 UCR for areas in Alabama, Maryland, Pennsylvania, and Illinois, though metros in these states were not excluded from analysis. Only metro areas for which the boundaries defined by the FBI match the boundaries as defined by the U.S. Census Bureau were considered.
Poverty rates are one-year estimates from the 2019 ACS.
Thank you for reading! Have some feedback for us?
Contact the 24/7 Wall St. editorial team.
 24/7 Wall St.
 24/7 Wall St.