
Ohio’s violent crime rate mirrored that of the nation as a whole in 2020. Violent offenses — a broad category encompassing rаpe, robbery, aggravated assault, and homicide — increased by 5.6% nationwide over 2019, according to the FBI, with a total of 1.3 million violent offenses reported. In the Buckeye State, violent crimes totaled 36,104, a 5.3% jump and a ratio of 309 for every 100,000 people. Does that make Ohio one of America’s most dangerous states?
To determine the 25 most dangerous cities in Ohio, 24/7 Wall St. reviewed data on violent crimes from the FBI’s Crime Data Explorer. Cities and towns with a population of at least 2,500 were ranked based on the number of violent crimes reported in 2020 per 100,000 residents. Data on population and property crimes also came from the FBI. Supplemental data on median household income and poverty rate came from the U.S. Census Bureau’s 2019 American Community Survey and are five-year estimates. (Nationwide, these are America’s 50 most dangerous cities.)
Click here to see the 25 most dangerous cities in Ohio
When ranking the most dangerous Ohio cities, three major metropolises took the top three spots. Cleveland, with a population of nearly 380,000, placed No. 1. The lakeside city registered 6,281 violent crimes in 2020, factoring out to 1,656.7 per 100,000 residents. Property offenses — burglary, larceny-theft, motor vehicle theft, and arson — totaled 15,433, equating to a ratio of 4,070.7 per 100,000 residents.
Next up was Canton. Property crimes in the town of 70,000 south of Cleveland reached 3,411 for a ratio of 4,864.2 per 100,000 residents. Violent crime was lower at 1,002 in total — a ratio of 1,428.9 per 100,000 residents.
Third place was taken by Dayton, a city of 140,00 in western Ohio, north of Cincinnati. There, violent crime totaled 1,523 for a ratio of 1,086 per 100,000 residents. Property crime was higher at 5,391 in total, which equates to 3,845.4 per 100,000 residents.
Yet the state’s most populous city — Columbus, the state capital, with nearly 912,000 residents — ranked 15th on this list. The city recorded 5,064 violent offenses for a ratio of 555.5 per 100,000 residents. Property crimes amounted to 28,530, factoring to 3,130.4 per 100,000 residents.
25. Reynoldsburg
> Violent crimes in 2020: 354.9 per 100,000 (137 total)
> Property crimes in 2020: 2,461.1 per 100,000 (950 total)
> Median household income: $67,120
> Poverty rate: 4.4%
> Population: 38,600
[in-text-ad]
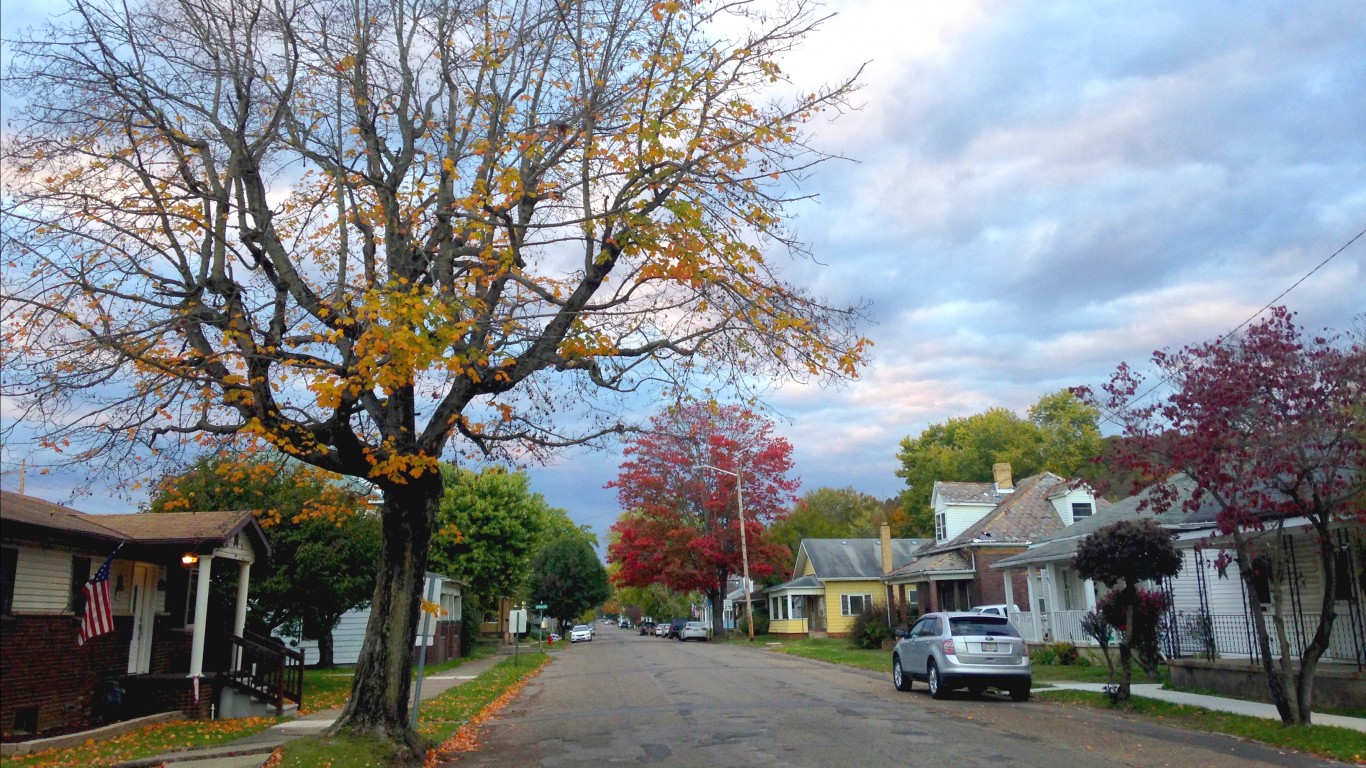
24. Nelsonville
> Violent crimes in 2020: 372.4 per 100,000 (19 total)
> Property crimes in 2020: 3,234.0 per 100,000 (165 total)
> Median household income: $28,886
> Poverty rate: 13.0%
> Population: 5,102
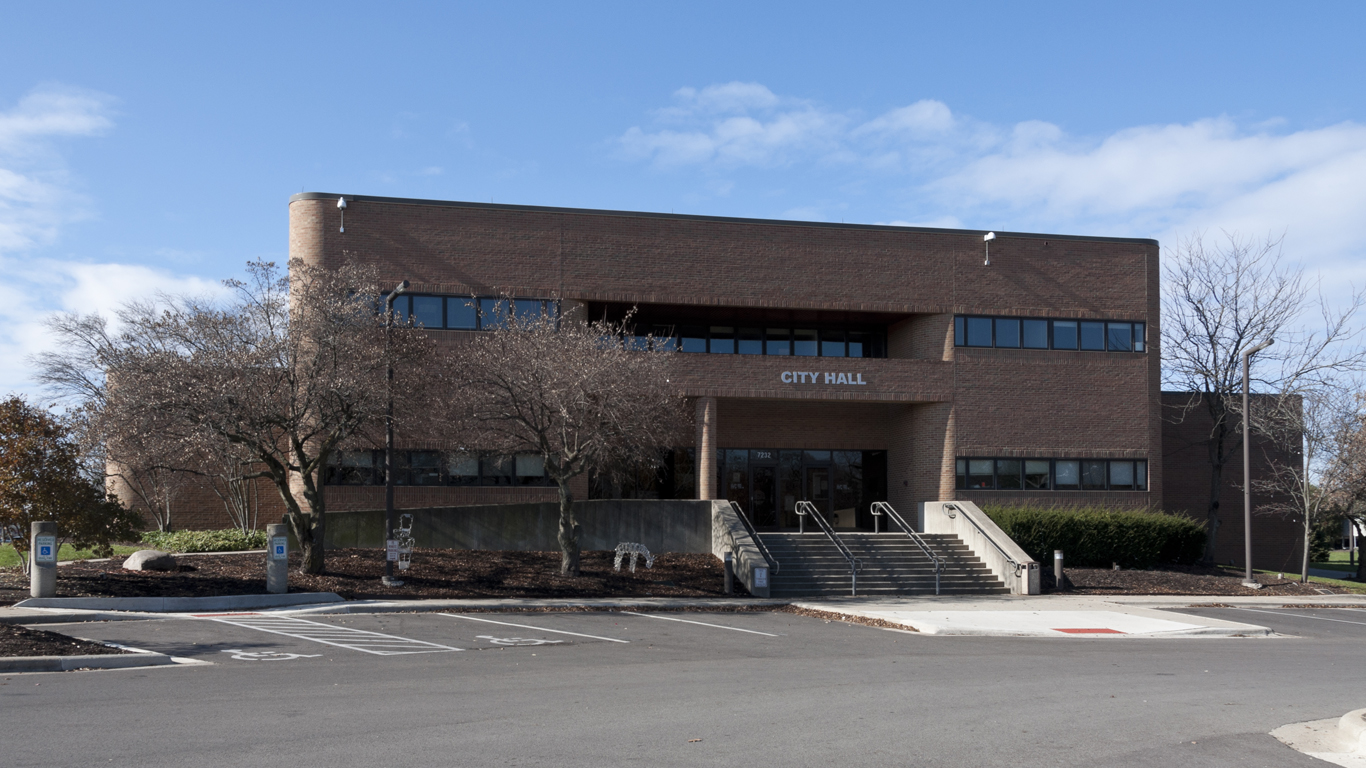
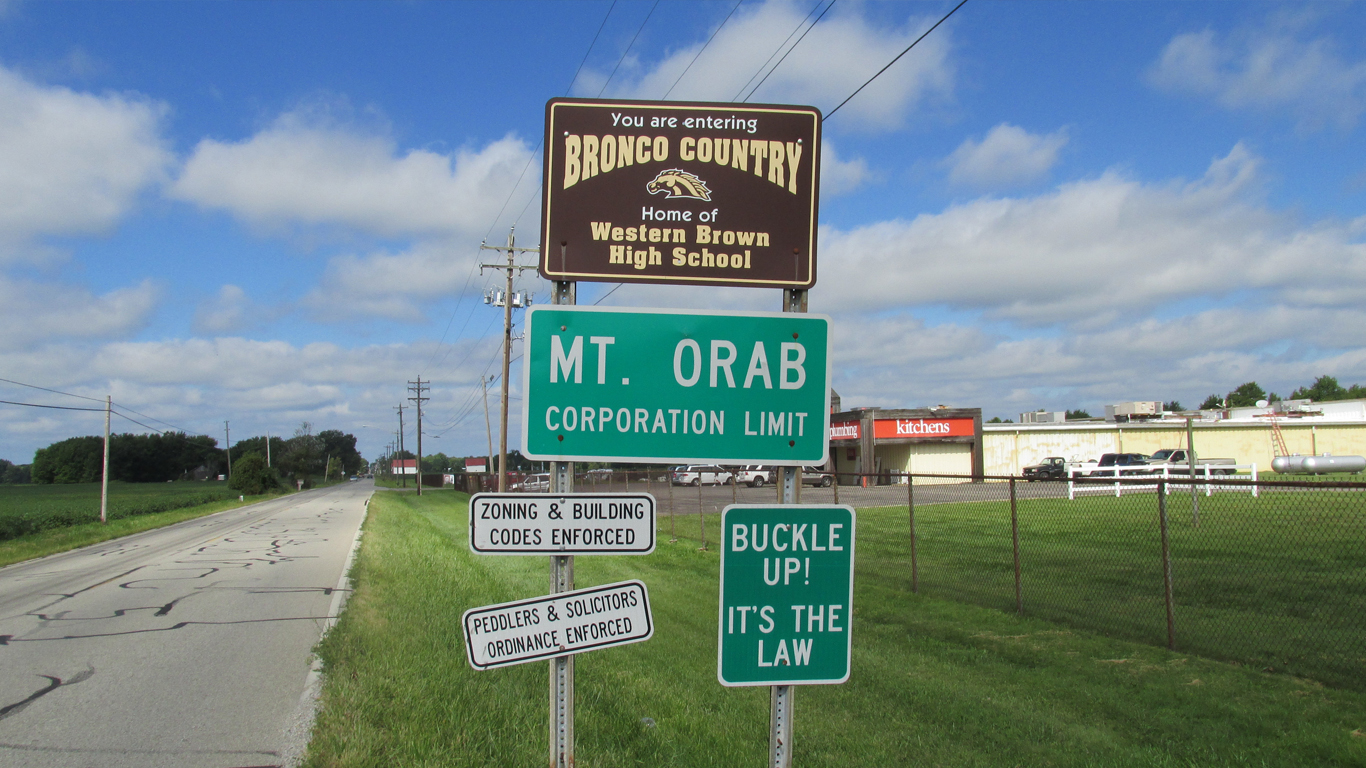
23. Mount Orab
> Violent crimes in 2020: 380.3 per 100,000 (13 total)
> Property crimes in 2020: 1,579.9 per 100,000 (54 total)
> Median household income: $73,040
> Poverty rate: 8.4%
> Population: 3,418

22. Newton Falls
> Violent crimes in 2020: 382.7 per 100,000 (17 total)
> Property crimes in 2020: 945.5 per 100,000 (42 total)
> Median household income: $41,534
> Poverty rate: 7.3%
> Population: 4,442
[in-text-ad-2]
21. Montpelier
> Violent crimes in 2020: 409.2 per 100,000 (16 total)
> Property crimes in 2020: 3,529.4 per 100,000 (138 total)
> Median household income: $54,489
> Poverty rate: 11.1%
> Population: 3,910
20. Warren
> Violent crimes in 2020: 449.8 per 100,000 (173 total)
> Property crimes in 2020: 2,789.8 per 100,000 (1,073 total)
> Median household income: $28,898
> Poverty rate: 6.5%
> Population: 38,462
[in-text-ad]
19. Sidney
> Violent crimes in 2020: 490.9 per 100,000 (100 total)
> Property crimes in 2020: 2,891.2 per 100,000 (589 total)
> Median household income: $53,505
> Poverty rate: 4.2%
> Population: 20,372
18. Springdale
> Violent crimes in 2020: 492.8 per 100,000 (55 total)
> Property crimes in 2020: 2,858.4 per 100,000 (319 total)
> Median household income: $56,789
> Poverty rate: 6.0%
> Population: 11,160
17. Lorain
> Violent crimes in 2020: 506.0 per 100,000 (323 total)
> Property crimes in 2020: 2,365.6 per 100,000 (1,510 total)
> Median household income: $38,291
> Poverty rate: 2.5%
> Population: 63,831
[in-text-ad-2]
16. Euclid
> Violent crimes in 2020: 518.7 per 100,000 (240 total)
> Property crimes in 2020: 2,867.8 per 100,000 (1,327 total)
> Median household income: $38,242
> Poverty rate: 3.0%
> Population: 46,272

15. Columbus
> Violent crimes in 2020: 555.6 per 100,000 (5,064 total)
> Property crimes in 2020: 3,130.4 per 100,000 (28,530 total)
> Median household income: $53,745
> Poverty rate: 0.7%
> Population: 911,383
[in-text-ad]
14. Maple Heights
> Violent crimes in 2020: 569.4 per 100,000 (125 total)
> Property crimes in 2020: 847.3 per 100,000 (186 total)
> Median household income: $42,805
> Poverty rate: 4.2%
> Population: 21,953
13. Springfield
> Violent crimes in 2020: 575.8 per 100,000 (338 total)
> Property crimes in 2020: 5,134.9 per 100,000 (3,014 total)
> Median household income: $39,332
> Poverty rate: 2.2%
> Population: 58,696
12. Trotwood
> Violent crimes in 2020: 647.6 per 100,000 (158 total)
> Property crimes in 2020: 2,438.6 per 100,000 (595 total)
> Median household income: $36,778
> Poverty rate: 6.0%
> Population: 24,399
[in-text-ad-2]
11. Moraine
> Violent crimes in 2020: 663.8 per 100,000 (43 total)
> Property crimes in 2020: 6,607.0 per 100,000 (428 total)
> Median household income: $45,714
> Poverty rate: 11.7%
> Population: 6,478

10. Portsmouth
> Violent crimes in 2020: 694.8 per 100,000 (140 total)
> Property crimes in 2020: 4,664.8 per 100,000 (940 total)
> Median household income: $28,840
> Poverty rate: 5.4%
> Population: 20,151
[in-text-ad]
9. Lockland
> Violent crimes in 2020: 697.7 per 100,000 (24 total)
> Property crimes in 2020: 1,337.2 per 100,000 (46 total)
> Median household income: $28,542
> Poverty rate: 13.7%
> Population: 3,440
8. Whitehall
> Violent crimes in 2020: 825.7 per 100,000 (157 total)
> Property crimes in 2020: 4,428.3 per 100,000 (842 total)
> Median household income: $42,526
> Poverty rate: 4.3%
> Population: 19,014

7. Cincinnati
> Violent crimes in 2020: 892.9 per 100,000 (2,721 total)
> Property crimes in 2020: 3,683.3 per 100,000 (11,224 total)
> Median household income: $40,640
> Poverty rate: 1.3%
> Population: 304,724
[in-text-ad-2]

6. Akron
> Violent crimes in 2020: 910.2 per 100,000 (1,797 total)
> Property crimes in 2020: 3,530.8 per 100,000 (6,971 total)
> Median household income: $38,739
> Poverty rate: 1.3%
> Population: 197,433

5. Toledo
> Violent crimes in 2020: 1,006.1 per 100,000 (2,729 total)
> Property crimes in 2020: 2,893.8 per 100,000 (7,849 total)
> Median household income: $37,752
> Poverty rate: 1.4%
> Population: 271,237
[in-text-ad]
4. Mount Healthy
> Violent crimes in 2020: 1,040.3 per 100,000 (70 total)
> Property crimes in 2020: 3,819.3 per 100,000 (257 total)
> Median household income: $35,743
> Poverty rate: 9.5%
> Population: 6,729

3. Dayton
> Violent crimes in 2020: 1,086.4 per 100,000 (1,523 total)
> Property crimes in 2020: 3,845.4 per 100,000 (5,391 total)
> Median household income: $32,540
> Poverty rate: 2.3%
> Population: 140,193

2. Canton
> Violent crimes in 2020: 1,428.9 per 100,000 (1,002 total)
> Property crimes in 2020: 4,864.2 per 100,000 (3,411 total)
> Median household income: $32,287
> Poverty rate: 2.4%
> Population: 70,124
[in-text-ad-2]

1. Cleveland
> Violent crimes in 2020: 1,656.7 per 100,000 (6,281 total)
> Property crimes in 2020: 4,070.7 per 100,000 (15,433 total)
> Median household income: $30,907
> Poverty rate: 1.0%
> Population: 379,121
Take Charge of Your Retirement In Just A Few Minutes (Sponsor)
Retirement planning doesn’t have to feel overwhelming. The key is finding expert guidance—and SmartAsset’s simple quiz makes it easier than ever for you to connect with a vetted financial advisor.
Here’s how it works:
- Answer a Few Simple Questions. Tell us a bit about your goals and preferences—it only takes a few minutes!
- Get Matched with Vetted Advisors Our smart tool matches you with up to three pre-screened, vetted advisors who serve your area and are held to a fiduciary standard to act in your best interests. Click here to begin
- Choose Your Fit Review their profiles, schedule an introductory call (or meet in person), and select the advisor who feel is right for you.
Why wait? Start building the retirement you’ve always dreamed of. Click here to get started today!
Thank you for reading! Have some feedback for us?
Contact the 24/7 Wall St. editorial team.
 24/7 Wall St.










 24/7 Wall St.


