The United States has some of the highest levels of income and wealth inequality in the world. U.S. Federal Reserve data shows that the wealthiest 10% of Americans control $93.8 trillion, more than double the $40.3 trillion in the hands of the remaining 90% of Americans.
The income and wealth divide only appears to be growing wider. A January 2020 report published by the Pew Research Center found that over the last four decades, income growth for the top 5% of families by earnings has far outpaced income growth for families in lower income strata.
While in a nation as large as the U.S. high levels of income inequality may be expected, there are small pockets of the country in which extreme wealth and extreme poverty exist side by side. Even at the ZIP code level, income inequality can be far more pronounced than it is on average nationwide.
Using data from the U.S. Census Bureau’s 2019 American Community Survey, 24/7 Wall St. identified the 50 U.S. ZIP codes with the widest income gaps. ZIP codes are ranked by their Gini coefficient, a measure of income inequality based on the distribution of income across a population on a 0 to 1 scale — 0 representing perfect equality and 1 representing the highest possible level of inequality.
Among the ZIP codes on this list, Gini scores are as high as 0.740 — well above the national Gini coefficient of 0.482. The places on this list span the country but tend to be concentrated in the South. However, California is home to seven ZIP codes on this list, the most of any state.
Causes behind rising inequality are complex and varied. A report published by the National Bureau of Economic Research ties the rising disparity to a range of economic factors, including globalization, technological advancement, a stagnant minimum wage, and the decline of labor unions.
Click here to see America’s zip codes with the widest income gaps
Click here to read our detailed methodology
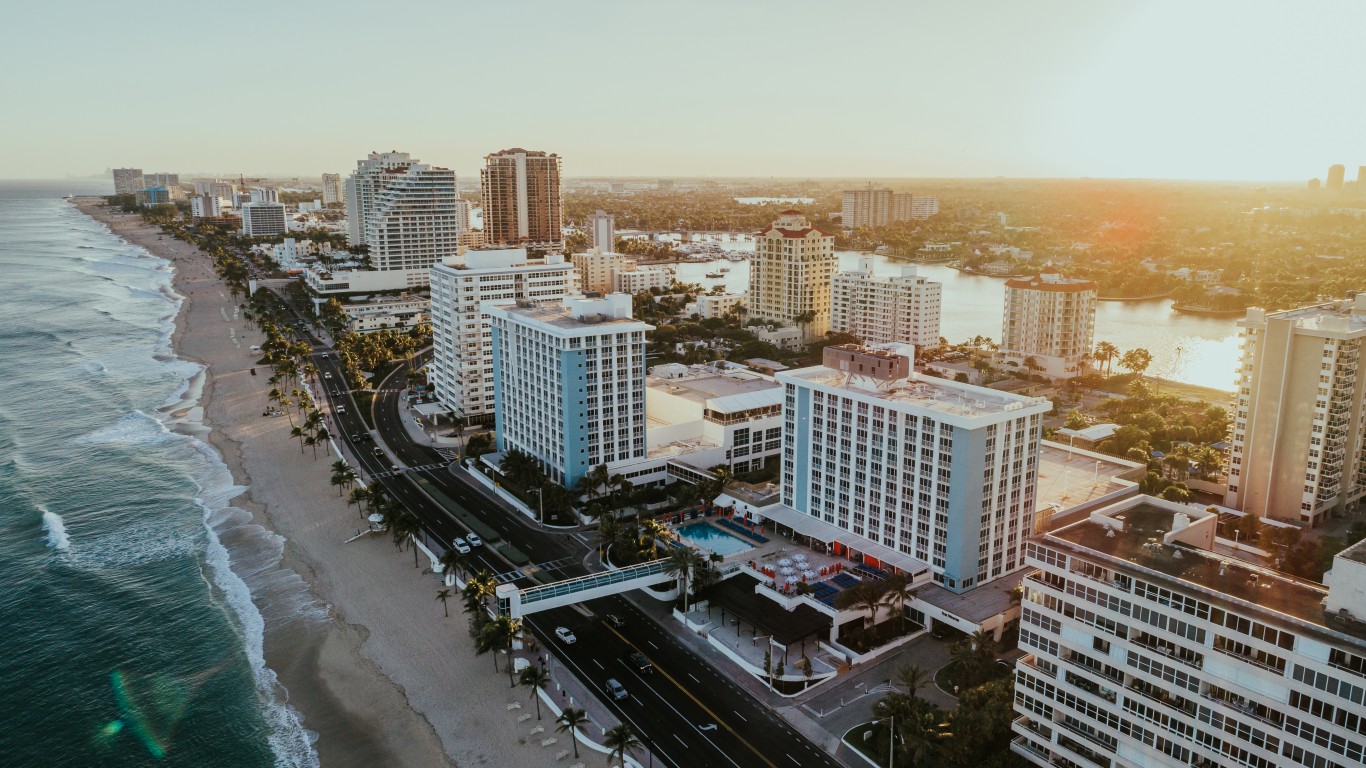
50. 33316
> Location: Fort Lauderdale, Florida
> Gini index: 0.614
> Avg. household income, top 20%: $461,798 — 468th highest of 16,708 zip codes
> Avg. household income, bottom 20%: $13,279 — 6,400th lowest of 16,708 zip codes (tied)
> Share of all income in 33316 that went to top 20%: 65.4% — 29th highest of 16,708 zip codes
> Share of all income in 33316 that went to bottom 20%: 1.9% — 356th lowest of 16,708 zip codes (tied)
> Median household income: $67,477 — 6,196th highest of 16,741 zip codes
[in-text-ad]

49. 48208
> Location: Detroit, Michigan
> Gini index: 0.614
> Avg. household income, top 20%: $130,913 — 2,384th lowest of 16,708 zip codes
> Avg. household income, bottom 20%: $2,273 — 38th lowest of 16,708 zip codes
> Share of all income in 48208 that went to top 20%: 64.5% — 49th highest of 16,708 zip codes
> Share of all income in 48208 that went to bottom 20%: 1.1% — 69th lowest of 16,708 zip codes (tied)
> Median household income: $20,364 — 46th lowest of 16,741 zip codes
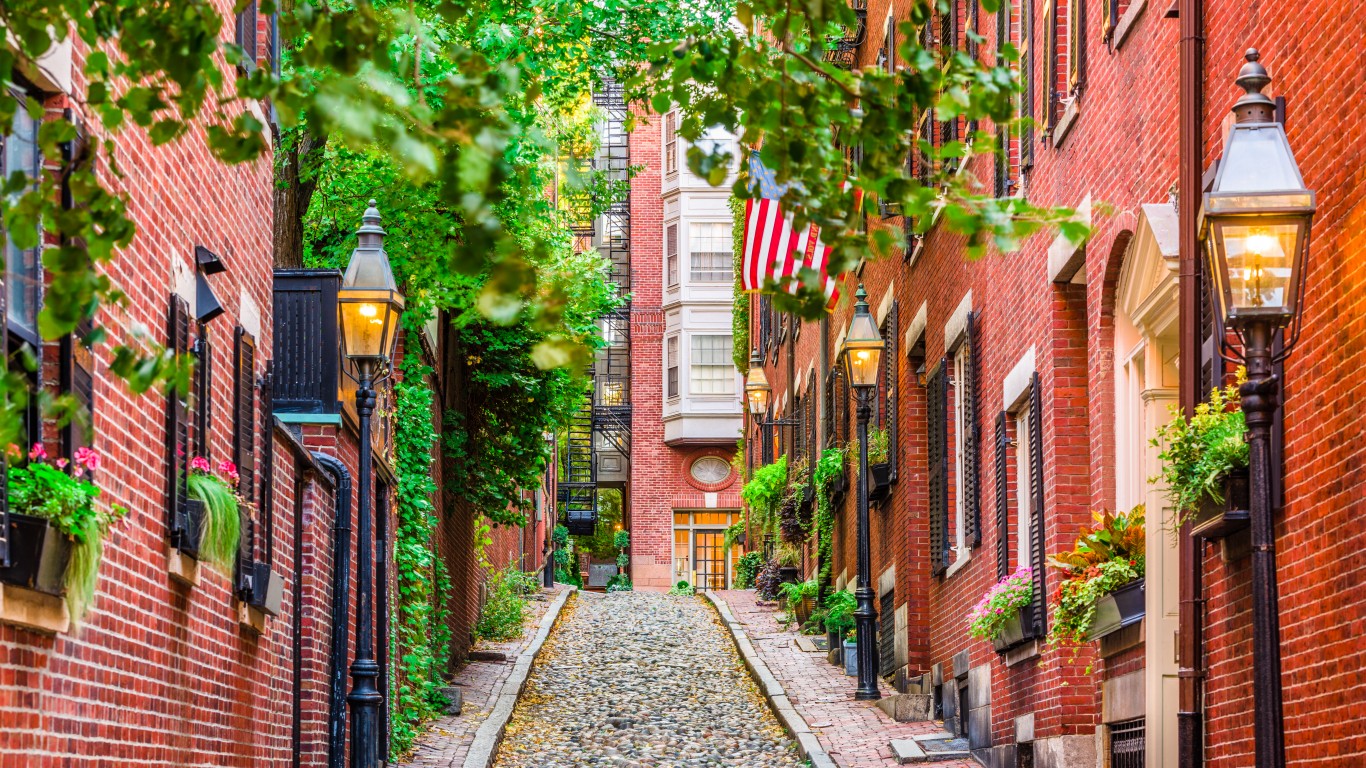
48. 02118
> Location: Boston, Massachusetts
> Gini index: 0.615
> Avg. household income, top 20%: $433,598 — 569th highest of 16,708 zip codes
> Avg. household income, bottom 20%: $7,219 — 1,068th lowest of 16,708 zip codes (tied)
> Share of all income in 02118 that went to top 20%: 62.7% — 88th highest of 16,708 zip codes
> Share of all income in 02118 that went to bottom 20%: 1.0% — 56th lowest of 16,708 zip codes (tied)
> Median household income: $67,805 — 6,127th highest of 16,741 zip codes

47. 43620
> Location: Toledo, Ohio
> Gini index: 0.615
> Avg. household income, top 20%: $161,102 — 6,605th lowest of 16,708 zip codes
> Avg. household income, bottom 20%: $5,940 — 564th lowest of 16,708 zip codes
> Share of all income in 43620 that went to top 20%: 65.2% — 35th highest of 16,708 zip codes
> Share of all income in 43620 that went to bottom 20%: 2.4% — 969th lowest of 16,708 zip codes (tied)
> Median household income: $24,863 — 142nd lowest of 16,741 zip codes
[in-text-ad-2]

46. 31201
> Location: Macon-Bibb County, Georgia
> Gini index: 0.615
> Avg. household income, top 20%: $143,771 — 4,130th lowest of 16,708 zip codes
> Avg. household income, bottom 20%: $3,026 — 77th lowest of 16,708 zip codes
> Share of all income in 31201 that went to top 20%: 65.4% — 31st highest of 16,708 zip codes
> Share of all income in 31201 that went to bottom 20%: 1.4% — 129th lowest of 16,708 zip codes (tied)
> Median household income: $22,612 — 86th lowest of 16,741 zip codes

45. 85004
> Location: Phoenix, Arizona
> Gini index: 0.615
> Avg. household income, top 20%: $243,692 — 3,490th highest of 16,708 zip codes
> Avg. household income, bottom 20%: $4,195 — 164th lowest of 16,708 zip codes
> Share of all income in 85004 that went to top 20%: 62.6% — 94th highest of 16,708 zip codes
> Share of all income in 85004 that went to bottom 20%: 1.1% — 64th lowest of 16,708 zip codes (tied)
> Median household income: $41,951 — 2,564th lowest of 16,741 zip codes
[in-text-ad]
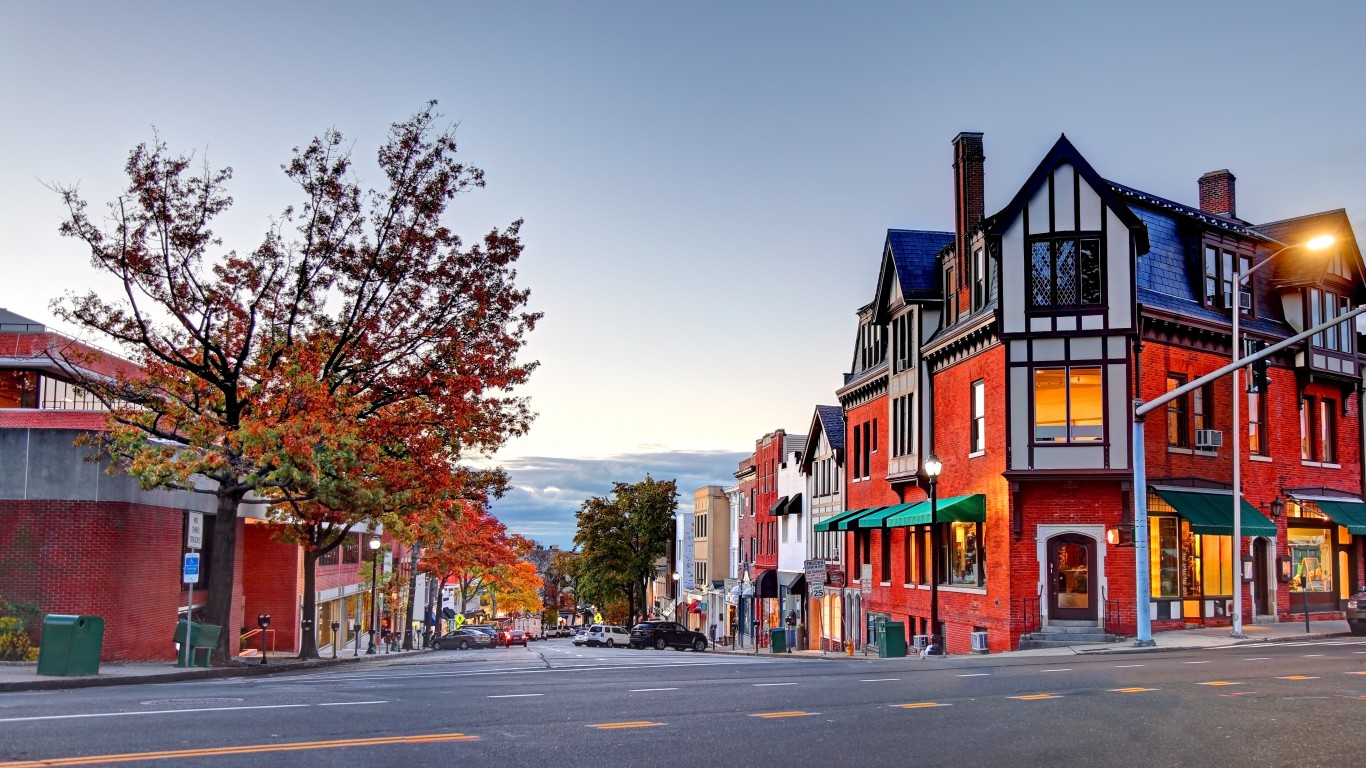
44. 06830
> Location: Greenwich, Connecticut
> Gini index: 0.616
> Avg. household income, top 20%: $830,471 — 41st highest of 16,708 zip codes
> Avg. household income, bottom 20%: $18,347 — 5,689th highest of 16,708 zip codes (tied)
> Share of all income in 06830 that went to top 20%: 65.6% — 26th highest of 16,708 zip codes
> Share of all income in 06830 that went to bottom 20%: 1.5% — 144th lowest of 16,708 zip codes (tied)
> Median household income: $119,838 — 882nd highest of 16,741 zip codes
43. 89109
> Location: Winchester, Nevada
> Gini index: 0.616
> Avg. household income, top 20%: $294,091 — 2,047th highest of 16,708 zip codes
> Avg. household income, bottom 20%: $6,533 — 752nd lowest of 16,708 zip codes
> Share of all income in 89109 that went to top 20%: 64.8% — 44th highest of 16,708 zip codes
> Share of all income in 89109 that went to bottom 20%: 1.4% — 136th lowest of 16,708 zip codes (tied)
> Median household income: $42,837 — 2,813th lowest of 16,741 zip codes (tied)
42. 33139
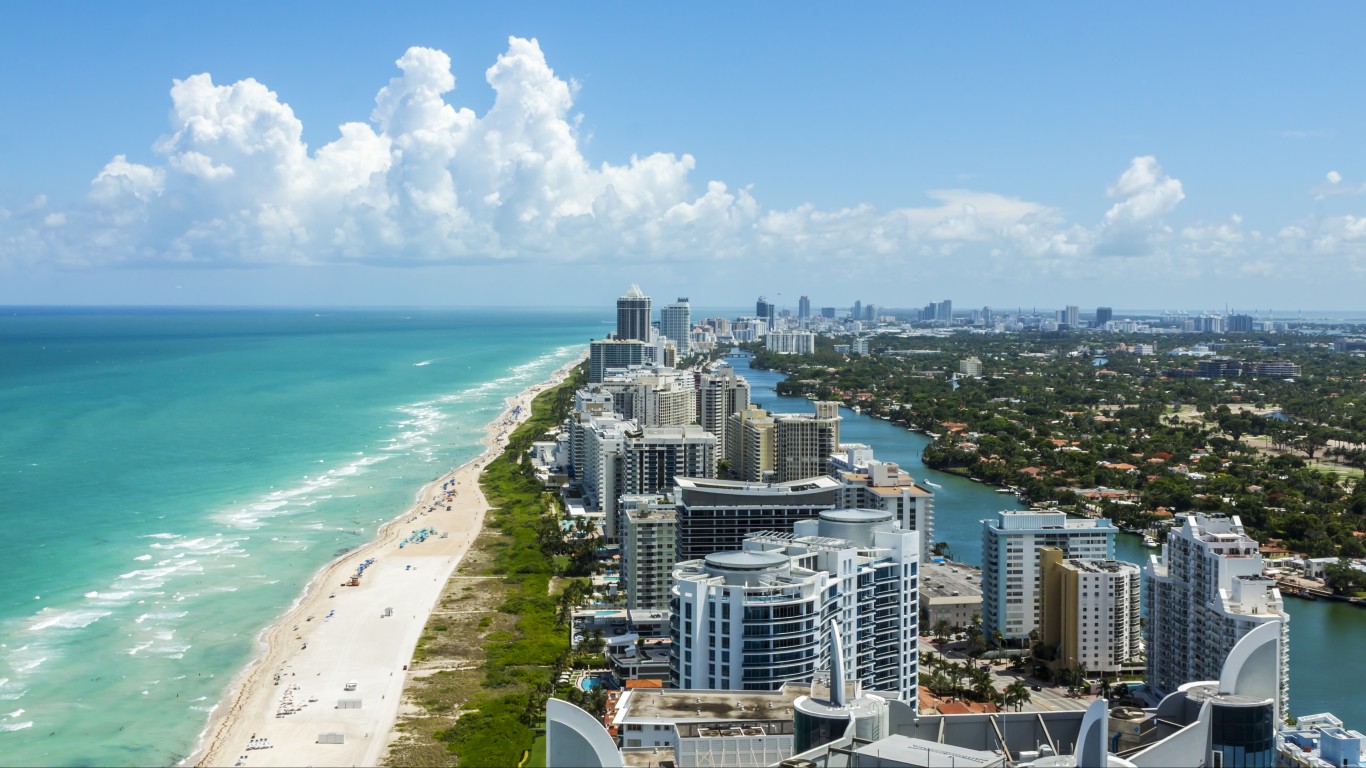
> Location: Miami Beach, Florida
> Gini index: 0.617
> Avg. household income, top 20%: $358,614 — 1,062nd highest of 16,708 zip codes
> Avg. household income, bottom 20%: $10,287 — 3,220th lowest of 16,708 zip codes (tied)
> Share of all income in 33139 that went to top 20%: 65.1% — 40th highest of 16,708 zip codes
> Share of all income in 33139 that went to bottom 20%: 1.9% — 343rd lowest of 16,708 zip codes (tied)
> Median household income: $53,327 — 6,341st lowest of 16,741 zip codes
[in-text-ad-2]

41. 90007
> Location: Los Angeles, California
> Gini index: 0.617
> Avg. household income, top 20%: $164,892 — 7,063rd lowest of 16,708 zip codes
> Avg. household income, bottom 20%: $2,987 — 74th lowest of 16,708 zip codes
> Share of all income in 90007 that went to top 20%: 62.9% — 86th highest of 16,708 zip codes
> Share of all income in 90007 that went to bottom 20%: 1.1% — 74th lowest of 16,708 zip codes (tied)
> Median household income: $27,406 — 269th lowest of 16,741 zip codes

40. 70118
> Location: New Orleans, Louisiana
> Gini index: 0.618
> Avg. household income, top 20%: $314,891 — 1,657th highest of 16,708 zip codes
> Avg. household income, bottom 20%: $6,844 — 891st lowest of 16,708 zip codes (tied)
> Share of all income in 70118 that went to top 20%: 64.5% — 48th highest of 16,708 zip codes
> Share of all income in 70118 that went to bottom 20%: 1.4% — 129th lowest of 16,708 zip codes (tied)
> Median household income: $48,919 — 4,714th lowest of 16,741 zip codes
[in-text-ad]

39. 02110
> Location: Boston, Massachusetts
> Gini index: 0.619
> Avg. household income, top 20%: $1,064,640 — 2nd highest of 16,708 zip codes
> Avg. household income, bottom 20%: $14,917 — 8,108th lowest of 16,708 zip codes (tied)
> Share of all income in 02110 that went to top 20%: 64.1% — 62nd highest of 16,708 zip codes
> Share of all income in 02110 that went to bottom 20%: 0.9% — 36th lowest of 16,708 zip codes (tied)
> Median household income: $142,869 — 363rd highest of 16,741 zip codes

38. 21673
> Location: Trappe, Maryland
> Gini index: 0.62
> Avg. household income, top 20%: $496,212 — 359th highest of 16,708 zip codes
> Avg. household income, bottom 20%: $18,629 — 5,505th highest of 16,708 zip codes
> Share of all income in 21673 that went to top 20%: 67.0% — 16th highest of 16,708 zip codes
> Share of all income in 21673 that went to bottom 20%: 2.5% — 1,179th lowest of 16,708 zip codes (tied)
> Median household income: $70,000 — 5,686th highest of 16,741 zip codes (tied)

37. 70820
> Location: Baton Rouge, Louisiana
> Gini index: 0.622
> Avg. household income, top 20%: $220,094 — 4,659th highest of 16,708 zip codes
> Avg. household income, bottom 20%: $2,598 — 54th lowest of 16,708 zip codes
> Share of all income in 70820 that went to top 20%: 64.3% — 55th highest of 16,708 zip codes (tied)
> Share of all income in 70820 that went to bottom 20%: 0.8% — 21st lowest of 16,708 zip codes (tied)
> Median household income: $31,459 — 608th lowest of 16,741 zip codes
[in-text-ad-2]

36. 15213
> Location: Pittsburgh, Pennsylvania
> Gini index: 0.622
> Avg. household income, top 20%: $144,312 — 4,209th lowest of 16,708 zip codes
> Avg. household income, bottom 20%: $2,366 — 43rd lowest of 16,708 zip codes
> Share of all income in 15213 that went to top 20%: 65.0% — 41st highest of 16,708 zip codes
> Share of all income in 15213 that went to bottom 20%: 1.1% — 62nd lowest of 16,708 zip codes (tied)
> Median household income: $22,584 — 84th lowest of 16,741 zip codes

35. 02115
> Location: Boston, Massachusetts
> Gini index: 0.625
> Avg. household income, top 20%: $262,845 — 2,856th highest of 16,708 zip codes
> Avg. household income, bottom 20%: $4,060 — 150th lowest of 16,708 zip codes
> Share of all income in 02115 that went to top 20%: 64.0% — 63rd highest of 16,708 zip codes
> Share of all income in 02115 that went to bottom 20%: 1.0% — 46th lowest of 16,708 zip codes (tied)
> Median household income: $43,144 — 2,905th lowest of 16,741 zip codes
[in-text-ad]

34. 66211
> Location: Leawood, Kansas
> Gini index: 0.625
> Avg. household income, top 20%: $857,904 — 36th highest of 16,708 zip codes
> Avg. household income, bottom 20%: $32,418 — 817th highest of 16,708 zip codes
> Share of all income in 66211 that went to top 20%: 67.4% — 13th highest of 16,708 zip codes
> Share of all income in 66211 that went to bottom 20%: 2.5% — 1,275th lowest of 16,708 zip codes (tied)
> Median household income: $117,951 — 938th highest of 16,741 zip codes

33. 15208
> Location: Pittsburgh, Pennsylvania
> Gini index: 0.625
> Avg. household income, top 20%: $272,171 — 2,598th highest of 16,708 zip codes
> Avg. household income, bottom 20%: $7,125 — 1,035th lowest of 16,708 zip codes
> Share of all income in 15208 that went to top 20%: 65.6% — 27th highest of 16,708 zip codes
> Share of all income in 15208 that went to bottom 20%: 1.7% — 258th lowest of 16,708 zip codes (tied)
> Median household income: $37,860 — 1,574th lowest of 16,741 zip codes

32. 47305
> Location: Muncie, Indiana
> Gini index: 0.625
> Avg. household income, top 20%: $168,132 — 7,491st lowest of 16,708 zip codes
> Avg. household income, bottom 20%: $5,919 — 556th lowest of 16,708 zip codes
> Share of all income in 47305 that went to top 20%: 65.4% — 30th highest of 16,708 zip codes
> Share of all income in 47305 that went to bottom 20%: 2.3% — 813th lowest of 16,708 zip codes (tied)
> Median household income: $25,982 — 186th lowest of 16,741 zip codes
[in-text-ad-2]

31. 35470
> Location: Livingston, Alabama
> Gini index: 0.625
> Avg. household income, top 20%: $131,404 — 2,432nd lowest of 16,708 zip codes
> Avg. household income, bottom 20%: $1,429 — 17th lowest of 16,708 zip codes
> Share of all income in 35470 that went to top 20%: 66.0% — 21st highest of 16,708 zip codes
> Share of all income in 35470 that went to bottom 20%: 0.7% — 18th lowest of 16,708 zip codes
> Median household income: $22,884 — 93rd lowest of 16,741 zip codes

30. 10013
> Location: New York, New York
> Gini index: 0.626
> Avg. household income, top 20%: $923,650 — 18th highest of 16,708 zip codes
> Avg. household income, bottom 20%: $15,251 — 8,271st highest of 16,708 zip codes (tied)
> Share of all income in 10013 that went to top 20%: 66.3% — 20th highest of 16,708 zip codes
> Share of all income in 10013 that went to bottom 20%: 1.1% — 68th lowest of 16,708 zip codes
> Median household income: $113,191 — 1,097th highest of 16,741 zip codes
[in-text-ad]

29. 53233
> Location: Milwaukee, Wisconsin
> Gini index: 0.628
> Avg. household income, top 20%: $88,772 — 91st lowest of 16,708 zip codes
> Avg. household income, bottom 20%: $406 — 4th lowest of 16,708 zip codes
> Share of all income in 53233 that went to top 20%: 63.4% — 75th highest of 16,708 zip codes
> Share of all income in 53233 that went to bottom 20%: 0.3% — 8th lowest of 16,708 zip codes
> Median household income: $15,635 — 13th lowest of 16,741 zip codes

28. 94305
> Location: Stanford, California
> Gini index: 0.628
> Avg. household income, top 20%: $468,686 — 442nd highest of 16,708 zip codes
> Avg. household income, bottom 20%: $5,193 — 348th lowest of 16,708 zip codes
> Share of all income in 94305 that went to top 20%: 66.4% — 19th highest of 16,708 zip codes
> Share of all income in 94305 that went to bottom 20%: 0.7% — 19th lowest of 16,708 zip codes
> Median household income: $60,000 — 8,216th highest of 16,741 zip codes (tied)

27. 90021
> Location: Los Angeles, California
> Gini index: 0.628
> Avg. household income, top 20%: $189,531 — 6,914th highest of 16,708 zip codes (tied)
> Avg. household income, bottom 20%: $2,035 — 26th lowest of 16,708 zip codes (tied)
> Share of all income in 90021 that went to top 20%: 65.7% — 25th highest of 16,708 zip codes
> Share of all income in 90021 that went to bottom 20%: 0.7% — 16th lowest of 16,708 zip codes (tied)
> Median household income: $21,635 — 68th lowest of 16,741 zip codes
[in-text-ad-2]

26. 10029
> Location: New York, New York
> Gini index: 0.628
> Avg. household income, top 20%: $229,747 — 4,129th highest of 16,708 zip codes
> Avg. household income, bottom 20%: $6,057 — 597th lowest of 16,708 zip codes (tied)
> Share of all income in 10029 that went to top 20%: 65.2% — 36th highest of 16,708 zip codes (tied)
> Share of all income in 10029 that went to bottom 20%: 1.7% — 258th lowest of 16,708 zip codes (tied)
> Median household income: $33,720 — 846th lowest of 16,741 zip codes

25. 29401
> Location: Charleston, South Carolina
> Gini index: 0.63
> Avg. household income, top 20%: $530,435 — 277th highest of 16,708 zip codes
> Avg. household income, bottom 20%: $7,869 — 1,402nd lowest of 16,708 zip codes (tied)
> Share of all income in 29401 that went to top 20%: 65.1% — 38th highest of 16,708 zip codes (tied)
> Share of all income in 29401 that went to bottom 20%: 1.0% — 42nd lowest of 16,708 zip codes (tied)
> Median household income: $79,539 — 4,011th highest of 16,741 zip codes
[in-text-ad]

24. 05672
> Location: Stowe, Vermont
> Gini index: 0.63
> Avg. household income, top 20%: $380,474 — 851st highest of 16,708 zip codes
> Avg. household income, bottom 20%: $5,686 — 489th lowest of 16,708 zip codes (tied)
> Share of all income in 05672 that went to top 20%: 65.1% — 38th highest of 16,708 zip codes (tied)
> Share of all income in 05672 that went to bottom 20%: 1.0% — 42nd lowest of 16,708 zip codes (tied)
> Median household income: $59,770 — 8,277th highest of 16,741 zip codes
23. 85147
> Location: Sacaton, Arizona
> Gini index: 0.631
> Avg. household income, top 20%: $102,785 — 380th lowest of 16,708 zip codes
> Avg. household income, bottom 20%: $0 — the lowest of 16,708 zip codes
> Share of all income in 85147 that went to top 20%: 65.3% — 32nd highest of 16,708 zip codes
> Share of all income in 85147 that went to bottom 20%: 0.0% reported — the lowest of 16,708 zip codes
> Median household income: $17,963 — 20th lowest of 16,741 zip codes

22. 70113
> Location: New Orleans, Louisiana
> Gini index: 0.631
> Avg. household income, top 20%: $144,738 — 4,268th lowest of 16,708 zip codes (tied)
> Avg. household income, bottom 20%: $4,292 — 176th lowest of 16,708 zip codes
> Share of all income in 70113 that went to top 20%: 67.6% — 12th highest of 16,708 zip codes
> Share of all income in 70113 that went to bottom 20%: 2.0% — 457th lowest of 16,708 zip codes (tied)
> Median household income: $18,148 — 21st lowest of 16,741 zip codes
[in-text-ad-2]

21. 40507
> Location: Lexington-Fayette, Kentucky
> Gini index: 0.631
> Avg. household income, top 20%: $223,397 — 4,472nd highest of 16,708 zip codes
> Avg. household income, bottom 20%: $4,178 — 161st lowest of 16,708 zip codes
> Share of all income in 40507 that went to top 20%: 65.2% — 34th highest of 16,708 zip codes
> Share of all income in 40507 that went to bottom 20%: 1.3% — 100th lowest of 16,708 zip codes (tied)
> Median household income: $30,288 — 472nd lowest of 16,741 zip codes

20. 92590
> Location: Temecula, California
> Gini index: 0.631
> Avg. household income, top 20%: $483,286 — 391st highest of 16,708 zip codes
> Avg. household income, bottom 20%: $13,426 — 6,551st lowest of 16,708 zip codes
> Share of all income in 92590 that went to top 20%: 68.0% — 9th highest of 16,708 zip codes
> Share of all income in 92590 that went to bottom 20%: 1.9% — 364th lowest of 16,708 zip codes (tied)
> Median household income: $68,125 — 6,075th highest of 16,741 zip codes (tied)
[in-text-ad]

19. 34102
> Location: Naples, Florida
> Gini index: 0.635
> Avg. household income, top 20%: $664,694 — 112th highest of 16,708 zip codes
> Avg. household income, bottom 20%: $13,286 — 6,407th lowest of 16,708 zip codes
> Share of all income in 34102 that went to top 20%: 66.5% — 18th highest of 16,708 zip codes
> Share of all income in 34102 that went to bottom 20%: 1.3% — 114th lowest of 16,708 zip codes (tied)
> Median household income: $85,938 — 3,133rd highest of 16,741 zip codes (tied)

18. 90024
> Location: Los Angeles, California
> Gini index: 0.636
> Avg. household income, top 20%: $443,611 — 542nd highest of 16,708 zip codes
> Avg. household income, bottom 20%: $4,693 — 234th lowest of 16,708 zip codes
> Share of all income in 90024 that went to top 20%: 65.5% — 28th highest of 16,708 zip codes
> Share of all income in 90024 that went to bottom 20%: 0.7% — 15th lowest of 16,708 zip codes
> Median household income: $65,855 — 6,555th highest of 16,741 zip codes

17. 60637
> Location: Chicago, Illinois
> Gini index: 0.636
> Avg. household income, top 20%: $204,106 — 5,728th highest of 16,708 zip codes
> Avg. household income, bottom 20%: $3,747 — 115th lowest of 16,708 zip codes
> Share of all income in 60637 that went to top 20%: 65.7% — 24th highest of 16,708 zip codes
> Share of all income in 60637 that went to bottom 20%: 1.2% — 82nd lowest of 16,708 zip codes (tied)
> Median household income: $28,965 — 355th lowest of 16,741 zip codes
[in-text-ad-2]

16. 92617
> Location: Irvine, California
> Gini index: 0.638
> Avg. household income, top 20%: $282,212 — 2,323rd highest of 16,708 zip codes
> Avg. household income, bottom 20%: $937 — 9th lowest of 16,708 zip codes
> Share of all income in 92617 that went to top 20%: 65.0% — 42nd highest of 16,708 zip codes
> Share of all income in 92617 that went to bottom 20%: 0.2% — 2nd lowest of 16,708 zip codes (tied)
> Median household income: $36,824 — 1,364th lowest of 16,741 zip codes

15. 02111
> Location: Boston, Massachusetts
> Gini index: 0.639
> Avg. household income, top 20%: $413,052 — 667th highest of 16,708 zip codes
> Avg. household income, bottom 20%: $5,533 — 436th lowest of 16,708 zip codes
> Share of all income in 02111 that went to top 20%: 65.7% — 23rd highest of 16,708 zip codes
> Share of all income in 02111 that went to bottom 20%: 0.9% — 32nd lowest of 16,708 zip codes (tied)
> Median household income: $53,596 — 6,455th lowest of 16,741 zip codes
[in-text-ad]

14. 37403
> Location: Chattanooga, Tennessee
> Gini index: 0.641
> Avg. household income, top 20%: $325,590 — 1,477th highest of 16,708 zip codes
> Avg. household income, bottom 20%: $10,390 — 3,308th lowest of 16,708 zip codes (tied)
> Share of all income in 37403 that went to top 20%: 68.6% — 8th highest of 16,708 zip codes
> Share of all income in 37403 that went to bottom 20%: 2.2% — 662nd lowest of 16,708 zip codes (tied)
> Median household income: $37,550 — 1,523rd lowest of 16,741 zip codes (tied)
13. 42518
> Location: Burnside, Kentucky
> Gini index: 0.643
> Avg. household income, top 20%: $238,900 — 3,674th highest of 16,708 zip codes
> Avg. household income, bottom 20%: $5,381 — 395th lowest of 16,708 zip codes
> Share of all income in 42518 that went to top 20%: 65.7% — 22nd highest of 16,708 zip codes
> Share of all income in 42518 that went to bottom 20%: 1.5% — 178th lowest of 16,708 zip codes (tied)
> Median household income: $35,972 — 1,178th lowest of 16,741 zip codes

12. 35203
> Location: Birmingham, Alabama
> Gini index: 0.644
> Avg. household income, top 20%: $192,138 — 6,688th highest of 16,708 zip codes
> Avg. household income, bottom 20%: $6,413 — 712th lowest of 16,708 zip codes (tied)
> Share of all income in 35203 that went to top 20%: 68.8% — 7th highest of 16,708 zip codes
> Share of all income in 35203 that went to bottom 20%: 2.3% — 813th lowest of 16,708 zip codes (tied)
> Median household income: $17,248 — 16th lowest of 16,741 zip codes
[in-text-ad-2]

11. 44106
> Location: Cleveland, Ohio
> Gini index: 0.646
> Avg. household income, top 20%: $210,266 — 5,311th highest of 16,708 zip codes
> Avg. household income, bottom 20%: $3,175 — 85th lowest of 16,708 zip codes
> Share of all income in 44106 that went to top 20%: 67.2% — 15th highest of 16,708 zip codes
> Share of all income in 44106 that went to bottom 20%: 1.0% — 48th lowest of 16,708 zip codes (tied)
> Median household income: $29,225 — 375th lowest of 16,741 zip codes

10. 44304
> Location: Akron, Ohio
> Gini index: 0.647
> Avg. household income, top 20%: $142,131 — 3,885th lowest of 16,708 zip codes (tied)
> Avg. household income, bottom 20%: $2,428 — 46th lowest of 16,708 zip codes
> Share of all income in 44304 that went to top 20%: 66.7% — 17th highest of 16,708 zip codes
> Share of all income in 44304 that went to bottom 20%: 1.1% — 74th lowest of 16,708 zip codes (tied)
> Median household income: $22,661 — 87th lowest of 16,741 zip codes
[in-text-ad]

9. 53726
> Location: Madison, Wisconsin
> Gini index: 0.65
> Avg. household income, top 20%: $312,686 — 1,690th highest of 16,708 zip codes
> Avg. household income, bottom 20%: $5,014 — 301st lowest of 16,708 zip codes
> Share of all income in 53726 that went to top 20%: 67.3% — 14th highest of 16,708 zip codes
> Share of all income in 53726 that went to bottom 20%: 1.1% — 64th lowest of 16,708 zip codes (tied)
> Median household income: $37,976 — 1,593rd lowest of 16,741 zip codes
8. 24137
> Location: Penhook, Virginia
> Gini index: 0.659
> Avg. household income, top 20%: $425,608 — 600th highest of 16,708 zip codes
> Avg. household income, bottom 20%: $11,786 — 4,754th lowest of 16,708 zip codes
> Share of all income in 24137 that went to top 20%: 69.2% — 5th highest of 16,708 zip codes
> Share of all income in 24137 that went to bottom 20%: 1.9% — 389th lowest of 16,708 zip codes (tied)
> Median household income: $56,950 — 7,625th lowest of 16,741 zip codes

7. 90013
> Location: Los Angeles, California
> Gini index: 0.663
> Avg. household income, top 20%: $222,365 — 4,528th highest of 16,708 zip codes
> Avg. household income, bottom 20%: $2,677 — 58th lowest of 16,708 zip codes
> Share of all income in 90013 that went to top 20%: 67.8% — 10th highest of 16,708 zip codes
> Share of all income in 90013 that went to bottom 20%: 0.8% — 29th lowest of 16,708 zip codes
> Median household income: $22,316 — 79th lowest of 16,741 zip codes
[in-text-ad-2]

6. 78705
> Location: Austin, Texas
> Gini index: 0.666
> Avg. household income, top 20%: $163,152 — 6,852nd lowest of 16,708 zip codes
> Avg. household income, bottom 20%: $686 — 7th lowest of 16,708 zip codes
> Share of all income in 78705 that went to top 20%: 67.7% — 11th highest of 16,708 zip codes
> Share of all income in 78705 that went to bottom 20%: 0.3% — 7th lowest of 16,708 zip codes
> Median household income: $20,326 — 44th lowest of 16,741 zip codes

5. 02903
> Location: Providence, Rhode Island
> Gini index: 0.668
> Avg. household income, top 20%: $294,448 — 2,033rd highest of 16,708 zip codes
> Avg. household income, bottom 20%: $3,324 — 91st lowest of 16,708 zip codes
> Share of all income in 02903 that went to top 20%: 69.0% — 6th highest of 16,708 zip codes
> Share of all income in 02903 that went to bottom 20%: 0.8% — 23rd lowest of 16,708 zip codes
> Median household income: $36,347 — 1,257th lowest of 16,741 zip codes
[in-text-ad]

4. 40202
> Location: Louisville/Jefferson County, Kentucky
> Gini index: 0.674
> Avg. household income, top 20%: $175,984 — 8,305th highest of 16,708 zip codes
> Avg. household income, bottom 20%: $4,099 — 156th lowest of 16,708 zip codes
> Share of all income in 40202 that went to top 20%: 71.3% — 3rd highest of 16,708 zip codes
> Share of all income in 40202 that went to bottom 20%: 1.7% — 228th lowest of 16,708 zip codes (tied)
> Median household income: $19,628 — 31st lowest of 16,741 zip codes

3. 44115
> Location: Cleveland, Ohio
> Gini index: 0.683
> Avg. household income, top 20%: $141,754 — 3,831st lowest of 16,708 zip codes (tied)
> Avg. household income, bottom 20%: $512 — 5th lowest of 16,708 zip codes
> Share of all income in 44115 that went to top 20%: 69.6% — 4th highest of 16,708 zip codes
> Share of all income in 44115 that went to bottom 20%: 0.3% — 5th lowest of 16,708 zip codes
> Median household income: $14,952 — 8th lowest of 16,741 zip codes

2. 32603
> Location: Gainesville, Florida
> Gini index: 0.732
> Avg. household income, top 20%: $219,118 — 4,731st highest of 16,708 zip codes
> Avg. household income, bottom 20%: $84 — 2nd lowest of 16,708 zip codes
> Share of all income in 32603 that went to top 20%: 77.1% — the highest of 16,708 zip codes
> Share of all income in 32603 that went to bottom 20%: 0.2% — 2nd lowest of 16,708 zip codes (tied)
> Median household income: $20,660 — 49th lowest of 16,741 zip codes
[in-text-ad-2]
1. 71254
> Location: Lake Providence, Louisiana
> Gini index: 0.74
> Avg. household income, top 20%: $226,586 — 4,305th highest of 16,708 zip codes
> Avg. household income, bottom 20%: $2,355 — 42nd lowest of 16,708 zip codes
> Share of all income in 71254 that went to top 20%: 76.2% — 2nd highest of 16,708 zip codes
> Share of all income in 71254 that went to bottom 20%: 0.8% — 24th lowest of 16,708 zip codes (tied)
> Median household income: $19,544 — 29th lowest of 16,741 zip codes
Methodology
To determine the ZIP codes with the widest income gaps in the nation, 24/7 Wall St. reviewed five-year estimates of the Gini Index of income inequality from the U.S. Census Bureau’s 2019 American Community Survey.
The Gini Index of income inequality summarizes income dispersion in an area on a scale from 0 to 1. A value of 0 indicates perfect equality — everyone in the area receives an equal share of income. A value of 1 indicates perfect inequality — only one recipient receives all the income.
We used ZIP Code Tabulation Areas — a Census geography type that defines areal representations of United States Postal Service ZIP codes (USPS ZIP codes do not define geographic boundaries but instead are a network of mail delivery routes in a service area). We refer to Census ZCTAs as ZIP codes.
Of the 33,120 ZIP codes the Census publishes data for, 32,989 had boundaries that fell within one of the 50 states or the District of Columbia.
ZIP codes were excluded if the Gini Index was not available in the 2019 ACS, if there were fewer than 1,000 housing units, or if the sampling error associated with a ZIP code’s data was deemed too high.
The sampling error was defined as too high if the coefficient of variation — a statistical assessment of how reliable an estimate is — for a ZIP code’s Gini Index was above 15% and greater than two standard deviations above the mean CV for all ZIP codes’ Gini Indices. We similarly excluded ZIP codes that had a sampling error too high for their population, using the same definition.
The remaining 16,742 places were ranked based on their Gini Index. To break ties, we used the share of aggregate household income earned by the top 20% of households.
Additional information on average household income by quintile, share of aggregate household income by quintile, and median household income are also five-year estimates from the 2019 ACS.
Get Ready To Retire (Sponsored)
Start by taking a quick retirement quiz from SmartAsset that will match you with up to 3 financial advisors that serve your area and beyond in 5 minutes, or less.
Each advisor has been vetted by SmartAsset and is held to a fiduciary standard to act in your best interests.
Here’s how it works:
1. Answer SmartAsset advisor match quiz
2. Review your pre-screened matches at your leisure. Check out the advisors’ profiles.
3. Speak with advisors at no cost to you. Have an introductory call on the phone or introduction in person and choose whom to work with in the future
Get started right here.
Thank you for reading! Have some feedback for us?
Contact the 24/7 Wall St. editorial team.
 24/7 Wall St.
 24/7 Wall St.
 24/7 Wall St.