
Cigаrette sales climbed in the U.S. in 2020 for the first time in two decades. Americans bought a total of 203.7 billion cigаrettes last year, up from 202.9 billion the year before, according to a Federal Trade Commission report. The uptick coincided with increased cigаrette promotional and ad spending by tobacco companies.
Smоking is the leading cause of preventable death in the United States, claiming nearly half a million American lives annually, according to the Centers for Disease Control and Prevention. Another 16 million Americans are living with a serious illness caused by smоking.
Though the risks associated with smоking and tobacco use are well established, 42.4 million American adults — or 16.6% of the adult population — regularly smоke cigаrettes. In some parts of the country, however, residents are far more likely to take the dangers associated with smоking seriously.
Using data from County Health Rankings & Roadmaps, a Robert Wood Johnson Foundation and University of Wisconsin Population Health Institute joint program, 24/7 Tempo identified the 50 metro areas with the fewest smоkers. Metropolitan areas are ranked on the adult smоking rate — the share of the 18 and older population who smоke every day or most days and have smоked at least 100 cigаrettes in their lifetime.
Smоking rates in the metro areas on this list range from 15.3% to 7.2%. The majority of metro areas on this list are located in Western states, including 15 in California alone.
Given the proven detrimental effects of smоking, it is perhaps not surprising that some important health outcome measures tend to be better than average in metros with lower smоking rates. For example, in most of the 50 metro areas with the lowest smоking rates, the share of adults who report being in fair or poor health is below the 16.5% share nationwide.
The correlation between smоking rates and life expectancy is also strong. In nearly every metro area on this list, average life expectancy at birth is above the national average of 79.2 years.
Click here to see metros with the fewest smоkers
Click here to see our detailed methodology
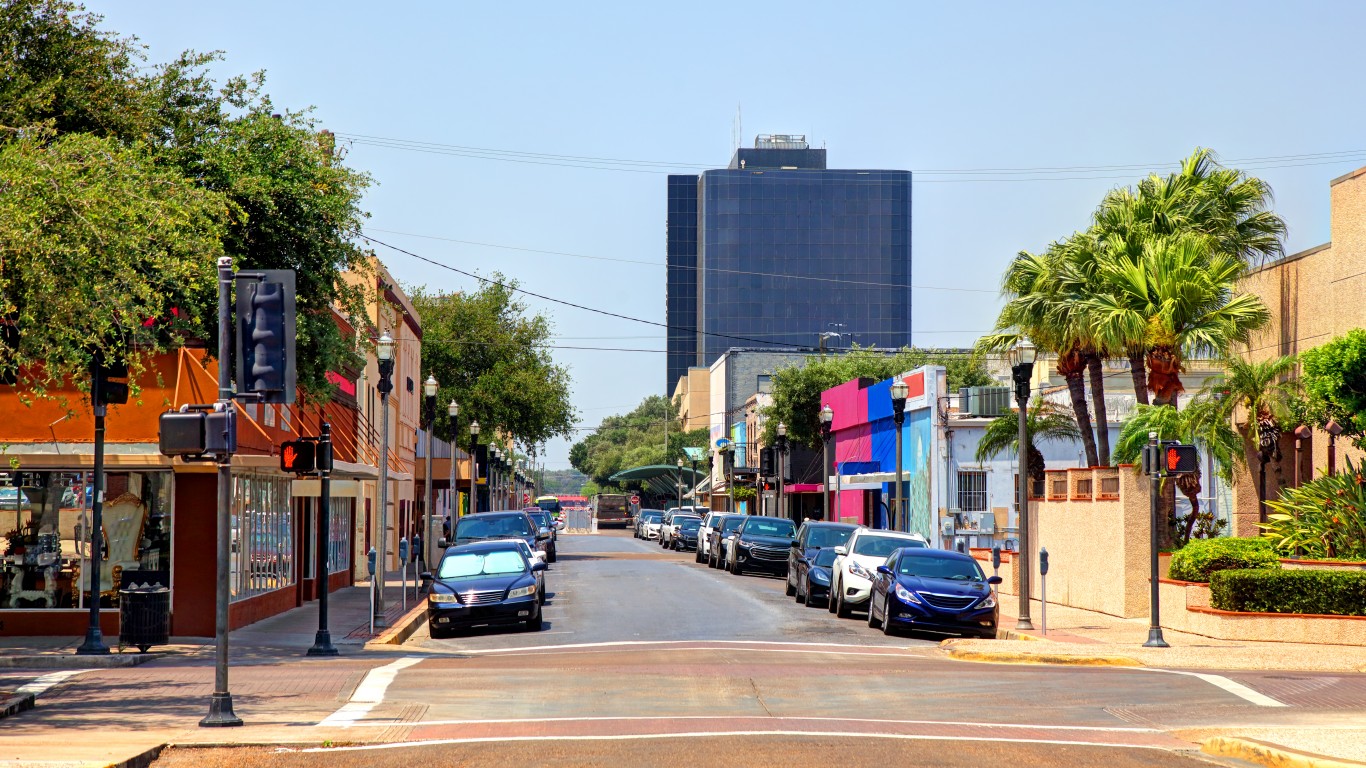
50. McAllen-Edinburg-Mission, TX
> Smoking rate: 15.3%
> Adults reporting poor or fair health: 33.1% — 3rd highest of 384 metros
> Premature deaths per 100,000: 297.5 — 81st lowest of 384 metros
> Life expectancy at birth (years): 81.91 — 29th highest of 384 metros
[in-text-ad]

49. El Paso, TX
> Smoking rate: 15.2%
> Adults reporting poor or fair health: 27.2% — 8th highest of 384 metros
> Premature deaths per 100,000: 324.5 — 125th lowest of 384 metros
> Life expectancy at birth (years): 80.14 — 91st highest of 384 metros
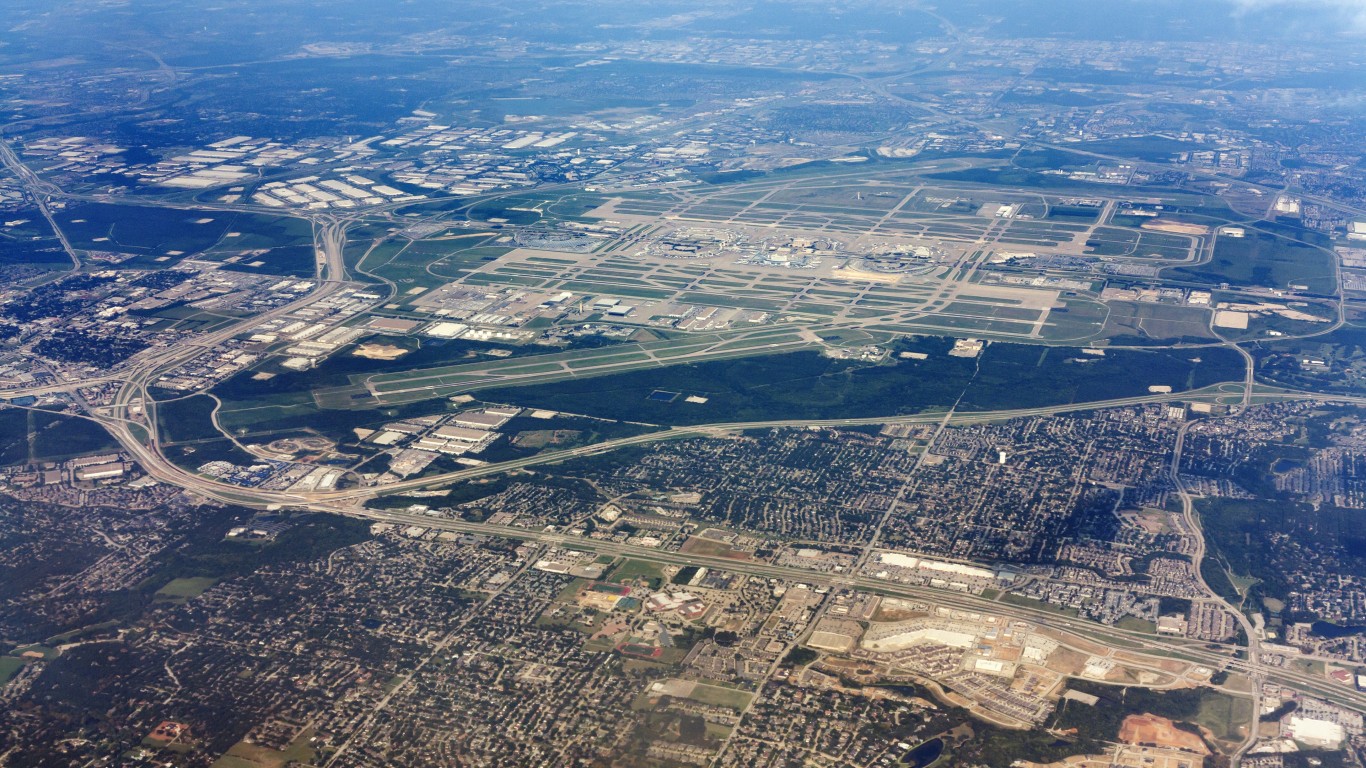
48. Dallas-Fort Worth-Arlington, TX
> Smoking rate: 15.2%
> Adults reporting poor or fair health: 19.5% — 148th highest of 384 metros
> Premature deaths per 100,000: 307.9 — 98th lowest of 384 metros
> Life expectancy at birth (years): 79.79 — 106th highest of 384 metros

47. Madison, WI
> Smoking rate: 15.1%
> Adults reporting poor or fair health: 12.5% — 9th lowest of 384 metros
> Premature deaths per 100,000: 241.3 — 16th lowest of 384 metros
> Life expectancy at birth (years): 81.51 — 36th highest of 384 metros
[in-text-ad-2]

46. Midland, TX
> Smoking rate: 15.1%
> Adults reporting poor or fair health: 19.1% — 171st highest of 384 metros
> Premature deaths per 100,000: 374.5 — 173rd highest of 384 metros
> Life expectancy at birth (years): 78.55 — 184th highest of 384 metros

45. Iowa City, IA
> Smoking rate: 15.1%
> Adults reporting poor or fair health: 12.9% — 14th lowest of 384 metros
> Premature deaths per 100,000: 239.1 — 15th lowest of 384 metros
> Life expectancy at birth (years): 82.57 — 13th highest of 384 metros
[in-text-ad]

44. Denver-Aurora-Lakewood, CO
> Smoking rate: 15.0%
> Adults reporting poor or fair health: 13.7% — 29th lowest of 384 metros
> Premature deaths per 100,000: 268.2 — 41st lowest of 384 metros
> Life expectancy at birth (years): 80.93 — 54th highest of 384 metros

43. Wenatchee, WA
> Smoking rate: 15.0%
> Adults reporting poor or fair health: 18.8% — 180th highest of 384 metros
> Premature deaths per 100,000: 259.0 — 33rd lowest of 384 metros
> Life expectancy at birth (years): 81.37 — 39th highest of 384 metros

42. Minneapolis-St. Paul-Bloomington, MN-WI
> Smoking rate: 15.0%
> Adults reporting poor or fair health: 12.0% — 6th lowest of 384 metros
> Premature deaths per 100,000: 250.8 — 23rd lowest of 384 metros
> Life expectancy at birth (years): 81.30 — 42nd highest of 384 metros
[in-text-ad-2]

41. Trenton-Princeton, NJ
> Smoking rate: 15.0%
> Adults reporting poor or fair health: 16.8% — 121st lowest of 384 metros
> Premature deaths per 100,000: 302.9 — 89th lowest of 384 metros
> Life expectancy at birth (years): 80.58 — 64th highest of 384 metros

40. Stockton, CA
> Smoking rate: 14.9%
> Adults reporting poor or fair health: 22.3% — 52nd highest of 384 metros
> Premature deaths per 100,000: 366.1 — 186th highest of 384 metros
> Life expectancy at birth (years): 78.56 — 182nd highest of 384 metros
[in-text-ad]

39. Urban Honolulu, HI
> Smoking rate: 14.9%
> Adults reporting poor or fair health: 17.0% — 133rd lowest of 384 metros
> Premature deaths per 100,000: 277.9 — 52nd lowest of 384 metros
> Life expectancy at birth (years): 82.52 — 15th highest of 384 metros
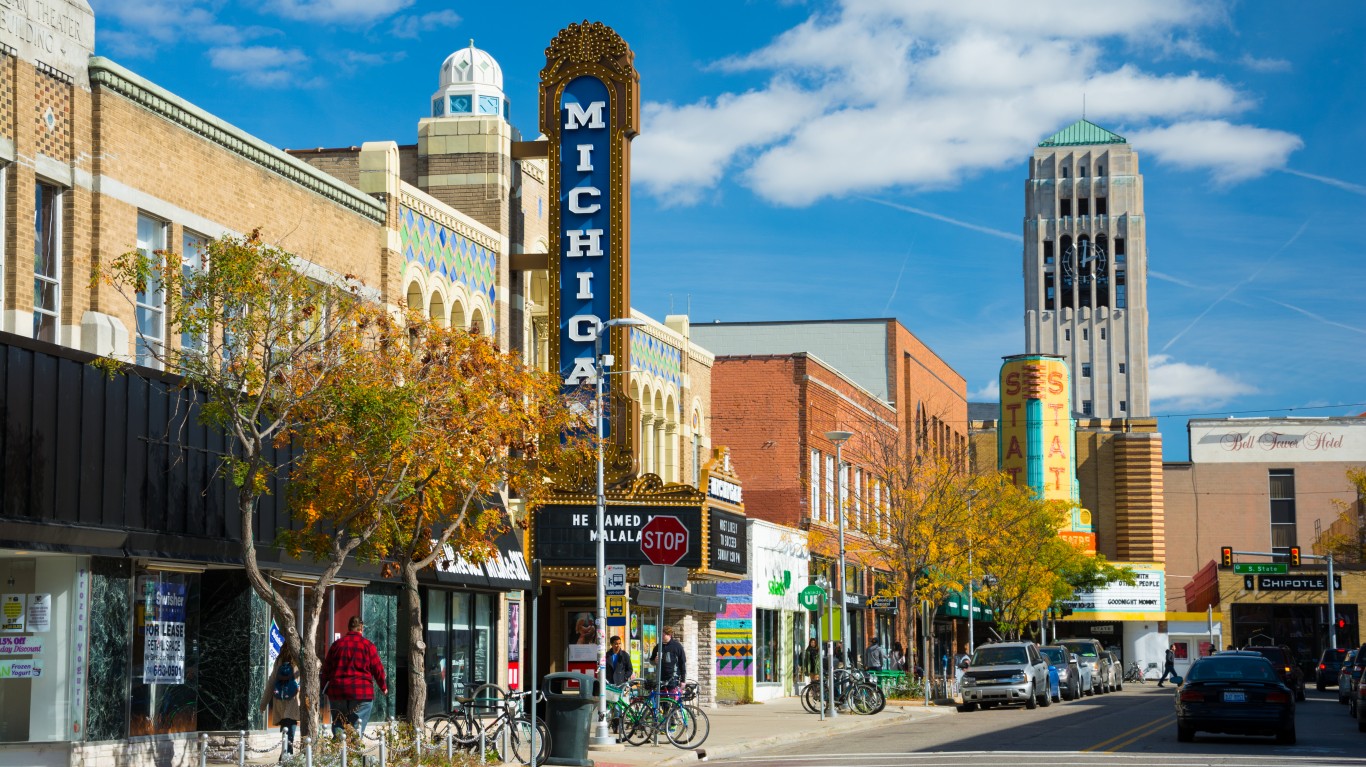
38. Ann Arbor, MI
> Smoking rate: 14.8%
> Adults reporting poor or fair health: 14.4% — 43rd lowest of 384 metros
> Premature deaths per 100,000: 250.8 — 22nd lowest of 384 metros
> Life expectancy at birth (years): 81.39 — 38th highest of 384 metros

37. San Antonio-New Braunfels, TX
> Smoking rate: 14.8%
> Adults reporting poor or fair health: 21.2% — 87th highest of 384 metros
> Premature deaths per 100,000: 341.4 — 152nd lowest of 384 metros
> Life expectancy at birth (years): 79.04 — 144th highest of 384 metros
[in-text-ad-2]

36. Corvallis, OR
> Smoking rate: 14.7%
> Adults reporting poor or fair health: 16.1% — 93rd lowest of 384 metros
> Premature deaths per 100,000: 198.3 — 2nd lowest of 384 metros
> Life expectancy at birth (years): 82.99 — 5th highest of 384 metros
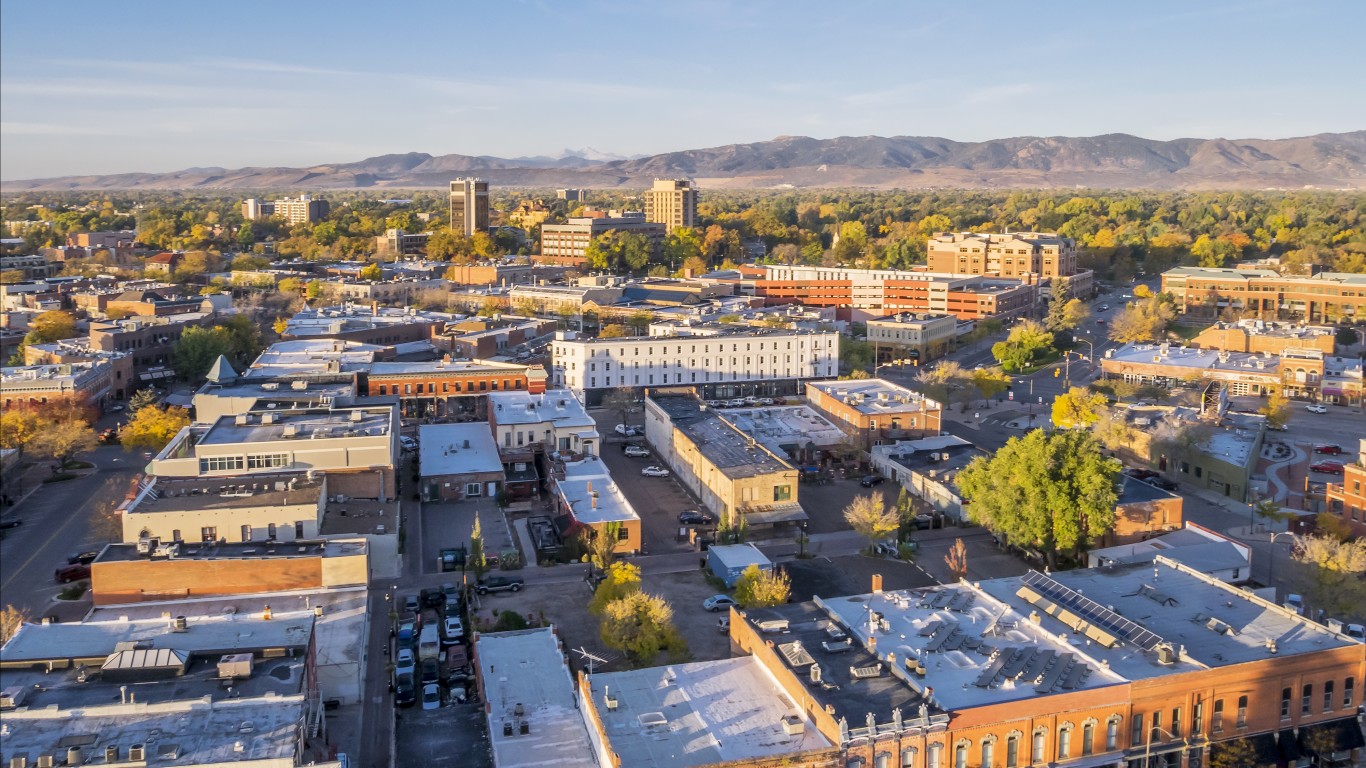
35. Fort Collins, CO
> Smoking rate: 14.5%
> Adults reporting poor or fair health: 11.2% — 2nd lowest of 384 metros
> Premature deaths per 100,000: 238.6 — 14th lowest of 384 metros
> Life expectancy at birth (years): 81.82 — 31st highest of 384 metros
[in-text-ad]

34. Walla Walla, WA
> Smoking rate: 14.5%
> Adults reporting poor or fair health: 17.8% — 158th lowest of 384 metros
> Premature deaths per 100,000: 309.0 — 99th lowest of 384 metros
> Life expectancy at birth (years): 80.15 — 89th highest of 384 metros

33. New York-Newark-Jersey City, NY-NJ-PA
> Smoking rate: 14.5%
> Adults reporting poor or fair health: 17.2% — 139th lowest of 384 metros
> Premature deaths per 100,000: 257.8 — 30th lowest of 384 metros
> Life expectancy at birth (years): 82.38 — 17th highest of 384 metros

32. Bremerton-Silverdale-Port Orchard, WA
> Smoking rate: 14.4%
> Adults reporting poor or fair health: 15.2% — 62nd lowest of 384 metros
> Premature deaths per 100,000: 291.6 — 72nd lowest of 384 metros
> Life expectancy at birth (years): 80.07 — 94th highest of 384 metros
[in-text-ad-2]

31. Riverside-San Bernardino-Ontario, CA
> Smoking rate: 14.3%
> Adults reporting poor or fair health: 22.2% — 61st highest of 384 metros
> Premature deaths per 100,000: 323.2 — 123rd lowest of 384 metros
> Life expectancy at birth (years): 79.92 — 101st highest of 384 metros

30. Santa Fe, NM
> Smoking rate: 14.2%
> Adults reporting poor or fair health: 17.8% — 165th lowest of 384 metros
> Premature deaths per 100,000: 295.2 — 79th lowest of 384 metros
> Life expectancy at birth (years): 81.53 — 35th highest of 384 metros
[in-text-ad]

29. Kennewick-Richland, WA
> Smoking rate: 14.2%
> Adults reporting poor or fair health: 19.3% — 162nd highest of 384 metros
> Premature deaths per 100,000: 278.0 — 53rd lowest of 384 metros
> Life expectancy at birth (years): 80.62 — 60th highest of 384 metros

28. Boston-Cambridge-Newton, MA-NH
> Smoking rate: 14.2%
> Adults reporting poor or fair health: 13.3% — 22nd lowest of 384 metros
> Premature deaths per 100,000: 258.4 — 31st lowest of 384 metros
> Life expectancy at birth (years): 81.36 — 40th highest of 384 metros
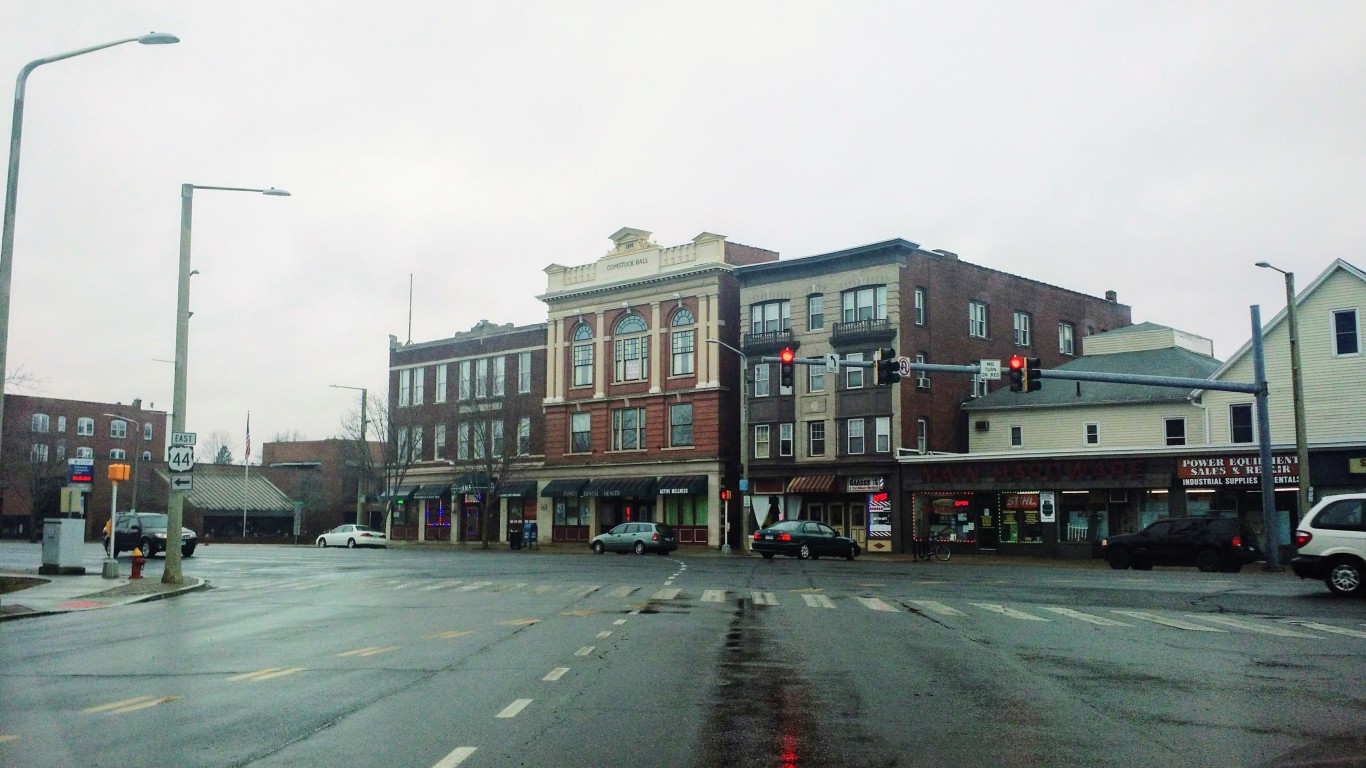
27. Hartford-East Hartford-Middletown, CT
> Smoking rate: 14.1%
> Adults reporting poor or fair health: 13.0% — 17th lowest of 384 metros
> Premature deaths per 100,000: 287.5 — 65th lowest of 384 metros
> Life expectancy at birth (years): 80.53 — 69th highest of 384 metros
[in-text-ad-2]

26. Vallejo, CA
> Smoking rate: 13.8%
> Adults reporting poor or fair health: 17.2% — 138th lowest of 384 metros
> Premature deaths per 100,000: 304.0 — 92nd lowest of 384 metros
> Life expectancy at birth (years): 80.17 — 88th highest of 384 metros

25. Bellingham, WA
> Smoking rate: 13.8%
> Adults reporting poor or fair health: 15.0% — 56th lowest of 384 metros
> Premature deaths per 100,000: 263.0 — 35th lowest of 384 metros
> Life expectancy at birth (years): 81.30 — 41st highest of 384 metros
[in-text-ad]

24. Salinas, CA
> Smoking rate: 13.8%
> Adults reporting poor or fair health: 23.6% — 31st highest of 384 metros
> Premature deaths per 100,000: 246.8 — 19th lowest of 384 metros
> Life expectancy at birth (years): 82.67 — 11th highest of 384 metros
23. San Luis Obispo-Paso Robles, CA
> Smoking rate: 13.6%
> Adults reporting poor or fair health: 15.2% — 64th lowest of 384 metros
> Premature deaths per 100,000: 254.2 — 27th lowest of 384 metros
> Life expectancy at birth (years): 81.68 — 32nd highest of 384 metros

22. Burlington-South Burlington, VT
> Smoking rate: 13.6%
> Adults reporting poor or fair health: 11.8% — 3rd lowest of 384 metros
> Premature deaths per 100,000: 269.2 — 42nd lowest of 384 metros
> Life expectancy at birth (years): 81.00 — 52nd highest of 384 metros
[in-text-ad-2]

21. Sacramento-Roseville-Folsom, CA
> Smoking rate: 13.6%
> Adults reporting poor or fair health: 16.8% — 126th lowest of 384 metros
> Premature deaths per 100,000: 294.6 — 78th lowest of 384 metros
> Life expectancy at birth (years): 80.47 — 70th highest of 384 metros

20. Santa Maria-Santa Barbara, CA
> Smoking rate: 13.4%
> Adults reporting poor or fair health: 19.3% — 159th highest of 384 metros
> Premature deaths per 100,000: 258.7 — 32nd lowest of 384 metros
> Life expectancy at birth (years): 82.00 — 24th highest of 384 metros
[in-text-ad]

19. San Diego-Chula Vista-Carlsbad, CA
> Smoking rate: 13.2%
> Adults reporting poor or fair health: 15.8% — 81st lowest of 384 metros
> Premature deaths per 100,000: 243.0 — 18th lowest of 384 metros
> Life expectancy at birth (years): 82.24 — 20th highest of 384 metros

18. Olympia-Lacey-Tumwater, WA
> Smoking rate: 13.1%
> Adults reporting poor or fair health: 15.4% — 68th lowest of 384 metros
> Premature deaths per 100,000: 286.2 — 63rd lowest of 384 metros
> Life expectancy at birth (years): 80.24 — 82nd highest of 384 metros

17. Austin-Round Rock-Georgetown, TX
> Smoking rate: 13.0%
> Adults reporting poor or fair health: 16.3% — 100th lowest of 384 metros
> Premature deaths per 100,000: 248.1 — 21st lowest of 384 metros
> Life expectancy at birth (years): 81.61 — 34th highest of 384 metros
[in-text-ad-2]
16. Santa Rosa-Petaluma, CA
> Smoking rate: 12.9%
> Adults reporting poor or fair health: 15.1% — 60th lowest of 384 metros
> Premature deaths per 100,000: 241.3 — 17th lowest of 384 metros
> Life expectancy at birth (years): 82.16 — 22nd highest of 384 metros

15. Boulder, CO
> Smoking rate: 12.8%
> Adults reporting poor or fair health: 11.2% — the lowest of 384 metros
> Premature deaths per 100,000: 207.0 — 4th lowest of 384 metros
> Life expectancy at birth (years): 82.85 — 10th highest of 384 metros
[in-text-ad]

14. Santa Cruz-Watsonville, CA
> Smoking rate: 12.8%
> Adults reporting poor or fair health: 16.3% — 99th lowest of 384 metros
> Premature deaths per 100,000: 230.1 — 9th lowest of 384 metros
> Life expectancy at birth (years): 82.88 — 9th highest of 384 metros

13. Washington-Arlington-Alexandria, DC-VA-MD-WV
> Smoking rate: 12.7%
> Adults reporting poor or fair health: 14.1% — 38th lowest of 384 metros
> Premature deaths per 100,000: 253.6 — 26th lowest of 384 metros
> Life expectancy at birth (years): 82.36 — 18th highest of 384 metros

12. Oxnard-Thousand Oaks-Ventura, CA
> Smoking rate: 12.3%
> Adults reporting poor or fair health: 17.6% — 156th lowest of 384 metros
> Premature deaths per 100,000: 228.9 — 7th lowest of 384 metros
> Life expectancy at birth (years): 82.53 — 14th highest of 384 metros
[in-text-ad-2]

11. Napa, CA
> Smoking rate: 12.3%
> Adults reporting poor or fair health: 15.9% — 85th lowest of 384 metros
> Premature deaths per 100,000: 233.3 — 12th lowest of 384 metros
> Life expectancy at birth (years): 81.98 — 25th highest of 384 metros

10. Los Angeles-Long Beach-Anaheim, CA
> Smoking rate: 12.2%
> Adults reporting poor or fair health: 20.2% — 115th highest of 384 metros
> Premature deaths per 100,000: 247.6 — 20th lowest of 384 metros
> Life expectancy at birth (years): 82.59 — 12th highest of 384 metros
[in-text-ad]

9. Seattle-Tacoma-Bellevue, WA
> Smoking rate: 11.9%
> Adults reporting poor or fair health: 14.0% — 32nd lowest of 384 metros
> Premature deaths per 100,000: 265.6 — 38th lowest of 384 metros
> Life expectancy at birth (years): 81.25 — 43rd highest of 384 metros
8. Bridgeport-Stamford-Norwalk, CT
> Smoking rate: 11.7%
> Adults reporting poor or fair health: 11.9% — 5th lowest of 384 metros
> Premature deaths per 100,000: 216.2 — 5th lowest of 384 metros
> Life expectancy at birth (years): 82.98 — 6th highest of 384 metros

7. Salt Lake City, UT
> Smoking rate: 11.2%
> Adults reporting poor or fair health: 16.3% — 101st lowest of 384 metros
> Premature deaths per 100,000: 293.9 — 77th lowest of 384 metros
> Life expectancy at birth (years): 79.68 — 117th highest of 384 metros
[in-text-ad-2]

6. Logan, UT-ID
> Smoking rate: 11.0%
> Adults reporting poor or fair health: 15.2% — 63rd lowest of 384 metros
> Premature deaths per 100,000: 252.0 — 25th lowest of 384 metros
> Life expectancy at birth (years): 81.14 — 46th highest of 384 metros

5. San Francisco-Oakland-Berkeley, CA
> Smoking rate: 11.0%
> Adults reporting poor or fair health: 14.0% — 33rd lowest of 384 metros
> Premature deaths per 100,000: 217.7 — 6th lowest of 384 metros
> Life expectancy at birth (years): 83.57 — 3rd highest of 384 metros
[in-text-ad]

4. St. George, UT
> Smoking rate: 10.9%
> Adults reporting poor or fair health: 15.9% — 83rd lowest of 384 metros
> Premature deaths per 100,000: 265.2 — 37th lowest of 384 metros
> Life expectancy at birth (years): 81.96 — 26th highest of 384 metros

3. Ogden-Clearfield, UT
> Smoking rate: 10.2%
> Adults reporting poor or fair health: 14.1% — 36th lowest of 384 metros
> Premature deaths per 100,000: 283.2 — 60th lowest of 384 metros
> Life expectancy at birth (years): 79.70 — 114th highest of 384 metros

2. San Jose-Sunnyvale-Santa Clara, CA
> Smoking rate: 9.7%
> Adults reporting poor or fair health: 14.5% — 46th lowest of 384 metros
> Premature deaths per 100,000: 188.0 — the lowest of 384 metros
> Life expectancy at birth (years): 84.84 — 2nd highest of 384 metros
[in-text-ad-2]
1. Provo-Orem, UT
> Smoking rate: 7.2%
> Adults reporting poor or fair health: 13.3% — 21st lowest of 384 metros
> Premature deaths per 100,000: 254.6 — 28th lowest of 384 metros
> Life expectancy at birth (years): 80.57 — 65th highest of 384 metros
Methodology
To determine the metros with the fewest smоkers, 24/7 Tempo reviewed the share of adults who are current smоkers from the Robert Wood Johnson Foundation and the University of Wisconsin Population Health Institute joint program’s 2021 County Health Rankings & Roadmaps report. While the CHR report is from 2021, adult smоking rates are from 2018.
We used the 384 metropolitan statistical areas as delineated by the United States Office of Management and Budget and used by the Census Bureau as our definition of metros.
Metros were ranked based on the adult smоking rate. Additional information on the share of adults reporting poor or fair health, the number of deaths among residents under age 75 per 100,000, and life expectancy are also from the 2021 CHR.
The Average American Is Losing Their Savings Every Day (Sponsor)
If you’re like many Americans and keep your money ‘safe’ in a checking or savings account, think again. The average yield on a savings account is a paltry .4% today, and inflation is much higher. Checking accounts are even worse.
Every day you don’t move to a high-yield savings account that beats inflation, you lose more and more value.
But there is good news. To win qualified customers, some accounts are paying 9-10x this national average. That’s an incredible way to keep your money safe, and get paid at the same time. Our top pick for high yield savings accounts includes other one time cash bonuses, and is FDIC insured.
Click here to see how much more you could be earning on your savings today. It takes just a few minutes and your money could be working for you.
Thank you for reading! Have some feedback for us?
Contact the 24/7 Wall St. editorial team.
 24/7 Wall St.

 24/7 Wall St.
 24/7 Wall St.

